
What Is MACD Divergence and Why Does It Matter?
In the world of technical analysis, timing is everything. Entering a trade too early or too late can be the difference between a profitable position and a costly mistake. MACD divergence is one of the most powerful tools traders use to identify when a trend is losing steam — often before price confirms the reversal.
The Moving Average Convergence Divergence (MACD) indicator tracks the relationship between two exponential moving averages of an asset's price. When the direction of price action and the MACD indicator begin to disagree — moving in opposite directions — that disagreement is called divergence. It signals that momentum is weakening, and a potential reversal may be on the horizon.
Understanding MACD divergence puts you ahead of the majority of retail traders who react to price changes only after they've already happened. In this guide, we'll break down exactly how to identify, interpret, and trade MACD divergence with precision.
How the MACD Indicator Works: A Quick Refresher
Before diving into divergence, it's essential to understand what you're looking at on your chart. The MACD consists of three core components:
- MACD Line: The difference between the 12-period EMA and the 26-period EMA
- Signal Line: A 9-period EMA of the MACD line
- Histogram: The visual representation of the gap between the MACD line and Signal line
When the MACD line crosses above the signal line, it's generally considered a bullish signal. When it crosses below, it's bearish. But divergence goes deeper than simple crossovers — it reveals hidden information about the underlying strength of a move.
If you're already familiar with momentum oscillators from studying RSI, you'll find MACD divergence follows similar logic. For a foundational comparison, our guide on RSI Divergence Explained: Master Bullish & Bearish Signals is an excellent companion read.
Types of MACD Divergence Every Trader Must Know
MACD divergence comes in several forms. Recognizing which type you're looking at determines your trading strategy and risk management approach.
Bullish MACD Divergence (Regular)
Regular bullish divergence occurs when price makes a lower low, but the MACD histogram or MACD line makes a higher low. This tells you that even though price is falling, selling momentum is weakening. Buyers are starting to show up under the surface.
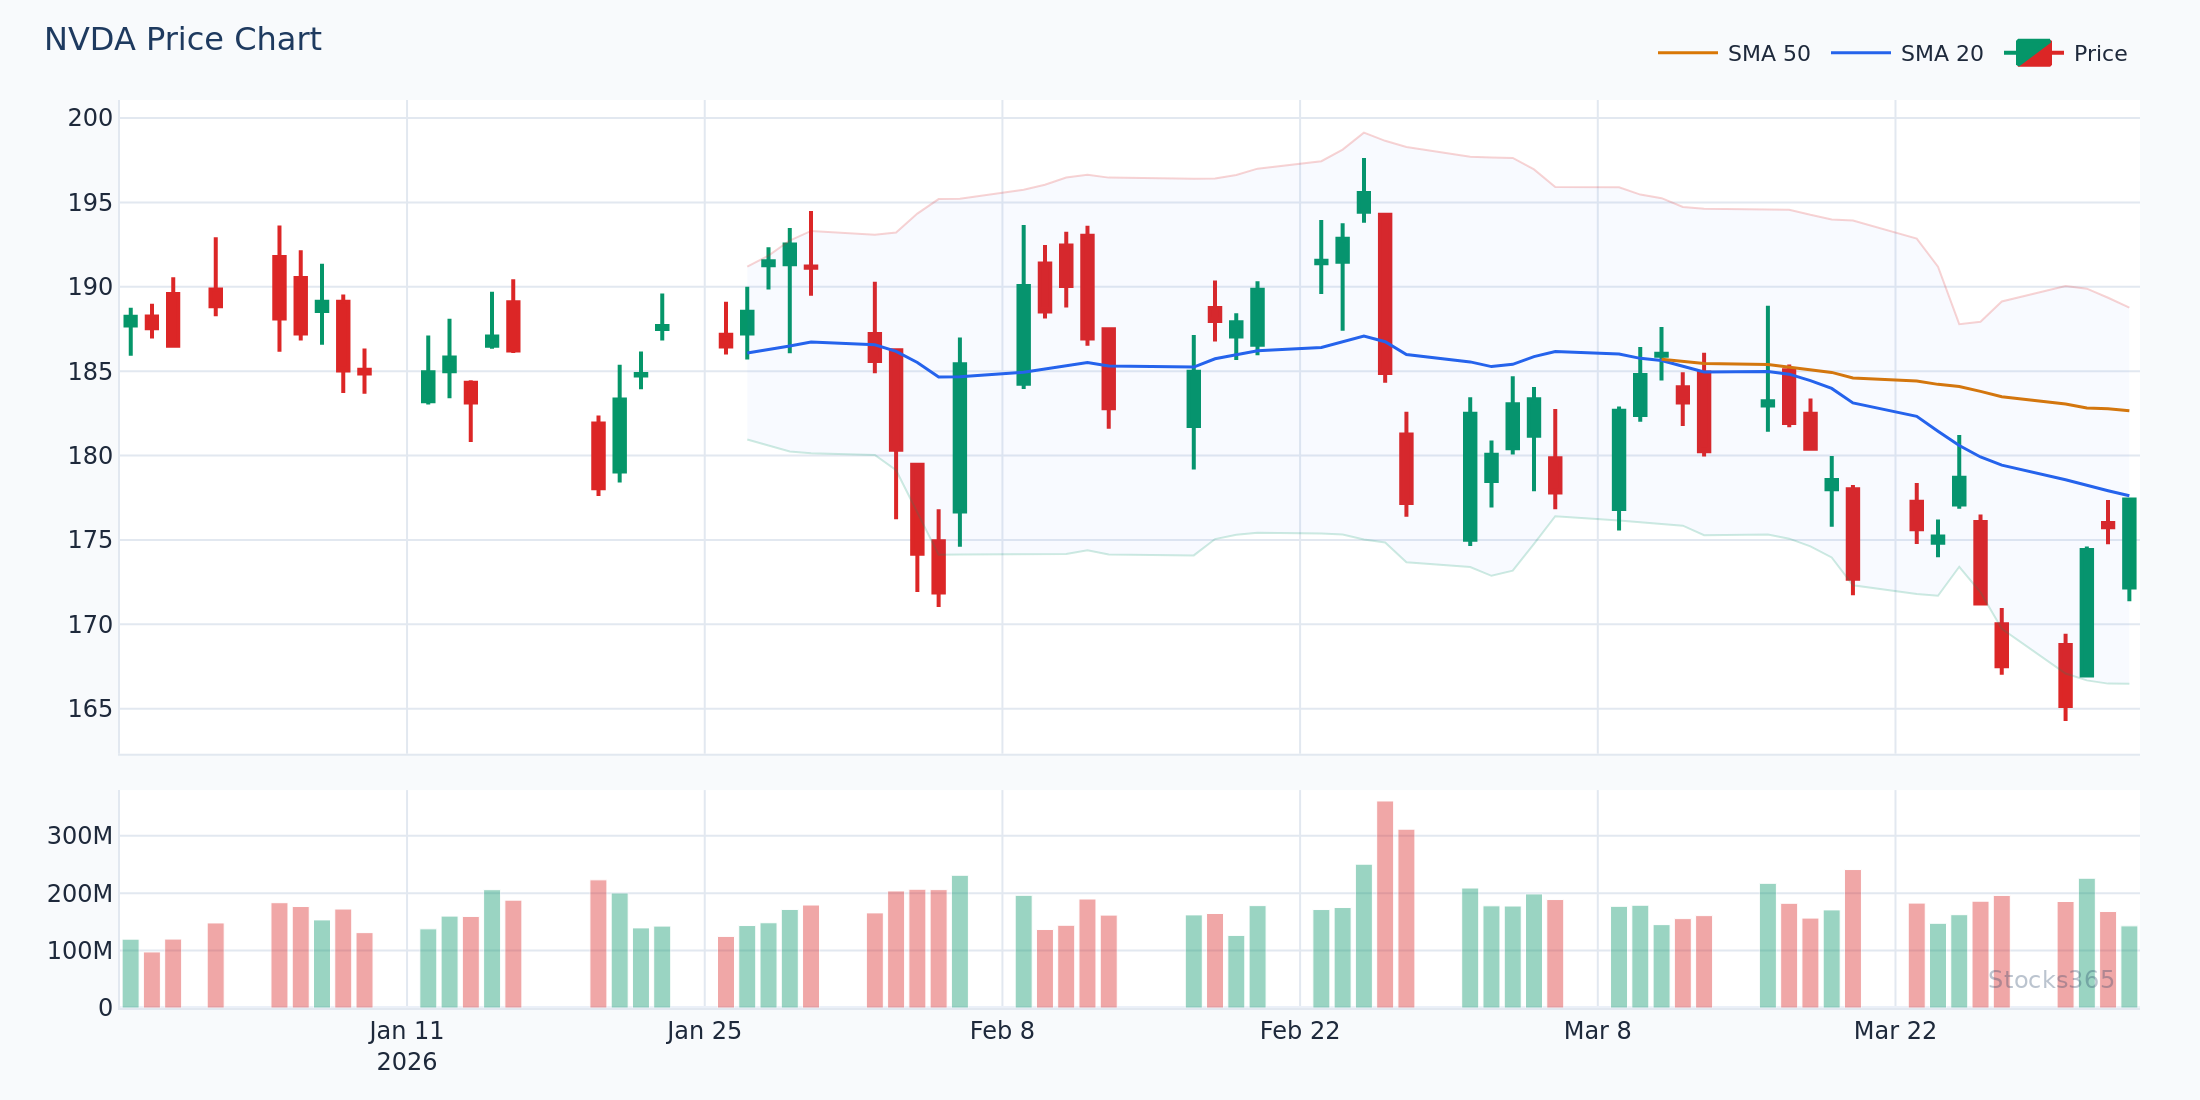
Example: Imagine NVDA is trading at $820. It drops to a low of $780, rallies briefly to $810, then falls again to $765 — a new lower low. However, the MACD line only dips to -2.1 on the second low, compared to -3.4 on the first. That discrepancy — price falling further but MACD not confirming — is classic bullish MACD divergence. A breakout above $810 with rising volume would be the entry trigger many traders wait for.
Bearish MACD Divergence (Regular)
Regular bearish divergence is the mirror image: price makes a higher high, but the MACD makes a lower high. This indicates that while price is still climbing, buying momentum is fading. The smart money may already be reducing exposure.
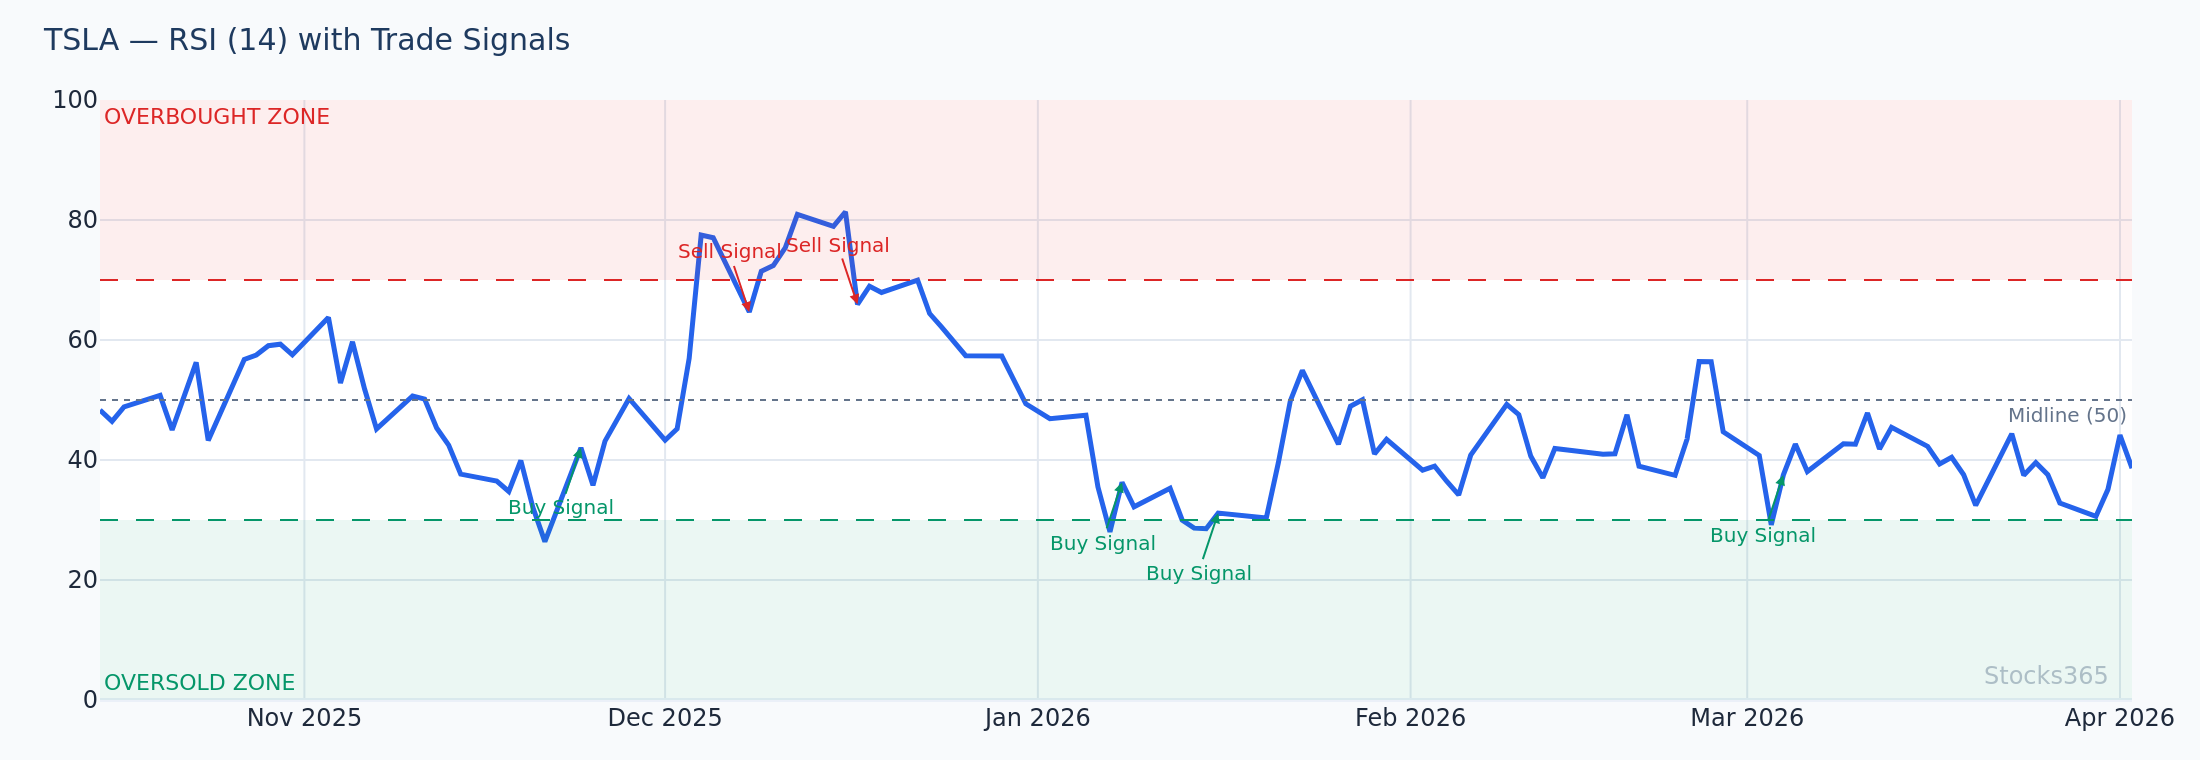
Example: TSLA rallies from $290 to $340, pulls back to $315, then pushes to a new high of $355. If the MACD only reaches 2.8 on the second peak compared to 4.1 on the first, bearish MACD divergence is forming. Traders would watch for a break below $315 support as a potential short entry or exit signal for longs.
Hidden Bullish MACD Divergence
Hidden divergence is trickier but highly valuable for trend continuation trades. Hidden bullish divergence forms when price makes a higher low (uptrend intact), but MACD makes a lower low. This signals that the pullback is a buying opportunity within a broader uptrend — the trend is likely to resume upward.
Hidden Bearish MACD Divergence
Hidden bearish divergence occurs when price makes a lower high (downtrend intact), but MACD makes a higher high. This is a signal to stay short or add to short positions, as the trend is likely to continue downward. Hidden divergence is conceptually similar to what we cover in our article on Hidden RSI Divergence: The Advanced Signal Most Traders Miss.
How to Identify MACD Divergence Step by Step
Spotting MACD divergence isn't just about eyeballing a chart. Follow this structured process to identify valid setups with confidence.
Step 1: Identify the Trend Direction
Divergence signals are most powerful when read in context. First, establish whether the asset is in an uptrend, downtrend, or consolidation. MACD divergence in a strong trend environment produces higher-probability signals than in choppy, sideways markets.
Step 2: Locate Swing Highs and Swing Lows on Price
Mark at least two clear swing points on your price chart. For bullish divergence, you need two identifiable swing lows. For bearish divergence, you need two swing highs. These swings should be clearly defined — not micro-noise, but meaningful turning points.
Step 3: Compare the Corresponding MACD Points
Look at the MACD line or histogram at the same two swing points. Draw a line connecting the two MACD readings and compare its slope to the slope of price. If they diverge — moving in opposite directions — you have a potential signal.
Pro tip: Many traders prefer to use the MACD histogram rather than the MACD line for divergence, as the histogram tends to show the discrepancy more clearly and earlier.
Step 4: Wait for Confirmation
Divergence alone is not a trade signal — it's a warning. Always wait for price confirmation before entering. Common confirmation triggers include:
- A candlestick reversal pattern (engulfing, hammer, shooting star)
- A break of a key support or resistance level
- MACD line crossing above or below the signal line
- A surge in volume on the reversal candle
Step 5: Set Your Stops and Targets
Once confirmed, place your stop loss beyond the swing high (for shorts) or swing low (for longs) that formed the divergence. Target the next major support or resistance zone, or use a risk-reward ratio of at least 1:2 as a baseline.
MACD Divergence vs RSI Divergence: Which Is Better?
A common question among traders is whether to use MACD or RSI when hunting for divergence signals. The honest answer: both have strengths, and the best traders use them together.
RSI divergence tends to give signals slightly earlier since RSI is a faster, bounded oscillator (0–100 scale). MACD divergence, being based on moving averages, tends to be slower but can provide more reliable confirmation in trending markets. When both MACD and RSI are showing divergence simultaneously, that confluence dramatically increases the probability of a genuine reversal.
For a deep dive into how RSI generates its signals, see How RSI Is Calculated: Formula Explained Step by Step. And if you're wondering how to tune your momentum indicators for different timeframes, our guide on RSI Settings: Master the Best Period for Your Strategy covers the core logic that applies to both oscillators.
Real-World MACD Divergence Examples in 2026
Theory only takes you so far. Let's examine how MACD divergence plays out in real market conditions.
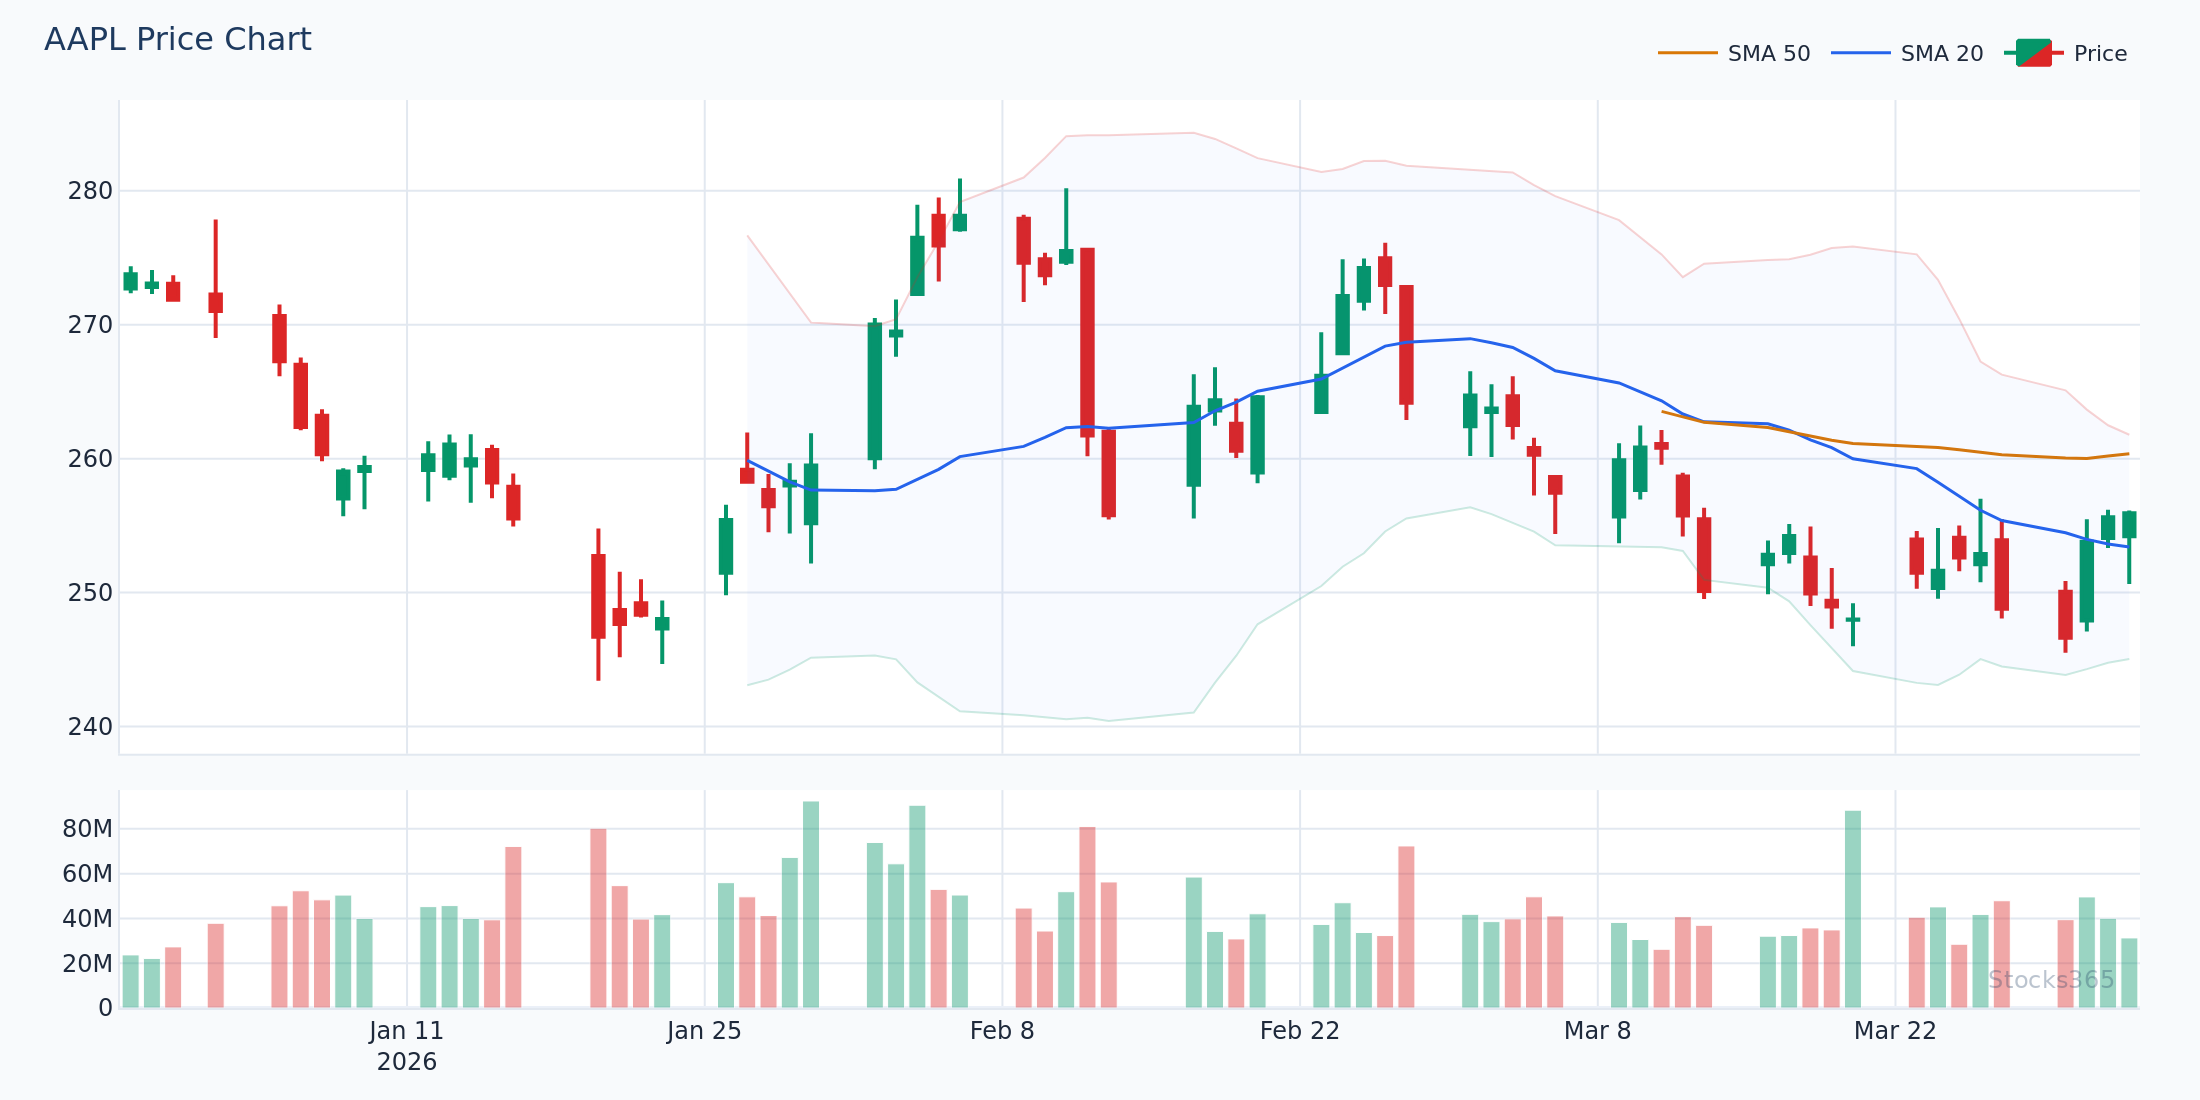
Example 1: AAPL Bearish MACD Divergence
Earlier in 2026, AAPL made a strong push from $198 to $227. On the second leg up to $227, the MACD histogram peaked at only 1.9, compared to 3.2 on the previous high at $218. Price was making new highs, but MACD told a different story. Traders who recognized this bearish divergence and waited for a break below the $215 level captured a move down toward the $198 support zone — a clean 8% reversal from peak to trough.
You can see current AAPL signal data directly on the Stocks365 AAPL Signal Page, where the Stocks365 Trust Score integrates momentum divergence data into its overall trade confidence rating.
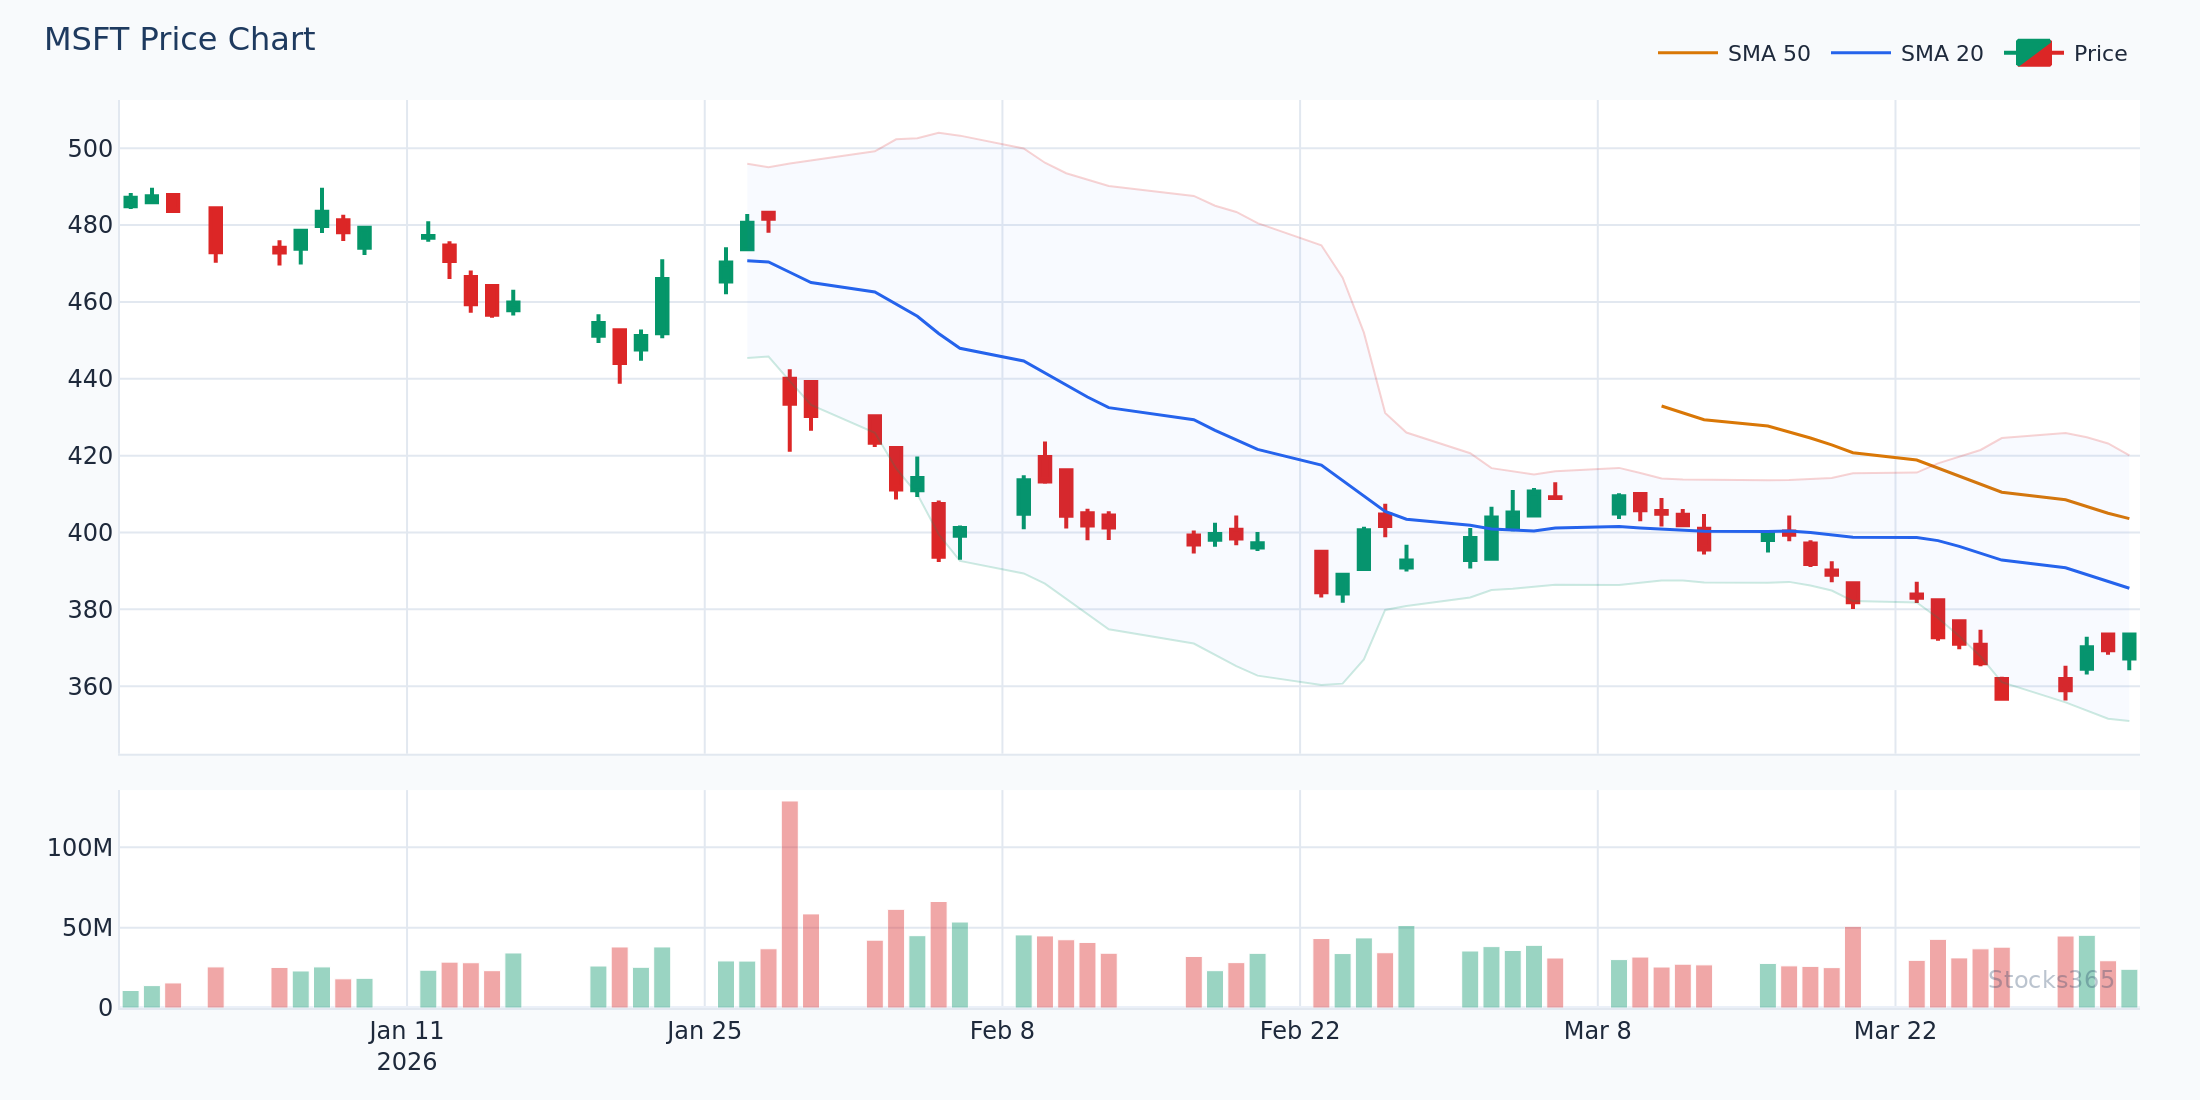
Example 2: MSFT Bullish MACD Divergence
MSFT experienced a correction phase where it printed two consecutive lower lows — dropping from $412 to $378, bouncing, then falling to $369. Despite the lower price low, the MACD histogram only dipped to -1.4 on the second low, compared to -2.8 on the first. This bullish MACD divergence, combined with a strong hammer candle at the $369 level, signaled a high-probability long setup. The subsequent rally carried MSFT back above $400 within three weeks.
Common Mistakes Traders Make With MACD Divergence
Even experienced traders misread divergence signals. Here are the most frequent pitfalls and how to avoid them:
Trading Divergence in Isolation
MACD divergence is a leading indicator — it tells you something might be changing, not that it definitely has. Trading purely on divergence without price confirmation leads to premature entries and unnecessary losses. Always require a trigger before committing capital.
Ignoring the Broader Trend
Bullish divergence in a raging downtrend may only produce a brief countertrend bounce. Know your timeframe and respect the dominant trend. Divergence on a daily chart carries far more weight than divergence on a 5-minute chart where noise is abundant.
Using the Wrong Swing Points
Not every minor dip qualifies as a swing low. Using poorly-defined swing points results in false divergence readings. Stick to clearly visible, significant turning points that most market participants can see.
Forgetting Risk Management
Even the cleanest MACD divergence setup fails sometimes. Never risk more than 1-2% of your trading capital on any single divergence trade. Set stops and respect them.
Combining MACD Divergence With Other Indicators
The real edge comes from layering MACD divergence with complementary tools. Here are the most effective combinations:
- MACD Divergence + RSI Overbought/Oversold: When bearish MACD divergence appears while RSI is above 70, the reversal signal is significantly stronger. Learn more about reading these extremes in our guide on RSI Overbought and Oversold Levels: Master the Signals.
- MACD Divergence + Support/Resistance: Divergence forming precisely at a known key level (previous high, round number, Fibonacci retracement) compounds the signal's reliability.
- MACD Divergence + Volume: Falling volume on higher price highs (while MACD diverges) confirms that the move is losing institutional backing.
- MACD Divergence + Stochastic Oscillator: The Stochastic can provide an additional confirming momentum signal. See our comparison at RSI vs Stochastic Oscillator: The Essential Guide for more on how these tools complement each other.
MACD Divergence Across Different Timeframes
One of the great advantages of MACD divergence is that it works across all timeframes, from 1-minute scalping charts to monthly investment charts. However, the quality and reliability of signals varies significantly.
Higher timeframes (daily, weekly): Divergence signals are slower to form but carry much greater statistical weight. Weekly MACD divergence on a major index or blue-chip stock can precede multi-week or multi-month reversals.
Intraday timeframes (15-minute, 1-hour): Signals are more frequent but noisier. Require stronger confirmation and tighter risk parameters.
A professional approach is to use multi-timeframe analysis: identify divergence on the daily chart to establish bias, then drop to the 1-hour or 4-hour chart to time your entry with precision.
Using the Stocks365 Dashboard to Spot MACD Divergence
Manually scanning hundreds of charts for MACD divergence is time-consuming. The Stocks365 Signals Dashboard streamlines this process by integrating MACD divergence analysis into its proprietary Trust Score system. Each stock signal is evaluated across multiple technical criteria — including momentum divergence — and given a confidence rating that helps traders quickly identify the highest-probability setups without spending hours on manual chart analysis.
Whether you're tracking large-cap tech, small-cap growth stories, or ETFs, the dashboard surfaces divergence opportunities in real time, letting you focus on execution rather than scanning.
Key Insight: MACD divergence doesn't predict the future — it identifies when the present momentum story no longer supports the current price action. That gap between price and momentum is where opportunity lives.
Key Takeaways
- MACD divergence occurs when price and the MACD indicator move in opposite directions, signaling weakening momentum and a potential reversal.
- There are four types: regular bullish, regular bearish, hidden bullish, and hidden bearish divergence — each used in different market contexts.
- Always wait for price confirmation (candlestick pattern, level break, MACD crossover) before entering a trade based on divergence.
- Combining MACD divergence with RSI, support/resistance levels, and volume analysis significantly improves signal reliability.
- Higher timeframes produce more reliable divergence signals; intraday divergence requires tighter risk controls.
- The Stocks365 Trust Score and dashboard can help you quickly surface high-probability MACD divergence setups across the market.
- Never abandon proper risk management — even the best divergence setups carry inherent uncertainty.
Frequently Asked Questions
What is MACD divergence in simple terms?
MACD divergence is when the price of an asset moves in one direction while the MACD indicator moves in the opposite direction. This disagreement suggests that the current trend is losing momentum and a reversal may be approaching. It's one of the most popular early warning signals in technical analysis.
Is MACD divergence reliable?
MACD divergence is a strong leading indicator, but it's not infallible. Its reliability increases significantly when confirmed by price action, key support/resistance levels, or other indicators like RSI. Standalone divergence signals without confirmation lead to more false positives, which is why professional traders always require a trigger before entering a position.
What's the difference between regular and hidden MACD divergence?
Regular divergence signals a potential trend reversal — price and MACD are moving against each other, suggesting the current trend is exhausted. Hidden divergence signals trend continuation — it appears during pullbacks within an existing trend, suggesting the pullback is temporary and the primary trend is likely to resume.
Which timeframe is best for MACD divergence trading?
The daily and 4-hour timeframes offer the best balance between signal quality and trading frequency for most traders. Weekly divergence is extremely reliable but rare, while 15-minute and shorter timeframes produce frequent but lower-quality signals that require strict risk management. Multi-timeframe analysis — using daily for bias and 1-hour for entry — is a widely used professional approach.
How does MACD divergence differ from RSI divergence?
Both measure momentum divergence but through different lenses. RSI divergence tends to appear slightly earlier because RSI is a faster, bounded oscillator. MACD divergence, built on moving averages, is smoother and may confirm signals that RSI catches first. When both indicators show divergence simultaneously — called confluence — the probability of a genuine reversal is considerably higher than when either appears alone. See our full guide on How to Use RSI in Trading for a deeper comparison of momentum tools.