
Why MACD Long-Term Investing Beats Short-Term Noise
Most traders associate the Moving Average Convergence Divergence (MACD) indicator with day trading or swing setups on hourly charts. But some of the most powerful — and most overlooked — applications of MACD long-term investing strategies happen on weekly and monthly timeframes, where signals carry far greater weight and reliability.
When you zoom out to a weekly or monthly chart, each MACD crossover or divergence represents weeks or months of collective market sentiment. The noise that plagues short-term traders — false breakouts, whipsaws, intraday volatility — simply disappears. What remains are clean, high-conviction signals that long-term investors can act on with real confidence.
In this guide, we break down exactly how to use MACD on higher timeframes, how to interpret weekly and monthly crossovers, and how Stocks365's intelligence platform can surface these signals before they become obvious to the crowd.
- Monthly and weekly MACD signals filter out short-term noise and reveal genuine trend shifts
- A monthly MACD crossover can precede multi-month, even multi-year, directional moves
- Combine MACD with volume, price structure, and the Stocks365 Trust Score for highest-probability setups
- Weekly MACD divergence is one of the earliest warnings of a major trend reversal
- Position sizing and patience are the two most critical skills for long-term MACD strategies
What Is MACD and How Does It Work on Higher Timeframes?
The MACD indicator was developed by Gerald Appel in the late 1970s and remains one of the most widely used technical analysis tools in the world. At its core, MACD measures the relationship between two exponential moving averages (EMAs) — typically the 12-period and 26-period EMAs — and plots the difference as the MACD line. A 9-period EMA of the MACD line, called the signal line, is then overlaid to generate crossover signals.
The MACD histogram — the bars you see oscillating above and below the zero line — represents the distance between the MACD line and the signal line. When bars grow taller, momentum is accelerating. When they shrink, momentum is fading, often a warning of an impending crossover.
On a daily chart, these mechanics produce frequent signals — useful for short-term traders but often too noisy for investors. On a weekly chart, each candle represents five trading days, so the 12-period EMA spans roughly 12 weeks of price action. On a monthly chart, the 12-period EMA represents a full year of data. This compression of time means monthly MACD crossovers are rare, and when they occur, they are historically significant.
Monthly MACD Signals: The Long-Term Investor's Most Powerful Tool
Monthly MACD signals develop slowly — sometimes taking several months to fully form — but they are remarkably reliable indicators of sustained directional moves. For a long-term investor building a core portfolio position, these signals answer the most fundamental question: Is the macro trend working for or against me?
How to Read a Monthly MACD Bullish Crossover
A monthly bullish crossover occurs when the MACD line crosses above the signal line on the monthly chart. This tells you that 12-month momentum is now accelerating to the upside relative to the longer 26-month trend. Historically, these crossovers — particularly when they occur from below the zero line — have preceded some of the strongest multi-year bull runs in individual stocks and broad indices.
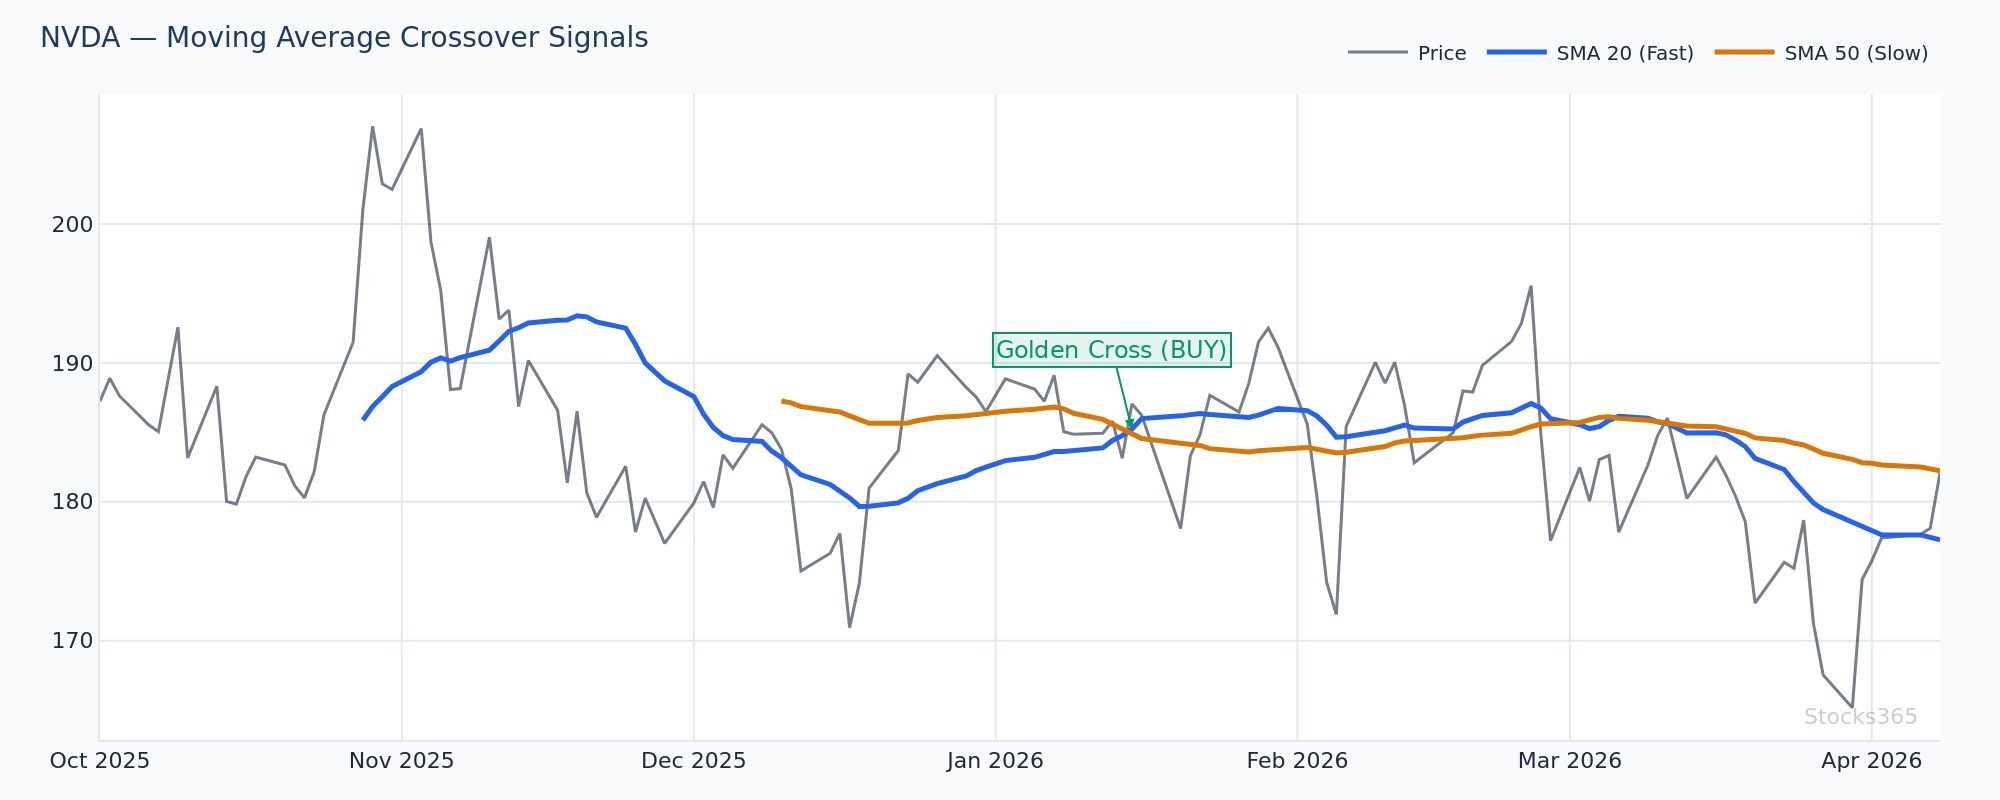
Practical example: Imagine NVDA is trading at $820 in early 2026. The monthly MACD has been trending below the signal line for nine months following a period of consolidation. In February 2026, the MACD line turns up and crosses above the signal line at a value of -2.1, while the histogram bars begin transitioning from red to green. This crossover, confirmed with expanding weekly volume, signals a potential resumption of the primary uptrend. A long-term investor who initiates a position at $820 with a stop on a monthly close below the 26-month EMA (sitting near $740) is targeting a measured move toward the $1,100–$1,200 zone over 12–18 months.
The Monthly Zero-Line Cross: A Rarer, More Powerful Signal
Even more significant than a monthly signal line crossover is a zero-line cross, where the MACD line itself crosses above or below zero. This means the 12-month EMA has crossed above (or below) the 26-month EMA — a true momentum regime change. Zero-line crosses on monthly charts are infrequent, occurring perhaps once every few years for a given stock, but they reliably mark the beginning or end of major bull markets.
When evaluating these signals on the Stocks365 signals dashboard, you can filter specifically for monthly MACD zero-line crossovers across thousands of stocks, giving you a systematic edge that individual chart-by-chart analysis cannot match.
Weekly MACD Signals: Timing Entries Within the Monthly Trend
While monthly MACD defines the direction of your long-term trade, weekly MACD helps you time your entry and manage the position with greater precision. The weekly chart strikes a balance between the noise of daily trading and the slow-moving nature of monthly signals, making it the sweet spot for most long-term investors.
Using Weekly MACD to Confirm Monthly Trend Alignment
The most reliable long-term MACD setups occur when both the monthly and weekly MACD are aligned in the same direction. This concept, sometimes called multi-timeframe confluence, dramatically improves the probability of a trade working in your favor.
- Bullish alignment: Monthly MACD above signal line AND weekly MACD crossing above signal line — highest probability long entry
- Bearish alignment: Monthly MACD below signal line AND weekly MACD crossing below signal line — confirmation of sustained downtrend
- Divergence between timeframes: Monthly bullish but weekly bearish — wait for weekly to reset and re-cross before entering
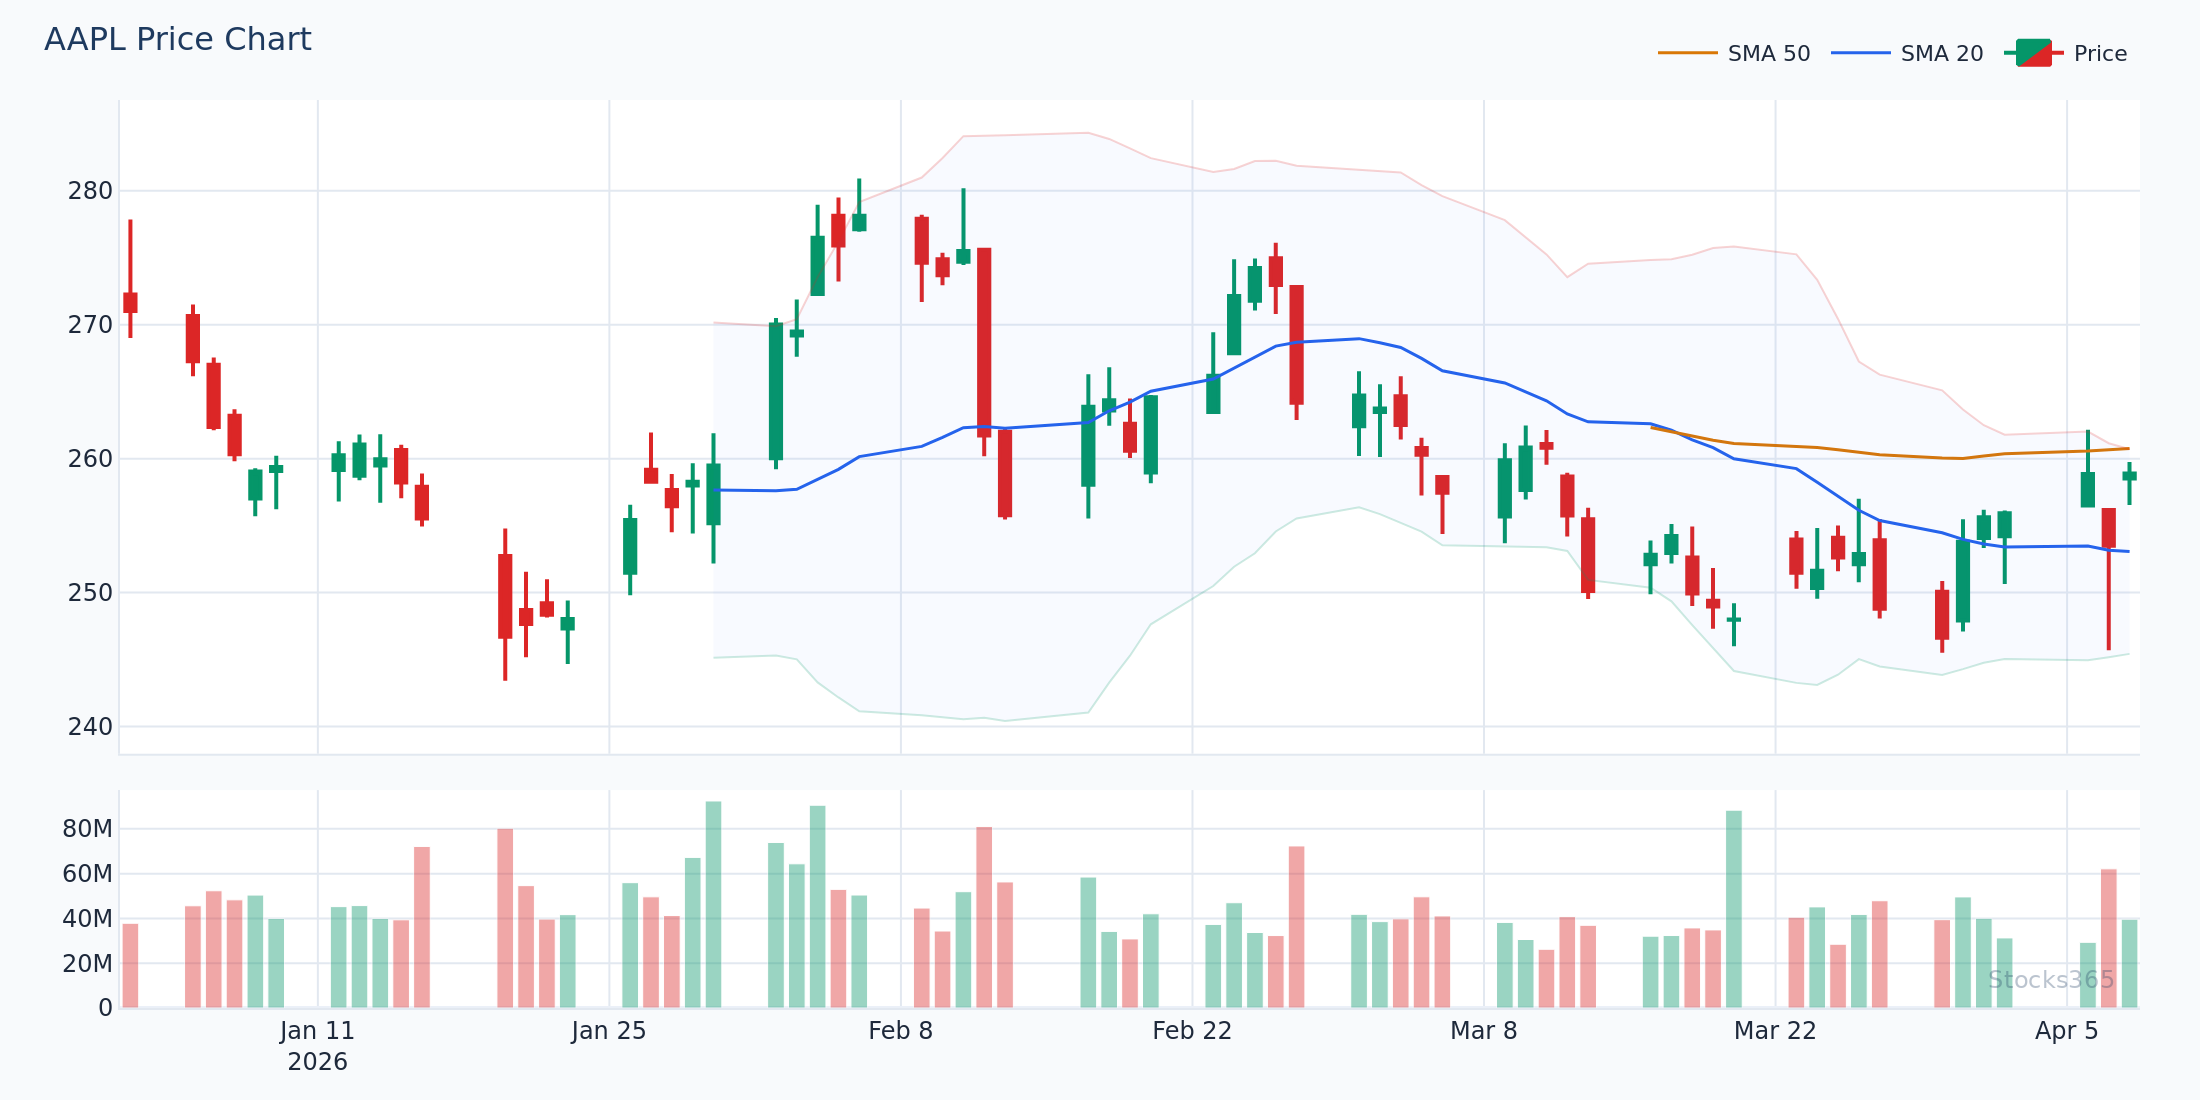
Practical example: AAPL is in a confirmed monthly uptrend with the monthly MACD well above the signal line. In March 2026, after a six-week pullback, AAPL's weekly MACD histogram is approaching zero from below. When the weekly MACD line crosses its signal line at AAPL's price of $198, this creates a textbook long entry within the context of a strong monthly trend. The stop sits below the recent weekly swing low at $188, while the target aligns with the next major resistance zone near $225.
Weekly MACD Divergence: The Early Warning System
One of the most underutilized aspects of MACD long-term investing is divergence analysis on the weekly chart. MACD divergence occurs when price makes a new high (or low) but the MACD fails to confirm, signaling weakening momentum beneath the surface.
Bearish weekly divergence example: TSLA pushes to a new 52-week high at $390 in Q1 2026. However, comparing the current MACD histogram peak to the previous high from three months ago, you notice the histogram bars are shorter — momentum is declining even as price rises. This bearish divergence on the weekly chart is an early warning for long-term holders to consider reducing exposure or tightening stops, even before the monthly trend turns negative.
This type of advanced divergence analysis is similar to what we explore in RSI signals — if you're interested in deepening your divergence toolkit, our guides on RSI Divergence Explained and Hidden RSI Divergence offer complementary perspectives that work powerfully alongside MACD analysis.
MACD Settings for Long-Term Investors: Should You Adjust the Defaults?
The standard MACD settings (12, 26, 9) were designed primarily for daily charts, but they translate well to weekly and monthly timeframes because the indicator is relative — it measures the relationship between EMAs regardless of the absolute period length. That said, some long-term investors experiment with alternative settings.
Standard Settings (12, 26, 9) on Weekly/Monthly Charts
These remain the most widely used settings for a reason: they are battle-tested, universally recognized, and therefore create self-fulfilling signal dynamics as millions of market participants watch the same levels. For most long-term investors, sticking with the defaults on weekly and monthly charts produces reliable, actionable signals without over-optimizing.
Modified Settings for Smoother Monthly Signals
Some institutional investors and longer-term portfolio managers prefer (6, 13, 5) on monthly charts, which roughly halves the sensitivity and produces smoother lines with fewer false signals on very high timeframes. Others use (5, 35, 5), which was popularized by Alexander Elder in his three-screen trading system and places greater emphasis on the longer-term momentum component.
The key principle: the longer your intended holding period, the smoother your MACD settings should be. Test any modifications against historical price data before committing real capital, and consider using the Stocks365 dashboard to compare signal quality across different configurations.
Combining MACD with Other Indicators for Long-Term Precision
MACD is powerful in isolation, but its signals become significantly more reliable when combined with complementary tools. For long-term investors, the following combinations are particularly effective.
MACD + RSI: Momentum Confirmation
The Relative Strength Index (RSI) and MACD both measure momentum but through different lenses — RSI focuses on the speed and magnitude of price changes while MACD tracks the relationship between moving averages. When both indicators align — for example, a weekly MACD bullish crossover occurring while RSI bounces from the 40–50 zone — the probability of a sustained move increases substantially.
For investors new to RSI analysis, our Complete Beginner's Guide to RSI and the detailed Step-by-Step RSI Trading Guide are excellent starting points. Understanding how to use RSI overbought and oversold levels alongside MACD crossovers can dramatically sharpen your long-term entry timing.
MACD + Volume: Confirming Institutional Participation
Price moves driven by expanding volume carry far more conviction than those on thin trading. When a weekly MACD crossover occurs alongside volume that is notably above the 20-week average, it suggests institutional participation — the kind of buying that sustains multi-month moves. Conversely, a monthly MACD crossover on declining volume is a yellow flag worth monitoring before committing fully.
MACD + Price Structure: Support and Resistance Confluence
Technical indicators never exist in a vacuum. The most powerful MACD long-term investing setups occur when a signal aligns with a significant price structure event — a breakout above a multi-year resistance level, a successful test of a major support zone, or a gap fill from a significant earnings move. Always ask: does the price chart confirm what the MACD is telling me?
For GOOGL investors in 2026, for instance, a weekly MACD bullish crossover occurring simultaneously with price reclaiming a key $175 support level — and holding it for two consecutive weekly closes — would represent a high-confidence long setup with clearly defined risk parameters.
The Stocks365 Trust Score and MACD Signal Quality
Not all MACD signals are created equal, and one of the challenges long-term investors face is distinguishing high-quality signals from marginal ones without hours of manual analysis. This is where the Stocks365 Trust Score adds genuine value.
The Trust Score evaluates each signal — including MACD crossovers on weekly and monthly timeframes — across multiple dimensions including historical signal accuracy for that specific stock, volume confirmation, alignment with broader market conditions, and confluence with other technical and fundamental factors. A MACD crossover on AMZN that scores 85+ on the Trust Score has historically shown materially better forward returns than the same crossover scoring below 60.
You can explore live MACD signals with Trust Score ratings for individual stocks like AAPL directly on Stocks365, filtering by timeframe to focus specifically on weekly and monthly setups that align with your long-term investment horizon.
Common Mistakes Long-Term Investors Make with MACD
Even experienced investors fall into predictable traps when applying MACD to long-term timeframes. Avoiding these mistakes is as important as mastering the signal mechanics themselves.
- Chasing crossovers late: By the time a monthly MACD crossover is obvious, price has often already moved significantly. Use weekly signals to enter earlier within the emerging monthly trend.
- Ignoring the histogram: The histogram provides earlier warning of a pending crossover than the lines themselves. Watching histogram bars transition from growing to shrinking gives you days or weeks of advance notice.
- Using MACD in isolation: No single indicator should drive major capital allocation decisions. MACD works best as part of a multi-factor framework including price structure, volume, and complementary oscillators like RSI.
- Misidentifying divergence: Not every lower MACD peak is genuine bearish divergence. Price must make a significantly higher high, and the divergence must be visible across at least 2–3 months of weekly bars to carry weight.
- Over-optimizing settings: Curve-fitting MACD parameters to historical data destroys the indicator's forward predictive value. Stick with standard settings or well-established alternatives.
"The monthly MACD crossover is one of the few technical signals that has consistently identified the beginning of major secular trends — not because it predicts the future, but because it quantifies the present reality of momentum shifting at the highest level." — Quantitative Research Team, Stocks365
Building a Long-Term MACD Trading Plan: Step-by-Step
A systematic approach is essential for applying MACD long-term investing strategies with consistency. Here is a practical framework you can implement immediately.
- Step 1 — Monthly trend assessment: Check the monthly MACD for your watchlist stocks. Is the MACD above or below its signal line? Above the zero line? This defines your directional bias for the next 3–12 months.
- Step 2 — Weekly timing refinement: Within stocks showing bullish monthly MACD, monitor the weekly chart for a bullish crossover, preferably occurring near a support zone or moving average.
- Step 3 — Confirm with volume and RSI: Require that volume on the breakout week exceeds the 20-week average, and that RSI is above 50 and rising. See our guide on RSI Settings for optimal configurations to pair with MACD.
- Step 4 — Define risk parameters: Set your stop loss at the most recent significant weekly or monthly swing low. For long-term positions, this is typically 8–15% below entry — wide enough to avoid being stopped out by normal volatility.
- Step 5 — Scale into position: Consider building your position in two or three tranches — initial entry at the weekly crossover, additions on pullbacks that hold above the signal, and a final tranche on a confirmed monthly crossover.
- Step 6 — Monitor for exit signals: Exit triggers include a monthly MACD bearish crossover, significant weekly divergence developing, or a monthly close below the 26-month EMA. Check Stocks365's signals dashboard for automated alerts on these conditions.
Frequently Asked Questions
What MACD settings work best for long-term investing on monthly charts?
The standard (12, 26, 9) settings work well on monthly charts for most investors, as they are widely followed and produce reliable signals. Some long-term investors prefer (6, 13, 5) for smoother monthly signals or (5, 35, 5) for an even longer-term perspective. The key is consistency — choose a setting, understand its characteristics, and apply it systematically rather than constantly optimizing.
How reliable are monthly MACD crossovers compared to daily signals?
Monthly MACD crossovers are significantly more reliable than daily signals in terms of signal quality and the magnitude of subsequent moves. Because each crossover represents a shift in longer-term momentum (spanning 12+ months of price data), false signals are far rarer. The tradeoff is that monthly signals are slow to develop, so they cannot be used for precise short-term timing — which is why combining monthly direction with weekly entry signals produces the best overall results.
Can I use MACD for long-term investing in ETFs and indices, not just individual stocks?
Absolutely. MACD performs exceptionally well on broad market ETFs (such as those tracking the S&P 500, NASDAQ, or sector indices) on weekly and monthly timeframes. Monthly MACD signals on major index ETFs are particularly valuable for asset allocation decisions — increasing equity exposure when the monthly MACD is bullish and reducing it or hedging when it turns bearish. This macro-level application of MACD can materially improve risk-adjusted returns over multi-year periods.
How does MACD compare to RSI for long-term investing?
MACD and RSI serve complementary but different roles. MACD excels at identifying the direction and momentum of a trend, making it ideal for timing major entries and exits on weekly and monthly charts. RSI is better suited for identifying overbought and oversold conditions and spotting divergences early. For long-term investing, MACD defines the primary framework while RSI provides secondary confirmation. Our RSI vs Stochastic Oscillator guide explores how different oscillators compare and when each is most effective.
What is the biggest risk of using MACD for long-term investing?
The primary risk is that MACD is a lagging indicator — it confirms trends rather than predicting them. In prolonged sideways or choppy markets, monthly MACD can generate whipsaw signals where the indicator crosses and re-crosses without a sustained directional move. Mitigating this risk requires requiring confirmation from multiple sources (volume, price structure, RSI, and the Stocks365 Trust Score) before committing significant capital to any MACD-generated signal.