
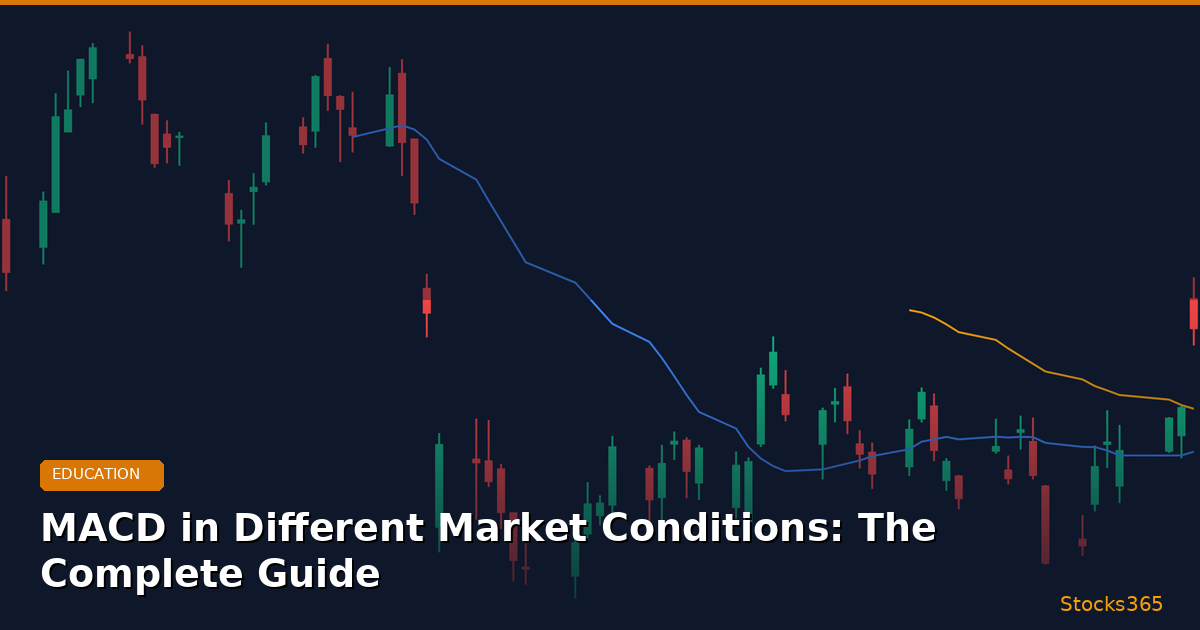
MACD in Different Market Conditions: How to Trade Trending vs. Ranging Markets
The Moving Average Convergence Divergence (MACD) indicator is one of the most widely used tools in a trader's arsenal — but here's what most traders don't tell you: MACD behaves very differently depending on whether the market is trending or ranging. Using it blindly in the wrong market condition is one of the most common reasons traders suffer unnecessary losses.
In this comprehensive guide, we'll break down exactly how MACD performs in both trending and ranging environments, how to identify which market condition you're in, and how to adapt your strategy accordingly. Whether you're trading equities, ETFs, or individual stocks on platforms like Stocks365's signals dashboard, mastering this distinction is a critical edge.
Key Insight: MACD is a momentum-following indicator at heart. It excels in trending markets — but can generate a cascade of false signals in sideways, ranging conditions. Knowing the difference can save your portfolio.
What Is MACD? A Quick Refresher
Before diving into market conditions, let's briefly recap how MACD works. The MACD indicator consists of three components:
- MACD Line: The difference between the 12-period EMA and the 26-period EMA
- Signal Line: A 9-period EMA of the MACD line
- Histogram: The visual difference between the MACD line and the signal line
When the MACD line crosses above the signal line, it's considered a bullish signal. When it crosses below, it's bearish. Simple in theory — but in practice, the context of market conditions determines whether these signals are reliable or misleading.
MACD is closely related to other momentum indicators. If you're also using RSI in your trading strategy, understanding how both behave in different market environments becomes doubly important — they share similar strengths and weaknesses tied to market structure.
Understanding Market Conditions: Trending vs. Ranging
What Is a Trending Market?
A trending market is characterized by a sustained directional move — either consistently higher highs and higher lows (uptrend) or consistently lower highs and lower lows (downtrend). In these conditions, momentum indicators like MACD thrive because price is moving with purpose and velocity.
Signs of a trending market include:
- Price consistently above or below a 50-day or 200-day moving average
- ADX (Average Directional Index) reading above 25
- Clear higher highs and higher lows (or lower highs and lower lows)
- MACD histogram expanding in one direction over multiple sessions
- Low whipsaw frequency in MACD crossovers
What Is a Ranging Market?
A ranging (or sideways) market occurs when price oscillates between defined support and resistance levels without a clear directional bias. This is actually the most common market condition — studies suggest markets spend roughly 60-70% of their time in some form of consolidation or range.
Signs of a ranging market include:
- Price bouncing between clear horizontal support and resistance zones
- ADX reading below 20
- MACD generating frequent, rapid crossovers near the zero line
- Histogram oscillating in small, choppy movements
- No sustained expansion of EMA spreads
How MACD Performs in Trending Markets
Why MACD Excels When Markets Are Moving
In a trending market, MACD is in its element. Because the indicator is built on exponential moving averages — which by nature are trend-following — it captures the momentum of a sustained directional move with impressive accuracy.
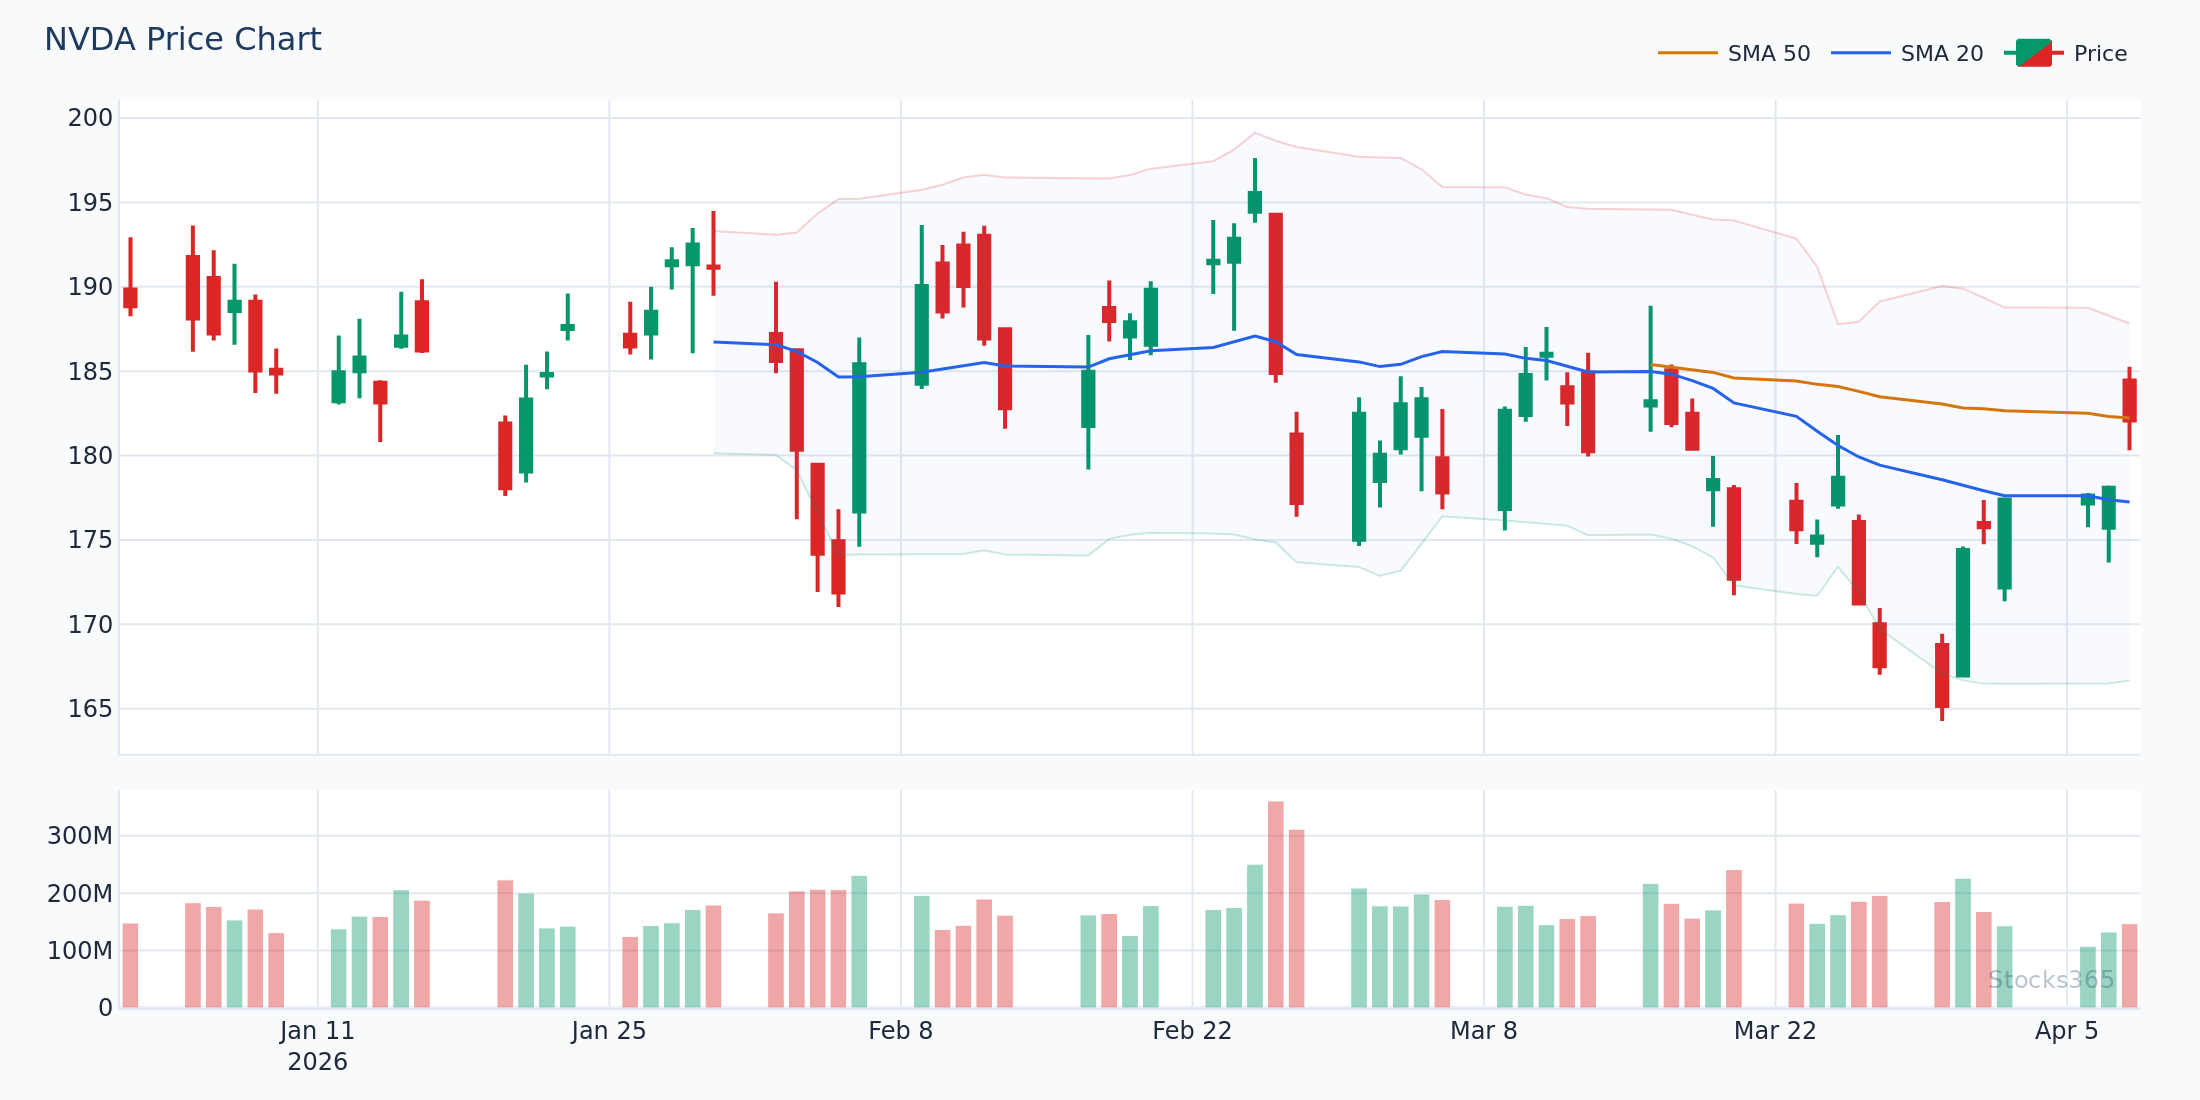
Consider a practical example: In early 2026, NVIDIA (NVDA) entered a powerful multi-week uptrend driven by continued AI infrastructure spending. A trader watching the MACD on the daily chart would have seen:
- A clean bullish crossover with the MACD line crossing decisively above the signal line
- The histogram expanding and printing consistently positive bars
- The MACD line remaining above zero for weeks, confirming sustained bullish momentum
- A hypothetical entry near $142 with a clear trend continuation signal
In this environment, MACD crossovers are meaningful because momentum has the space and velocity to sustain a directional move. Each crossover represents a genuine shift in the balance between buyers and sellers — not just random noise.
Best MACD Strategies for Trending Markets
1. Zero-Line Cross Confirmation
In a trend, one of the most reliable MACD signals is when the MACD line crosses the zero line. When the MACD line moves from negative to positive territory (zero cross), it signals that the shorter EMA has overtaken the longer EMA — a strong confirmation that bullish momentum has genuinely shifted.
Practical rule: In an uptrend, only take long trades when the MACD line is above zero. In a downtrend, only consider shorts when the MACD line is below zero. This filter alone eliminates many counter-trend false signals.
2. Histogram Divergence as Trend Exhaustion Warning
Even in trending markets, MACD can warn you when a trend is losing steam. If price continues making higher highs but the MACD histogram is printing progressively smaller bars, this bearish divergence signals weakening momentum — a potential reversal ahead.
This concept mirrors RSI divergence signals, which work on the same principle of momentum not confirming price action. Combining both creates a much higher-conviction signal.
3. Signal Line Pullback Entry
Rather than chasing MACD crossovers immediately, experienced trend traders wait for the MACD line to pull back toward the signal line in the direction of the trend before entering. This gives a better risk-to-reward entry while staying aligned with the primary trend direction.
How MACD Performs in Ranging Markets
The Danger Zone: Why MACD Struggles in Sideways Markets
Here's the uncomfortable truth: MACD was not designed for ranging markets. In a sideways, choppy environment, the indicator becomes a signal-generating machine — but the signals are mostly noise.
Why? Because MACD's crossovers rely on meaningful separation between the 12 and 26-period EMAs. In a ranging market, both EMAs hug each other closely, oscillating above and below each other repeatedly without any sustained divergence. The result? A rapid series of bullish and bearish crossovers that whipsaw a trader in and out of positions, eroding capital through spread costs, commissions, and poor fills.
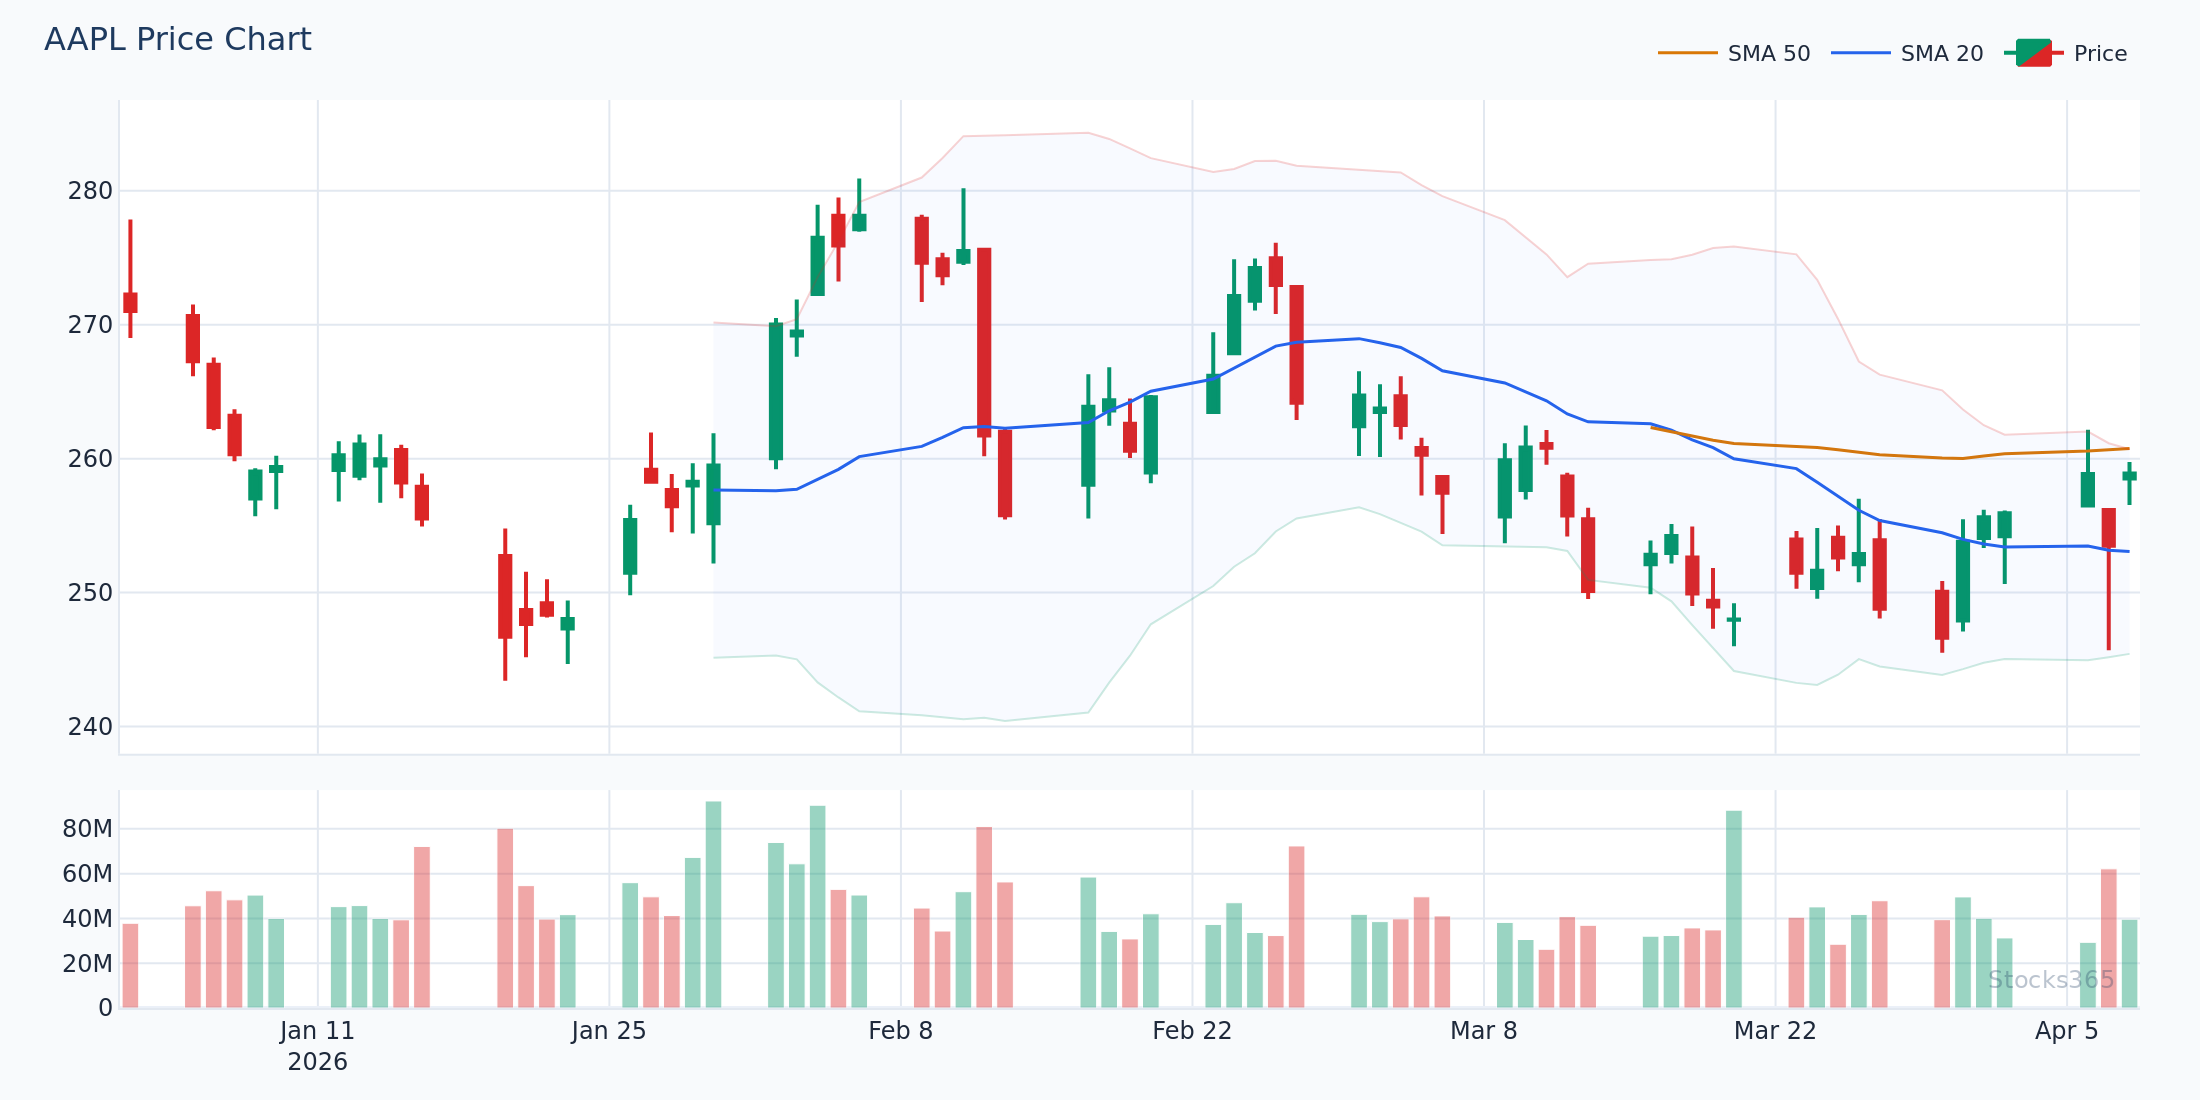
Real-world scenario: Imagine AAPL trading in a tight $3 range between $198 and $201 for two weeks. During this period, the MACD might generate 4-6 crossovers — each one appearing legitimate on the surface, yet none leading to a sustained move. A mechanical MACD-crossover trader would have taken multiple losing trades in a row simply because they ignored market structure.
Adapting MACD Strategy for Ranging Conditions
Just because MACD is less reliable in ranging markets doesn't mean you should ignore it entirely. There are specific ways to modify your approach:
1. Use MACD Histogram Extremes as Mean Reversion Signals
In a well-defined range, instead of trading MACD crossovers, watch for the histogram to reach an extreme value — an unusually large positive or negative bar. These extremes often signal short-term overbought or oversold conditions within the range, and a mean reversion back to the center is likely.
This approach essentially turns a trend-following indicator into a range-bound oscillator — but it requires discipline and confirmation from support/resistance levels.
2. Combine with Oscillators Built for Ranging Markets
In ranging conditions, pairing MACD with oscillators specifically designed for sideways markets dramatically improves signal quality. The RSI vs. Stochastic Oscillator comparison outlines exactly which tools perform best in these environments — and spoiler: the Stochastic Oscillator tends to be more reliable in tight ranges than MACD alone.
Consider this combination approach:
- Use MACD to confirm you're not in a trend (MACD hovering near zero, frequent crossovers)
- Use RSI or Stochastic to time entries at range extremes
- Use the defined support and resistance levels as your profit targets
3. Adjust MACD Settings for Shorter Time Horizons
Standard MACD settings (12, 26, 9) are optimized for trending, medium-term moves. In ranging markets, some traders reduce the parameters to something like (5, 13, 5) to make the indicator more sensitive to shorter-term price swings within the range. However, this comes with increased whipsaw risk, so careful backtesting is essential.
For guidance on adapting indicator settings to market conditions, the same principles discussed in RSI period settings optimization apply — there's no universal "best" setting, only the setting best suited to your specific market environment and timeframe.
How to Identify Which Market Condition You're In
The ADX Filter: Your Most Reliable Market Condition Gauge
The Average Directional Index (ADX) is arguably the cleanest tool for distinguishing trending from ranging conditions:
- ADX above 25: Trending market — MACD crossovers are more reliable
- ADX between 20-25: Transitional zone — proceed with caution
- ADX below 20: Ranging market — reduce MACD reliance significantly
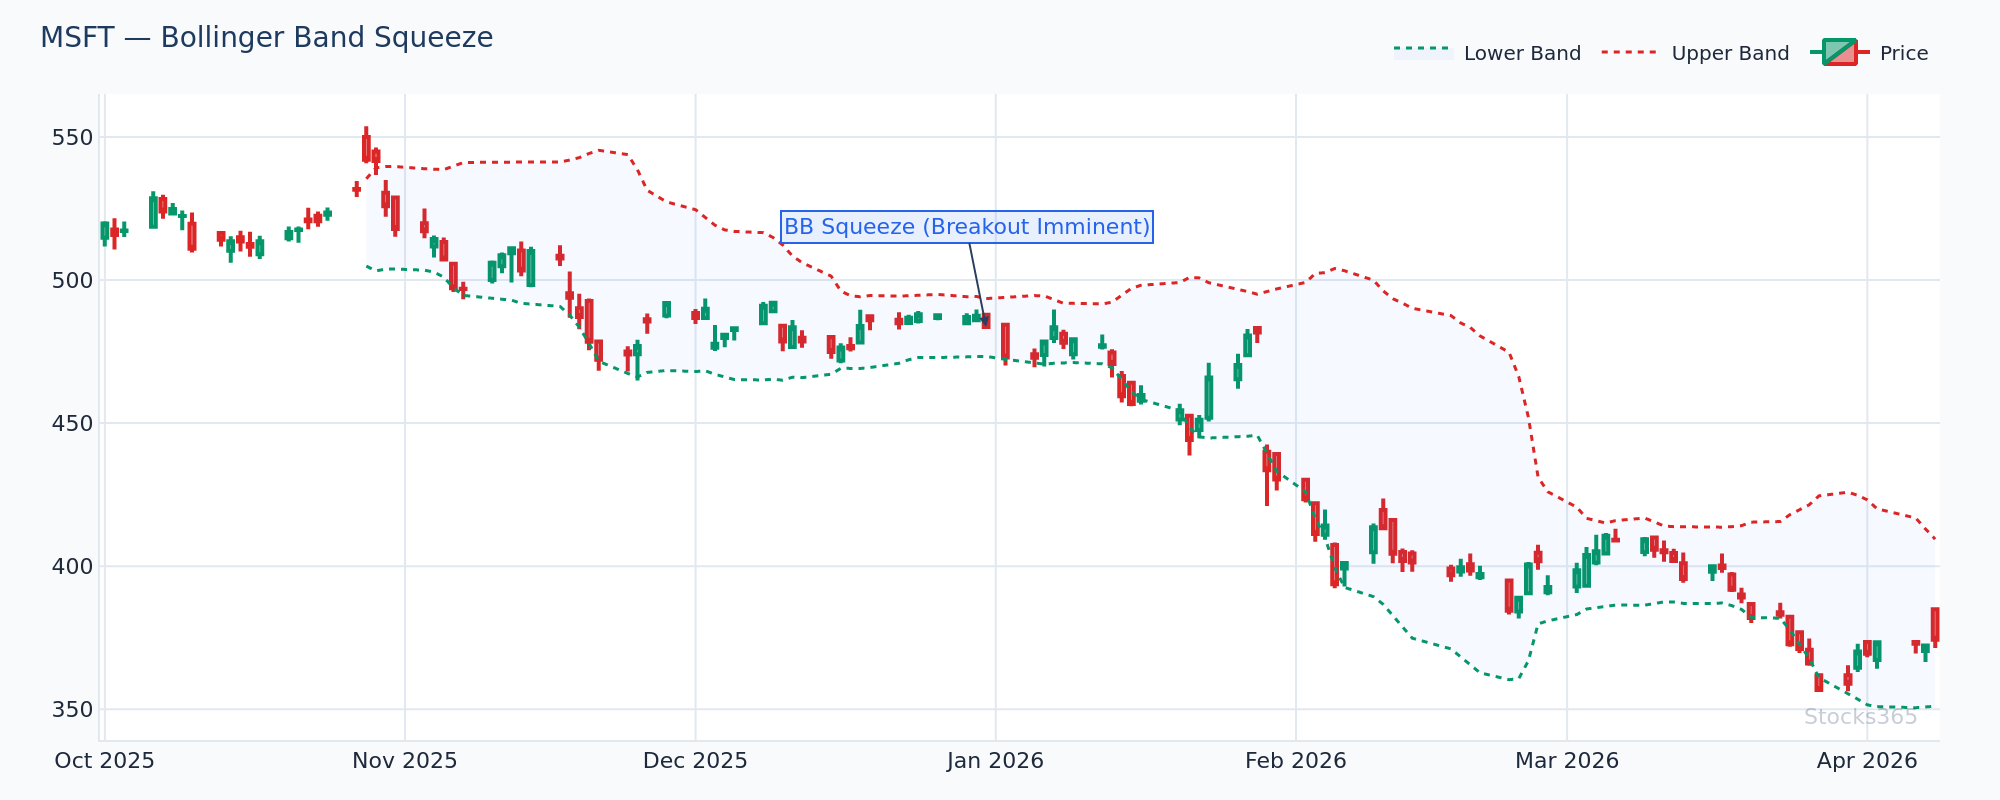
Bollinger Band Width as a Range Detector
Bollinger Band Width measures the distance between the upper and lower bands. When bands contract (squeeze), the market is ranging. When bands expand, momentum is building or a trend is underway. Combining Bollinger Band squeeze detection with MACD gives you a powerful heads-up that a breakout — and thus a more MACD-friendly environment — may be imminent.
Visual Price Structure Analysis
Sometimes the simplest approach is most effective. Step back and look at the last 20-50 candles on your chart. Is price consistently making higher highs and higher lows? You're in a trend. Is it bouncing between roughly the same highs and lows? You're ranging. This manual assessment, combined with indicator confirmation, produces the most balanced read of market conditions.
Combining MACD with RSI for Better Market Condition Awareness
One of the most powerful combinations a trader can use is MACD alongside RSI. While MACD excels at identifying trend direction and momentum, RSI provides an additional layer of overbought/oversold context that helps filter signals in both trending and ranging environments.
Here's a practical framework:
- In trending markets: Use MACD for entry timing and trend direction. Use RSI to avoid buying when the indicator shows extreme overbought conditions (above 70) on extended trends. Understand the nuances of RSI overbought and oversold signals to avoid mistiming entries at trend extremes.
- In ranging markets: Use RSI as the primary signal (buying near 30, selling near 70). Use MACD as confirmation — only act on RSI signals if the MACD histogram is pointing in the same direction.
- For hidden divergence: In both conditions, watch for hidden RSI divergence patterns that often signal trend continuation — a signal most traders miss entirely.
If you want a full walkthrough of using RSI as a complementary tool, the complete RSI trading guide on Stocks365 covers every scenario in depth.
Practical MACD Trading Framework: Step-by-Step
Step 1: Assess Market Condition First
Before looking at any MACD signal, determine the market environment using ADX, visual structure, and Bollinger Band Width. Document whether you're in a trend or a range before any trade.
Step 2: Select Your MACD Strategy Based on Condition
If trending: Focus on zero-line crosses, histogram expansion, and pullback entries in the trend direction. If ranging: Reduce position size, look for extreme histogram readings, and rely more heavily on RSI or Stochastic for timing.
Step 3: Confirm with Price Structure
Never rely solely on MACD. Confirm every signal with a corresponding price structure event — a breakout above resistance, a bounce off support, or a candlestick reversal pattern at a key level. For instance, a MACD bullish crossover on GOOGL near a well-tested $178 support level is a far higher-probability trade than the same signal appearing in the middle of a range with no structural context.
Step 4: Use Stocks365 Signal Intelligence
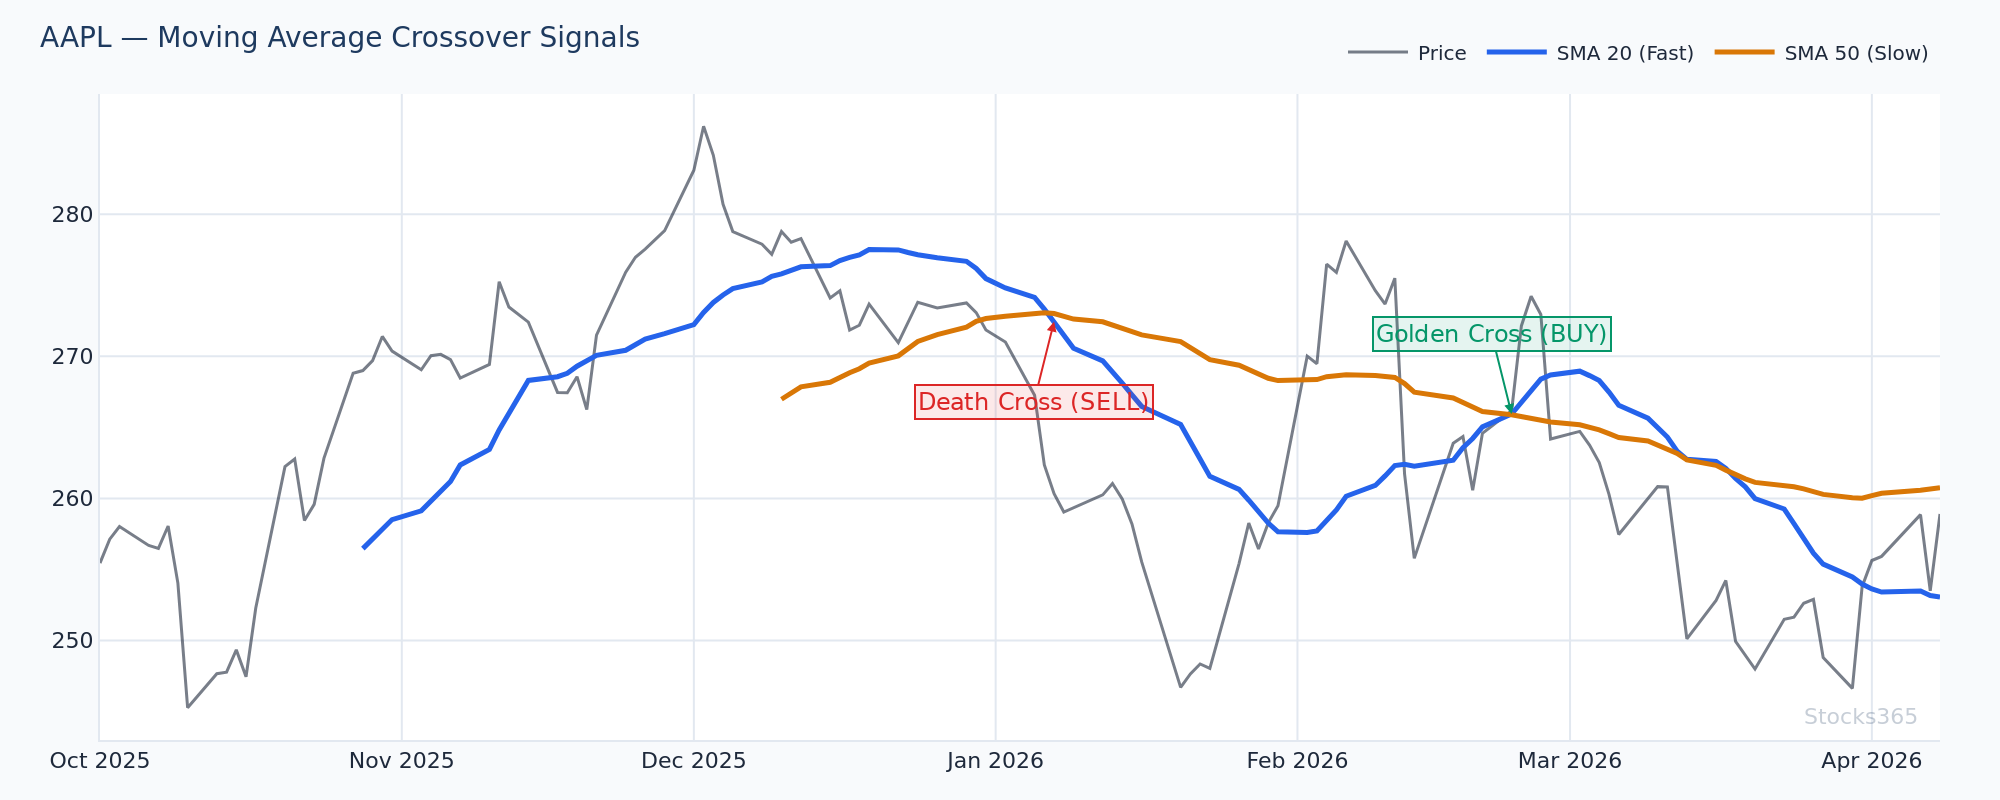
Stocks365's trust score system evaluates signals based on multiple technical confirmations, helping you distinguish high-confidence MACD setups from low-quality noise. For example, checking the AAPL signal page gives you a multi-factor view of the current technical picture — including whether the stock is in a trending or ranging regime — saving you the manual analysis time.
Step 5: Define Risk Before Entry
Set your stop-loss based on market structure, not arbitrary pip values. In a trend trade, a stop below the most recent swing low makes structural sense. In a range trade, a stop just outside the defined range boundary defines the risk clearly.
📊 Key Takeaways
- MACD is a trend-following indicator — it performs best in clearly trending markets and generates significant false signals in ranging conditions.
- Trending markets: Use MACD zero-line crosses, histogram expansion, and pullback entries to capture momentum moves.
- Ranging markets: Reduce MACD reliance; use histogram extremes for mean reversion, and combine with RSI or Stochastic for better timing.
- ADX is the cleanest filter — above 25 favors MACD trend signals; below 20 signals a ranging environment where MACD should be used cautiously.
- Combining MACD with RSI creates a balanced approach that works across both market conditions.
- Always confirm MACD signals with price structure — support/resistance levels, candlestick patterns, and trend lines.
- Use Stocks365's trust score and signal intelligence to filter high-probability setups from market noise.
Frequently Asked Questions
Is MACD better for trending or ranging markets?
MACD is significantly more reliable in trending markets. It is built on exponential moving averages, which are inherently trend-following tools. In ranging markets, MACD tends to generate frequent, unreliable crossovers — known as whipsaws — that can lead to a string of small losses. Always assess market structure before applying MACD signals.
How do I know if the market is trending or ranging?
The most reliable method is to use the ADX indicator alongside visual price structure analysis. An ADX above 25 suggests a trending environment; below 20 indicates ranging. Bollinger Band Width contraction (squeeze) is also a strong signal of a ranging, low-volatility market. Combining these tools gives you a multi-confirmation read of the current market regime.
What MACD settings work best in a ranging market?
Standard MACD settings (12, 26, 9) are optimized for trending environments. In ranging markets, some traders experiment with shorter parameters like (5, 13, 5) for greater sensitivity to smaller price swings. However, this increases whipsaw frequency. A better approach for ranging markets is to pair standard MACD with purpose-built oscillators like RSI or Stochastic — as explored in depth in our RSI vs. Stochastic guide.
Can MACD divergence work in both trending and ranging markets?
Yes — MACD divergence (where price makes a new high or low but the MACD does not confirm it) can be a valuable signal in both conditions. In trending markets, bearish divergence warns of potential trend exhaustion. In ranging markets, divergence at the boundaries of the range can signal a failed breakout attempt. However, divergence alone is not a trade entry signal — always wait for price confirmation before acting. For similar divergence concepts applied to RSI, see our RSI divergence guide.
Should I use MACD alone or combine it with other indicators?
You should never rely on MACD alone, regardless of market conditions. In trending markets, combine it with ADX (for trend strength confirmation) and price structure analysis. In ranging markets, pair it with RSI, Stochastic, or Bollinger Bands for better oscillation timing. Multi-indicator confirmation — especially when aligned with Stocks365's trust score system — significantly improves the reliability of any trading signal.