
Why the MACD Moving Average Strategy Outperforms Single-Indicator Trading
One of the most persistent mistakes traders make is relying on a single technical indicator to generate buy and sell signals. The market is too complex, too dynamic, and too influenced by institutional players to trust any one tool in isolation. That's precisely why the MACD moving average strategy — built on the concept of double confirmation — has become one of the most respected approaches in professional technical analysis.
By combining the Moving Average Convergence Divergence (MACD) indicator with a traditional moving average overlay on price, traders create a two-layer filter that dramatically reduces false signals, confirms trend direction, and improves the timing of entries and exits. In this guide, we'll break down exactly how this strategy works, how to configure it, and how to apply it to real trades in today's market environment.
Key Principle: Double confirmation means two independent signals must agree before you act. When MACD and a moving average both point in the same direction, the probability of a successful trade increases significantly.
Understanding the Two Components of This Strategy
What Is MACD and How Does It Work?
The Moving Average Convergence Divergence (MACD) is a momentum-based trend-following indicator developed by Gerald Appel in the late 1970s. Despite its age, it remains one of the most widely used indicators in institutional and retail trading alike — and for good reason.
The standard MACD is constructed from three components:
- MACD Line: The difference between the 12-period EMA and the 26-period EMA
- Signal Line: A 9-period EMA of the MACD Line
- Histogram: A visual representation of the distance between the MACD Line and Signal Line
When the MACD Line crosses above the Signal Line, it's considered a bullish signal. When it crosses below, it's bearish. The histogram expanding or contracting tells you whether momentum is accelerating or decelerating — crucial information for timing your entries.
What Moving Averages Confirm Trend Direction
Moving averages smooth out price noise and help traders identify the dominant trend. In the MACD moving average strategy, the most commonly used overlays are:
- 50-period EMA: Mid-term trend filter — ideal for swing trading on daily charts
- 200-period EMA: Long-term trend baseline — institutional-grade trend direction
- 20-period EMA: Short-term momentum filter — useful for day traders on 15-minute or 1-hour charts
- Golden/Death Cross: When the 50 EMA crosses above or below the 200 EMA — the strongest macro signal
The role of the moving average in this strategy is not to generate standalone signals but to qualify the MACD signals you receive. A MACD bullish crossover is far more reliable when price is already trading above the 50 EMA and the 200 EMA is sloping upward.
The Double Confirmation Framework: Rules and Setup
Setting Up Your MACD Moving Average Strategy
Before placing a single trade, you need a clearly defined ruleset. Here's the exact framework used by professional traders deploying this strategy:
Chart Setup:
- Timeframe: Daily chart for swing traders, 1-hour or 4-hour for intraday traders
- Moving Averages on price: 50 EMA (blue) and 200 EMA (red)
- MACD settings: Standard (12, 26, 9) — displayed as a separate panel below price
Bullish Double Confirmation — All Three Must Be True:
- Price is trading above the 50 EMA
- The 50 EMA is above the 200 EMA (or approaching a Golden Cross)
- MACD Line crosses above the Signal Line, ideally from below the zero line
Bearish Double Confirmation — All Three Must Be True:
- Price is trading below the 50 EMA
- The 50 EMA is below the 200 EMA (or a Death Cross has occurred)
- MACD Line crosses below the Signal Line, ideally from above the zero line
Pro Tip: The strongest MACD signals occur when the crossover happens near the zero line. A crossover from deeply negative territory into positive territory often signals exhaustion rather than strength — be cautious with these setups.
Entry, Stop Loss, and Target Levels
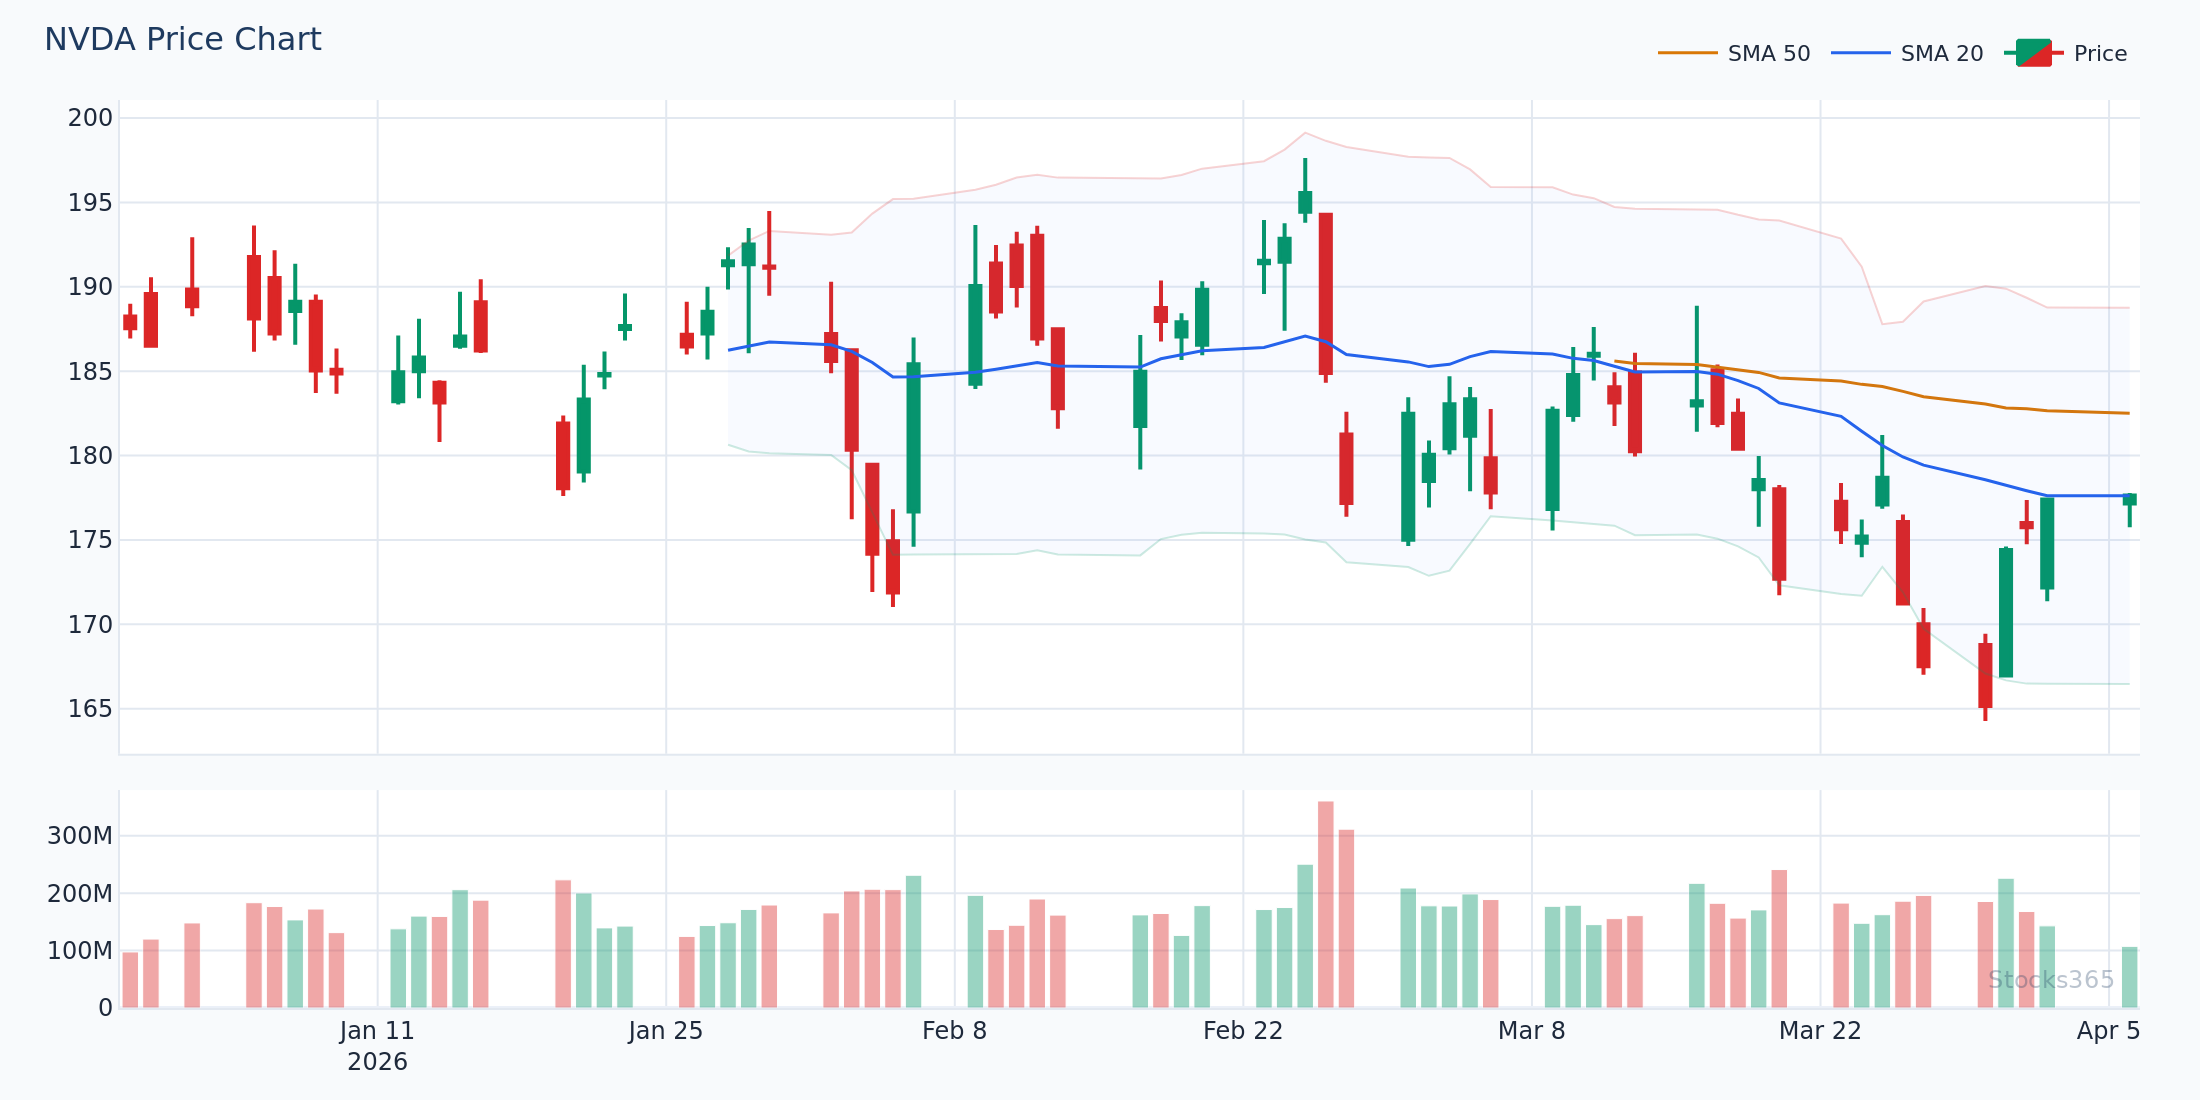
Let's walk through a practical example using NVIDIA (NVDA) in early 2026. Suppose NVDA has been in a confirmed uptrend with price above both its 50 EMA ($132.50) and 200 EMA ($118.40). After a brief pullback, the MACD Line dips toward the zero line and then crosses bullishly back above the Signal Line at a reading of +0.85.
Trade Setup:
- Entry: $138.20 (next candle open after MACD bullish crossover confirmed)
- Stop Loss: $131.80 (just below the 50 EMA — the structure support level)
- Target 1: $148.50 (1.5x risk-reward — first resistance zone)
- Target 2: $156.00 (2.3x risk-reward — prior swing high)
- Risk per trade: $6.40 per share
This setup adheres to the double confirmation rule: the moving average structure confirms the bullish trend, and the MACD provides the momentum-based trigger. Without both, the trade doesn't qualify.
How to Avoid the Most Common MACD Moving Average Mistakes
Mistake 1: Taking Every MACD Crossover Regardless of Trend
The MACD generates crossovers constantly — many of which are noise, not signal. In a sideways or choppy market, you'll see the MACD whipsawing above and below the Signal Line repeatedly, leading to losses if you act on every crossover.
The moving average filter solves this problem. If price is oscillating around the 50 EMA with no clear direction, the EMA structure won't align with the MACD signal, and you'll know to stay out. Only take MACD crossovers when the EMA structure strongly supports the signal direction.
Mistake 2: Ignoring the MACD Histogram
Most traders focus exclusively on the MACD/Signal Line crossover and ignore the histogram. This is a mistake. The histogram shows you whether momentum is building or fading before the crossover occurs. When you see the histogram bars shrinking toward zero while price is still trending, that's your early warning that a crossover may be imminent — giving you more time to prepare your entry.
Mistake 3: Using the Wrong Timeframe
The MACD moving average strategy performs best when the MACD timeframe and the moving average timeframe are aligned. Using a daily MACD signal while only referencing a 5-minute EMA creates confusion. Keep everything on the same chart timeframe, and if you use multiple timeframes, always let the higher timeframe trend dictate your directional bias.
Mistake 4: Forgetting About Volume
A MACD bullish crossover backed by rising volume is far more reliable than one occurring on declining volume. Whenever possible, confirm your double confirmation signal with a third layer: volume expansion in the direction of the signal. This transforms your strategy from double to triple confirmation — the gold standard for high-probability setups.
Combining the MACD Moving Average Strategy with RSI
While the MACD and moving average combination is powerful on its own, many professional traders add the Relative Strength Index (RSI) as a third confirmation layer. The RSI measures the speed and magnitude of price movements, helping you identify whether an asset is overbought or oversold at the moment of a MACD crossover.
For example, if MACD generates a bullish crossover while the RSI is reading 72 (overbought territory), that's a warning sign — the move may be losing steam just as you're about to enter. Conversely, a MACD bullish crossover when RSI is at 42 (recovering from oversold conditions) is a high-conviction signal. If you're unfamiliar with RSI mechanics, the Stocks365 guide on What Is RSI? The Complete Beginner's Guide is an excellent starting point.
For more advanced RSI applications that pair beautifully with MACD signals, you should also study RSI Divergence — a technique where the RSI and price move in opposite directions, often preceding major reversals. When RSI divergence aligns with a MACD crossover and a moving average confirmation, you have one of the highest-probability setups available to retail traders.
The Stocks365 article on Hidden RSI Divergence goes even deeper, revealing a more advanced form of divergence that most traders completely miss — and one that pairs exceptionally well with MACD continuation signals.
Configuring RSI Settings for MACD Confirmation
When adding RSI to your MACD moving average strategy, the standard 14-period RSI works well for most traders. However, depending on your trading style and the asset you're trading, you may want to experiment with different periods. The Stocks365 resource on RSI Settings and the Best Period for Your Strategy provides detailed guidance on this optimization process.
For overbought and oversold thresholds, the traditional levels of 70 and 30 work for most assets. But in strongly trending markets, some traders adjust these to 80 and 40 to account for the tendency of trending assets to remain "overbought" for extended periods. The Stocks365 guide on RSI Overbought and Oversold Levels explains exactly how and when to make these adjustments.
Real-World Application: Step-by-Step Trade Example
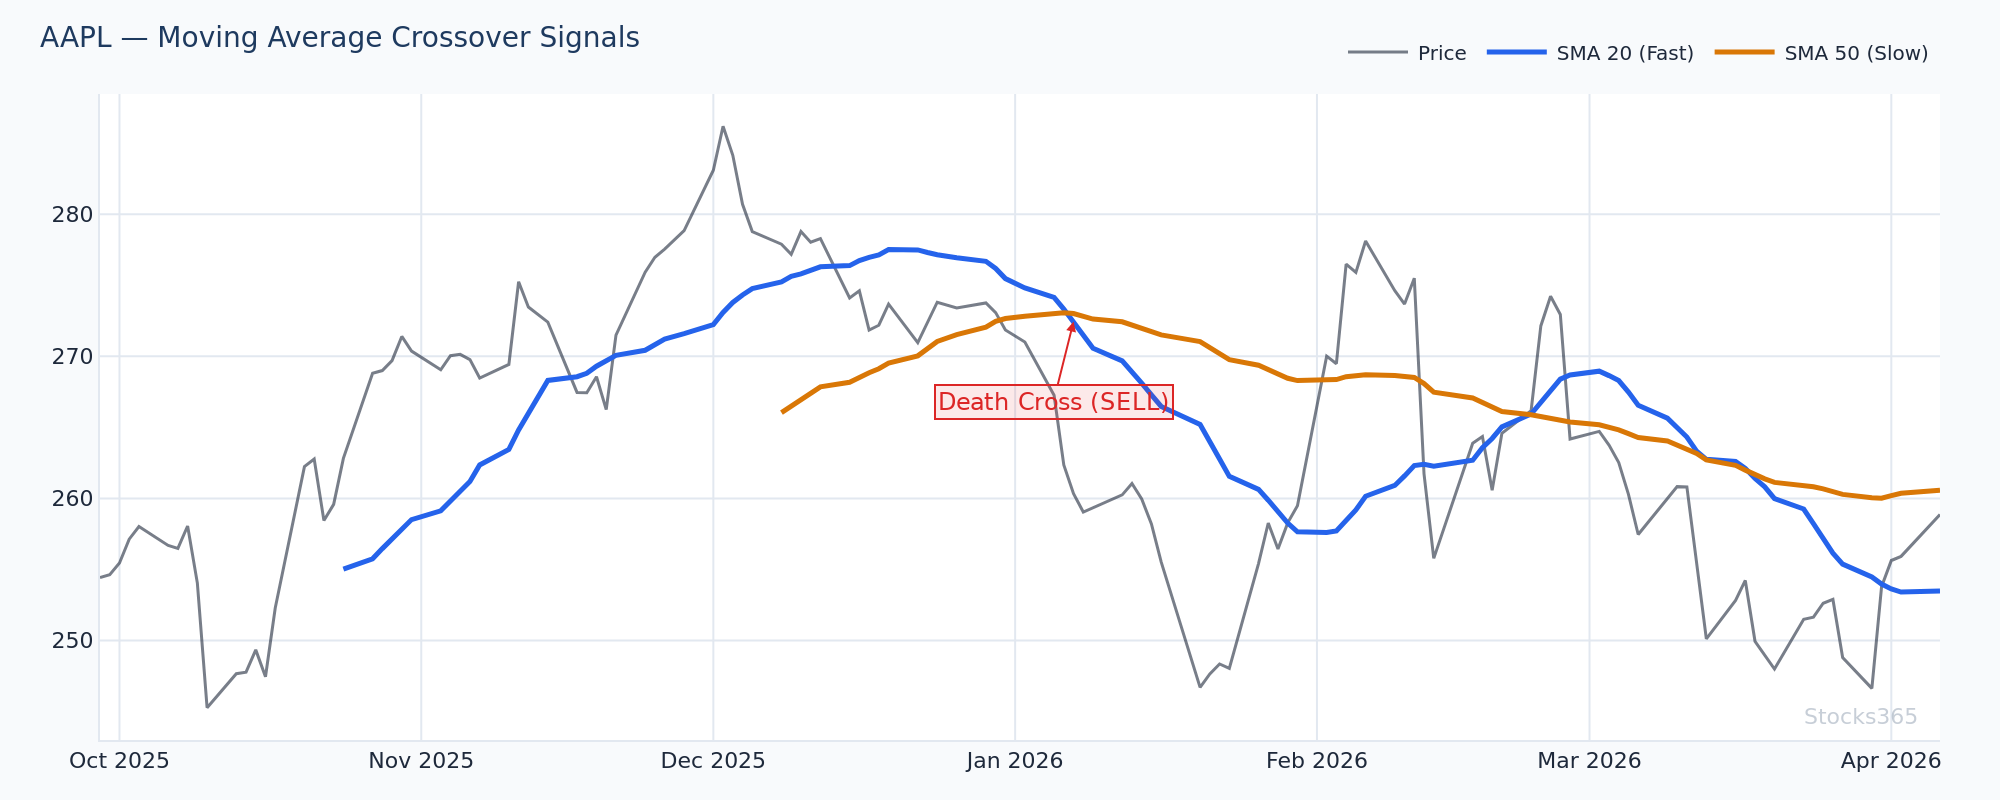
Analyzing Apple (AAPL) with the Double Confirmation Method
Let's walk through a complete trade scenario using Apple (AAPL) to illustrate how the MACD moving average strategy works in practice. You can view live signal data for AAPL on the Stocks365 AAPL signal page.
Market Context (Daily Chart):
- AAPL has been in a bullish trend for 6 weeks
- Price: $212.40
- 50 EMA: $205.80 (price is above — bullish EMA structure)
- 200 EMA: $192.30 (well below price — strong long-term uptrend)
- Golden Cross in place (50 EMA above 200 EMA)
MACD Reading:
- MACD Line: +1.42, crossing above Signal Line: +1.08
- Histogram: Turning positive after three days of contraction
- Crossover occurring near the zero line — high-quality signal
RSI Reading:
- RSI at 54 — neutral to slightly bullish, plenty of room to run
Trade Execution:
- Entry: $212.40 (confirmed double confirmation — EMA structure + MACD crossover)
- Stop Loss: $204.50 (below 50 EMA with a small buffer)
- Risk: $7.90 per share
- Target 1: $224.25 (1.5:1 R:R — prior resistance)
- Target 2: $236.00 (2.7:1 R:R — Fibonacci extension level)
- Position Size: Based on 1-2% account risk rule
This is a textbook double confirmation setup. All indicators align, the risk is clearly defined, and the reward potential is attractive. The Stocks365 signals dashboard can help you identify similar setups across hundreds of stocks in real time, with trust scores that reflect the strength of each signal based on multiple technical factors.
MACD Moving Average Strategy Across Different Market Conditions
Bull Markets: Riding Continuation Signals
In a strong bull market, the MACD moving average strategy shines with continuation setups. Look for pullbacks where price dips toward the 50 EMA, the MACD pulls back toward the zero line, and then both reset bullishly together. These "reset" entries often offer better risk-reward than chasing breakouts.
Bear Markets: Shorting with Double Confirmation
The strategy works equally well in bear markets, just in reverse. When price is below both EMAs, the 50 EMA is sloping downward below the 200 EMA, and MACD crosses bearishly below the Signal Line — that's a high-confidence short setup. The challenge in bear markets is that relief rallies can be violent, so tighter stop management is essential.
Sideways/Choppy Markets: Stay Out
When the 50 EMA and 200 EMA are tangled or flat, and MACD is oscillating tightly around the zero line — this is not a time to trade this strategy. Accept that no strategy works in all conditions and preserve capital for when the setup is clean. Patience is not a passive skill; it is an active, profitable discipline.
Using Stocks365 to Automate Double Confirmation Signal Detection
Manually scanning for MACD and moving average alignment across hundreds of stocks is time-consuming and prone to human error. The Stocks365 signals dashboard automates this process, using its proprietary trust score system to rank signals by their reliability and confluence across multiple technical indicators.
When Stocks365 generates a high trust score for a signal, it means the system has identified alignment across multiple confirmation layers — not just MACD and moving averages, but often RSI levels, volume patterns, and broader market context. This gives you instant access to the kind of multi-factor confirmation that would otherwise require hours of manual analysis.
For traders who want to go deeper into multi-indicator analysis, the comprehensive Stocks365 guide on How to Use RSI in Trading provides a full step-by-step framework that complements the MACD moving average strategy perfectly.
Key Takeaways
📊 MACD Moving Average Strategy — Key Takeaways:
- ✅ Never act on a MACD signal without confirming EMA structure alignment
- ✅ Bullish setup: Price above 50 EMA, 50 EMA above 200 EMA, MACD bullish crossover
- ✅ Bearish setup: Price below 50 EMA, 50 EMA below 200 EMA, MACD bearish crossover
- ✅ The strongest MACD crossovers occur near the zero line — not from extreme readings
- ✅ Add RSI as a third confirmation layer to filter overbought/oversold entries
- ✅ Avoid this strategy in choppy, trendless markets — wait for clear EMA structure
- ✅ Always define your stop loss before entry — place it below the 50 EMA for long trades
- ✅ Use volume expansion as a bonus fourth confirmation for highest-probability setups
- ✅ The Stocks365 trust score system can help automate multi-indicator confluence detection
Frequently Asked Questions
What is the best moving average to use with MACD?
The most effective combination depends on your trading timeframe. For swing traders using daily charts, the 50 EMA and 200 EMA provide the ideal trend structure to filter MACD signals. Day traders working on 1-hour charts often prefer the 20 EMA and 50 EMA pairing. The key is consistency — always use the same EMA settings so you can objectively evaluate signal quality over time.
How reliable is the MACD moving average strategy?
No strategy is 100% reliable, but the double confirmation approach significantly improves accuracy compared to using MACD alone. Historical backtests suggest that filtering MACD signals with EMA structure can improve win rates by 15-25% while also improving risk-reward profiles. Results vary by asset, timeframe, and market condition, which is why combining it with RSI and volume provides additional edge.
Can I use this strategy for day trading?
Yes, the MACD moving average strategy works on intraday timeframes, but with caveats. Lower timeframe charts generate more noise, so you'll need to apply stricter filters. Many successful day traders use a top-down approach: identify the trend on the 4-hour chart using EMA structure, then time entries on the 15-minute or 30-minute chart using MACD crossovers. This higher-timeframe bias dramatically improves intraday signal quality.
How is MACD different from RSI and should I use both?
MACD is a trend-following momentum indicator that measures the relationship between two EMAs — it excels at identifying trend direction and momentum shifts. RSI is an oscillator that measures the speed of price changes to identify overbought and oversold conditions. They measure different things, which is exactly why they complement each other so well. Using both together, as described in this article, creates a more complete picture. For a detailed comparison of momentum oscillators, the Stocks365 guide on RSI vs Stochastic Oscillator provides valuable context.
What MACD settings work best for the double confirmation strategy?
The standard MACD settings of (12, 26, 9) are recommended for most traders and most timeframes. These settings were developed specifically for daily stock charts and have stood the test of time. While some traders experiment with faster settings like (8, 21, 5) for more responsive signals, this comes at the cost of more false signals. For the double confirmation strategy, the standard settings work best because they generate fewer, higher-quality crossovers that align more cleanly with EMA structure changes.