
Why Most Traders Use MACD Wrong (And How to Fix It)
The Moving Average Convergence Divergence indicator is one of the most powerful tools in a trader's arsenal — yet it's also one of the most consistently misused. Walk into any trading forum in 2026 and you'll find traders blaming MACD for bad calls that were actually the result of fundamental misunderstandings about how the indicator works.
The truth is hard to hear: MACD mistakes aren't the indicator's fault — they're yours. But that's actually great news, because mistakes you make are mistakes you can fix.
In this guide, we'll walk through the 10 most expensive MACD mistakes traders make, exactly why they cause losses, and how to correct each one with a disciplined, rules-based approach. Whether you're trading equities, crypto, or forex, these lessons apply directly to your bottom line.
Mistake #1: Treating MACD Crossovers as Standalone Buy/Sell Signals
This is the single most common — and most expensive — MACD mistake. A trader sees the MACD line cross above the signal line, immediately buys, and watches the trade reverse within hours.
MACD crossovers are lagging signals by design. The indicator is built on exponential moving averages, meaning it responds to price movement that has already happened. Using crossovers in isolation, without price action context or trend confirmation, is like reading yesterday's newspaper and making decisions about today's market.
The Fix
- Only act on MACD crossovers when they align with the prevailing trend on a higher timeframe
- Require price to be above or below a key moving average (such as the 200-day EMA) before taking crossover signals
- Combine with volume confirmation — strong crossovers should coincide with above-average volume
- Consider pairing MACD with RSI for momentum confirmation. Our guide on how to use RSI in trading provides an excellent framework for multi-indicator analysis
Mistake #2: Ignoring the Histogram Completely
Ask ten traders what the MACD histogram represents, and at least seven will give you a vague or incorrect answer. The histogram — the bar chart portion of MACD — is arguably more useful than the crossover lines themselves, and most traders barely glance at it.
The histogram measures the distance between the MACD line and its signal line. When bars are growing taller, momentum is accelerating. When they're shrinking, momentum is fading — even if price continues moving in the same direction. Diverging histogram bars often warn of reversals days before they show up in price.
The Fix
Train yourself to read histogram momentum shifts proactively:
- Expanding bars in the same direction as your trade: hold or add to position
- Contracting bars against trend momentum: consider tightening stops
- Histogram divergence (price makes new high, histogram doesn't): high-probability reversal warning
Mistake #3: Using Default Settings for Every Market and Timeframe
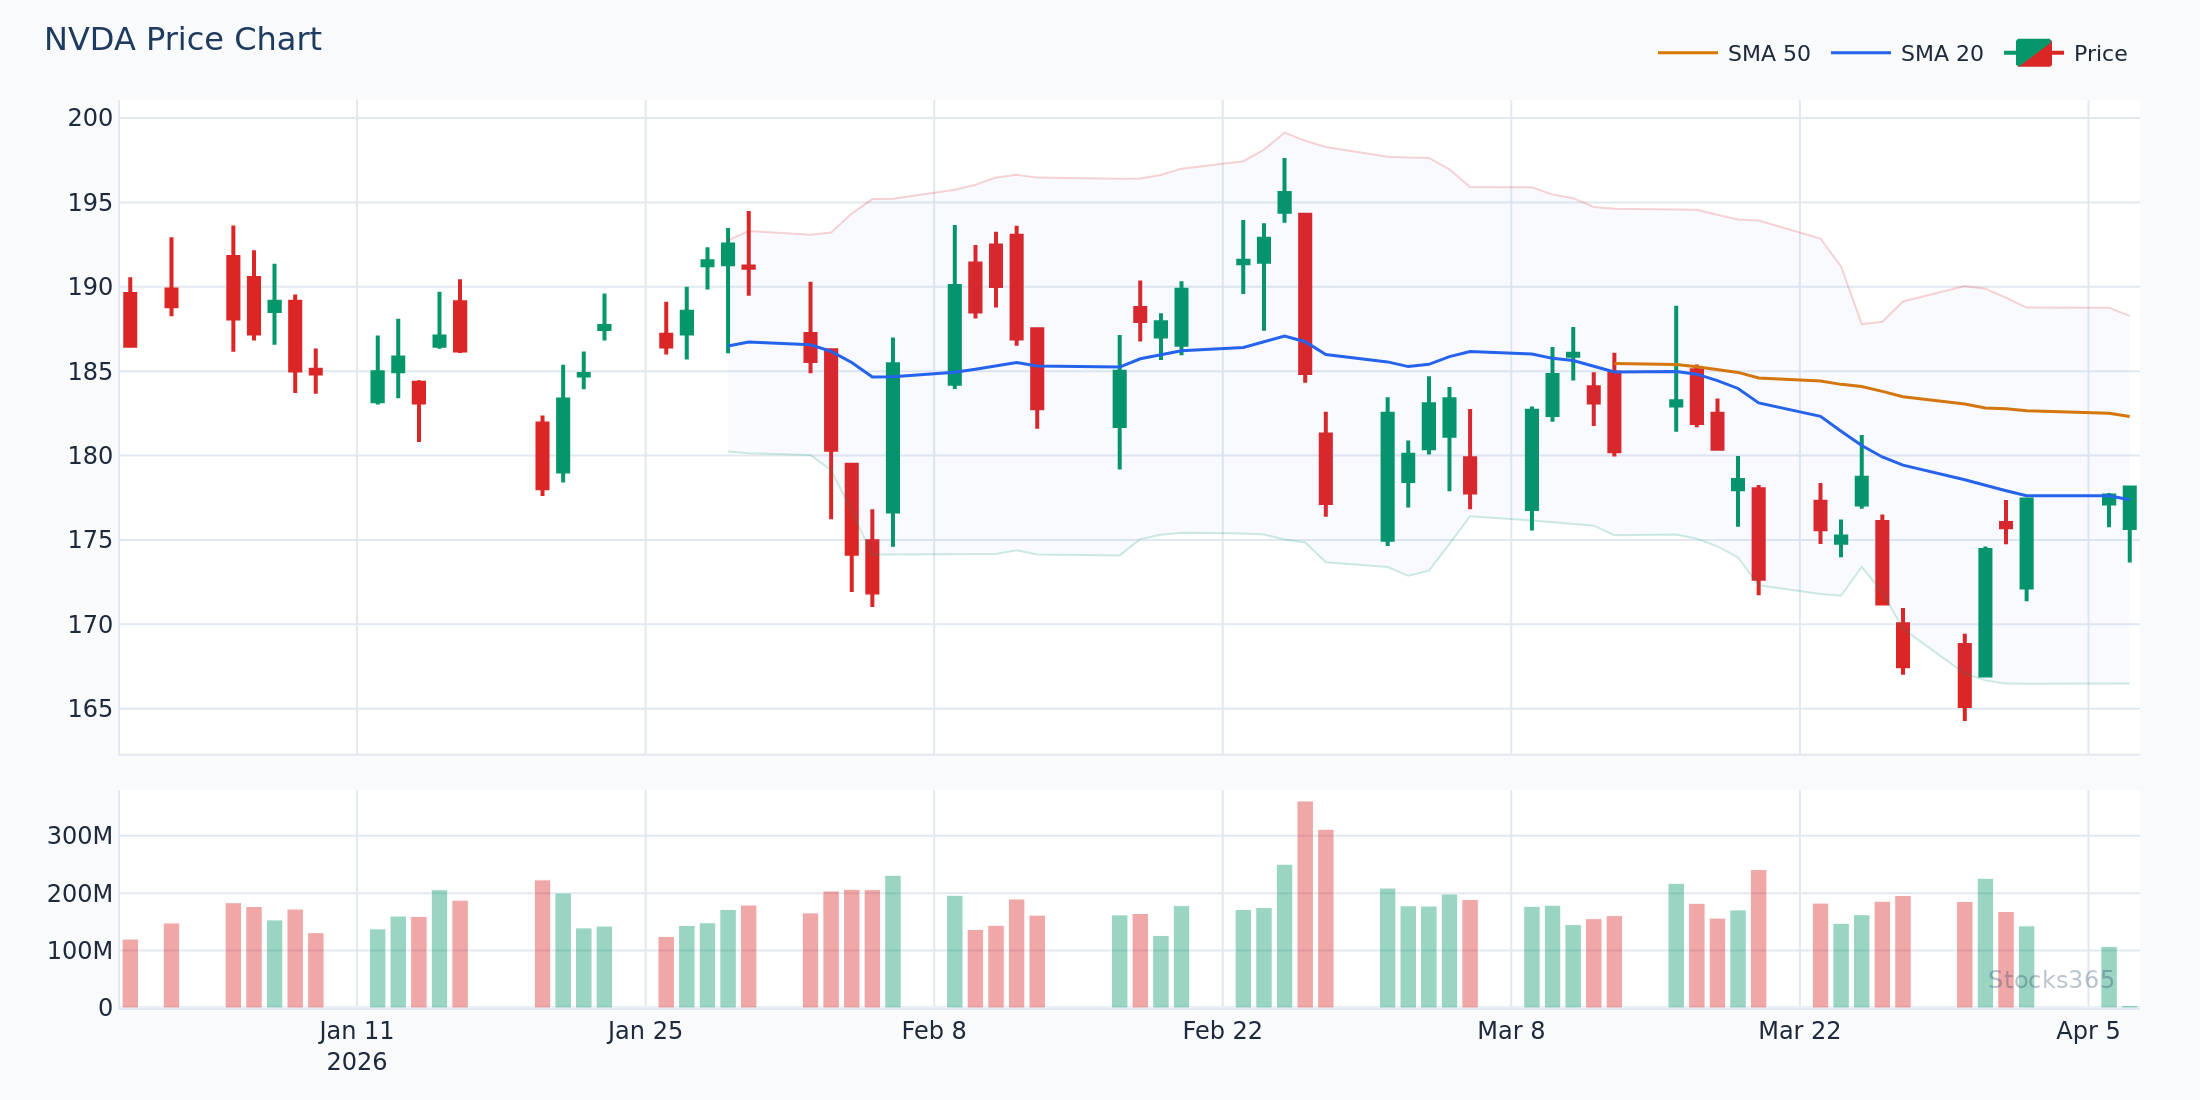
The default MACD settings (12, 26, 9) were developed decades ago for end-of-day stock analysis. In 2026, traders are operating across dozens of asset classes, multiple timeframes, and vastly different volatility environments. Using the same settings for scalping NVDA on a 5-minute chart as you would for swing trading AMZN on a daily chart is a fundamental MACD mistake.
Faster-moving markets and shorter timeframes require more responsive settings. Slower, trending markets benefit from smoother, less reactive parameters.
Recommended MACD Settings by Strategy Type
- Scalping (1-5 min): 3, 10, 16 — more responsive to rapid price changes
- Day trading (15-60 min): 5, 13, 8 — balances speed with noise reduction
- Swing trading (daily): 12, 26, 9 — the standard, works well for multi-day holds
- Position trading (weekly): 19, 39, 9 — smoother signals for longer-term trends
The same principle applies to RSI settings — if you're interested in optimizing indicator parameters, our deep dive on RSI settings for different strategies covers the methodology in detail.
Mistake #4: Misreading MACD Divergence
MACD divergence is one of the most powerful signals in technical analysis — and one of the most misunderstood. Traders either ignore divergence entirely or act on it prematurely, getting stopped out before the actual reversal materializes.
Bullish divergence occurs when price makes a lower low but MACD makes a higher low — suggesting downward momentum is weakening. Bearish divergence occurs when price makes a higher high but MACD makes a lower high — a warning that the rally is losing steam.
Common Divergence Errors
- Acting too early: Divergence is a warning, not an immediate signal. Wait for confirmation via price action or a MACD crossover
- Ignoring hidden divergence: Hidden bullish divergence (higher low in price, lower low in MACD during an uptrend) signals trend continuation — not reversal. Many traders mistake it for a bearish signal. This concept parallels hidden RSI divergence, which is equally misunderstood
- Single timeframe analysis: Divergence is far more reliable when confirmed across multiple timeframes
For a thorough understanding of divergence mechanics, our article on RSI divergence explained provides a framework that translates directly to MACD analysis.
Mistake #5: Fighting the Trend With MACD Counter-Signals
MACD is a trend-following momentum indicator. Using it to fade strong trends — taking bearish signals in roaring bull markets or bullish signals in crashing bear markets — is fighting the tape with a tool that was never designed for counter-trend trading.
Consider a practical example: Suppose NVDA is in a powerful uptrend, making consistent higher highs and higher lows. MACD dips below the signal line briefly during a pullback. Inexperienced traders short this signal. Experienced traders recognize it as a pullback entry opportunity in the direction of the primary trend.
The Fix
Before acting on any MACD signal, answer three questions:
- What is the trend on the next higher timeframe?
- Is this MACD signal with or against that trend?
- Do I have a confluence of signals supporting this trade direction?
Only take MACD signals that align with the higher-timeframe trend. Countertrend trades require additional confirmation and tighter risk management.
Mistake #6: Ignoring Market Context and Volatility Regimes
MACD performs very differently in trending markets versus choppy, range-bound environments. In sideways markets, the indicator generates frequent crossovers that look like trading signals but are actually just noise. This creates a frustrating pattern of whipsaw losses that erodes both capital and confidence.
In 2026's market environment — characterized by periodic high-volatility events and algorithmic-driven price action — this mistake is more costly than ever.
How to Identify When MACD Signals Are Reliable
- Use Average True Range (ATR) to measure volatility: low ATR in sideways markets signals MACD will underperform
- Check if price is trending using ADX: ADX readings above 25 indicate trend strength where MACD excels
- Look at price structure: clear higher highs/higher lows (or lower highs/lower lows) validate MACD trend signals
- Reduce position size or avoid MACD signals entirely when markets are clearly consolidating
Mistake #7: Neglecting Multiple Timeframe Analysis
One of the most reliable ways to filter out false MACD signals is multi-timeframe analysis — yet the majority of retail traders look at a single timeframe and wonder why their signals fail so often.
The principle is simple: higher timeframes set the trend direction; lower timeframes provide entry timing. A bullish MACD crossover on a 15-minute chart means very little if the daily chart shows MACD deeply in bearish territory with declining momentum.
A Practical Multi-Timeframe MACD Framework
- Weekly chart: Determine the macro trend direction. Only trade in alignment
- Daily chart: Confirm MACD momentum supports the weekly trend. Look for histogram expansion
- 4-hour chart: Time your entry using MACD crossovers or histogram reversals
- 1-hour chart (optional): Fine-tune entry and set precise stop-loss levels
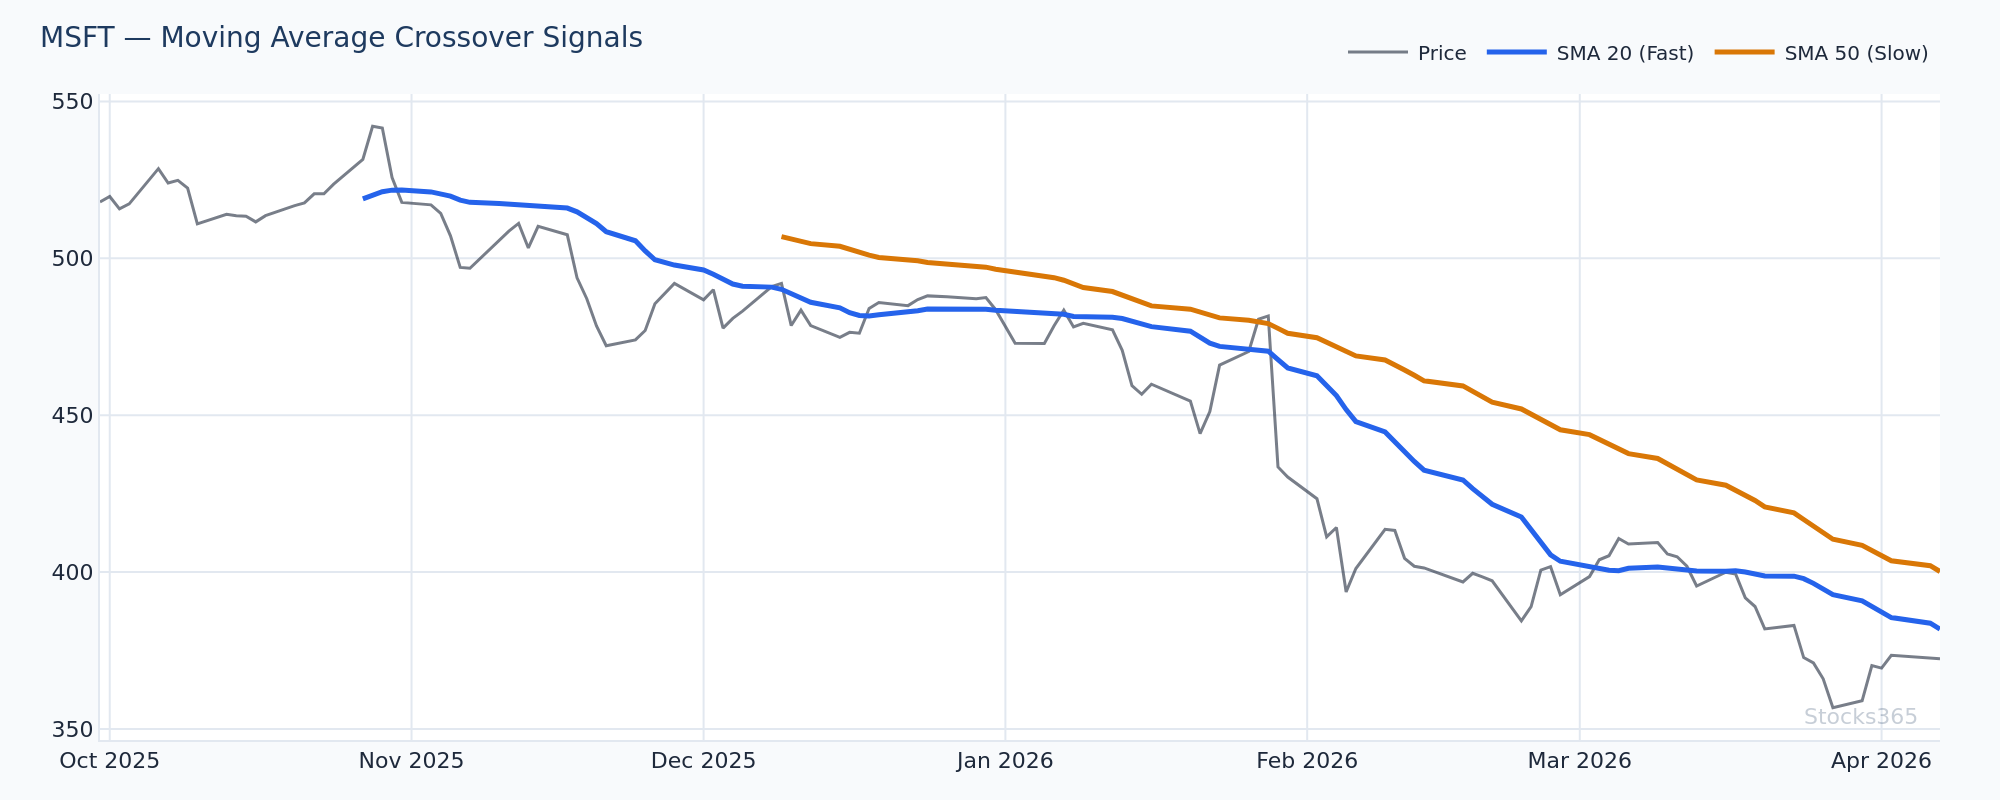
Example: MSFT's daily MACD shows bullish momentum with expanding histogram. Zoom to the 4-hour chart and wait for the MACD line to cross above the signal line after a brief pullback. Enter long with a stop below the recent swing low. This is high-probability trading.
Mistake #8: Using MACD Without Proper Risk Management
Even the most perfectly timed MACD signal can result in a loss. Markets are probabilistic, not deterministic. Traders who use MACD signals without defined stop-losses and position sizing rules are not trading — they're gambling with extra steps.
This mistake frequently manifests as traders entering on a MACD crossover with no clear invalidation point. When the trade moves against them, they hold, hoping for a reversal, while MACD continues deteriorating. Small losses become catastrophic ones.
Risk Management Rules for MACD Trading
- Define your stop before entry: Place stops at logical technical levels (swing highs/lows, key support/resistance), not arbitrary pip distances
- Risk 1-2% of capital per trade maximum: Position size accordingly, not based on emotion
- Use the MACD itself as a dynamic exit signal: If the histogram reverses significantly against your position, that's your indicator telling you momentum has shifted
- Set reward-to-risk targets of at least 1.5:1: MACD signals work often enough that you need wins to outweigh losses meaningfully
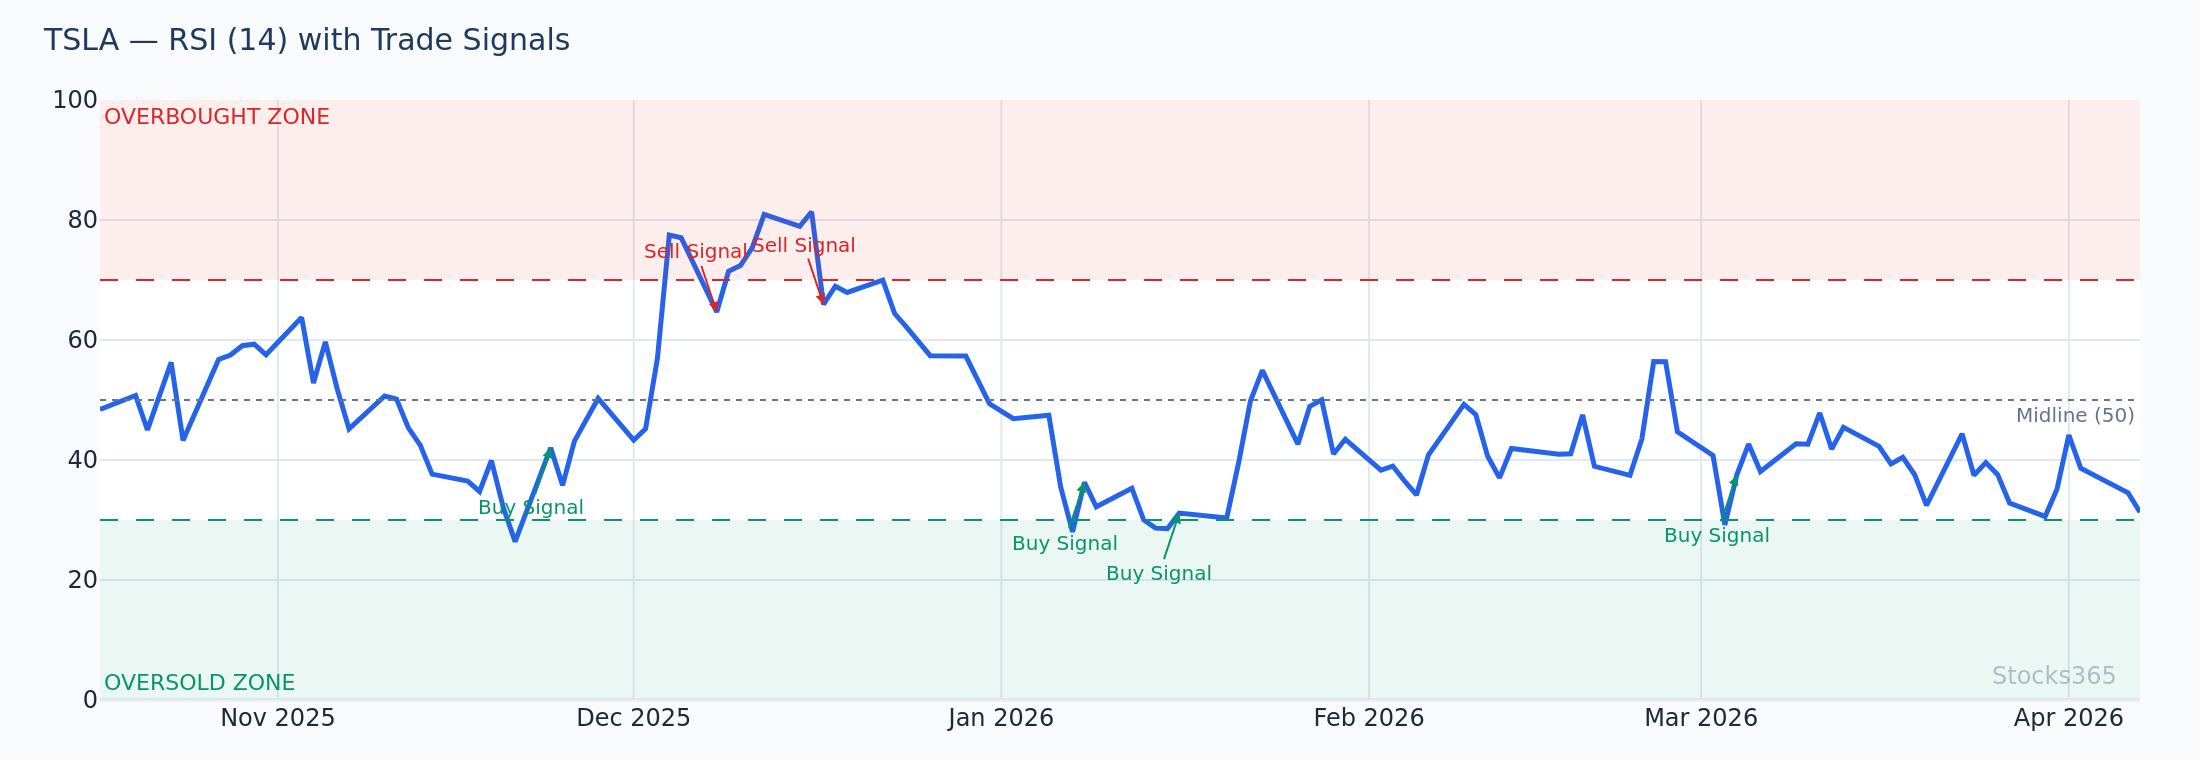
Mistake #9: Confusing MACD With Overbought/Oversold Indicators
MACD does not have defined overbought or oversold levels. Unlike RSI, which oscillates between 0 and 100 with established threshold levels at 70 and 30, MACD is an unbounded indicator. There is no MACD level that inherently means a stock is "too high" or "too low."
Traders who look at MACD trading at what appears to be an "extreme" level and assume mean reversion is imminent are committing a category error. Strong trends can push MACD to seemingly extreme readings and keep it there for extended periods.
If you need overbought/oversold analysis, RSI is the correct tool. Our comprehensive guide on RSI overbought and oversold levels explains exactly how to use those signals effectively. For a broader comparison of momentum tools, see our analysis of RSI vs Stochastic Oscillator to understand which indicator fits which market condition.
What MACD Actually Measures
MACD measures momentum and trend direction — specifically the relationship between two exponential moving averages. When MACD is positive and rising, it signals increasing bullish momentum. When negative and falling, increasing bearish momentum. The absolute level is far less important than the direction and rate of change.
Mistake #10: Over-Relying on MACD Alone
MACD is an exceptional indicator. It is not an oracle. Traders who build entire strategies around a single indicator — any indicator — are structurally vulnerable to market conditions where that tool underperforms.
The most consistently profitable traders in 2026 use MACD as one component of a broader analytical framework that includes price action, volume analysis, support/resistance levels, and complementary indicators. The Stocks365 signals dashboard aggregates multiple technical factors — including our proprietary trust score system — to give traders a probability-weighted view of setups rather than relying on any single indicator's verdict.
Our trust score system evaluates signals across multiple dimensions, weighting MACD signals higher when they occur in high-trend environments with volume confirmation and multi-timeframe alignment, and discounting them when market context is unfavorable. This is precisely the analytical discipline individual traders need to develop.
Building a Complete Trading Framework Around MACD
- Trend filter: 200-day EMA or weekly trend structure
- Momentum confirmation: RSI alignment with MACD direction (see our complete RSI beginner's guide)
- Volume analysis: Confirm signal moves on above-average volume
- Price action: Candlestick patterns and key level breaks
- Risk management: Position sizing, stop placement, and profit targets defined before entry
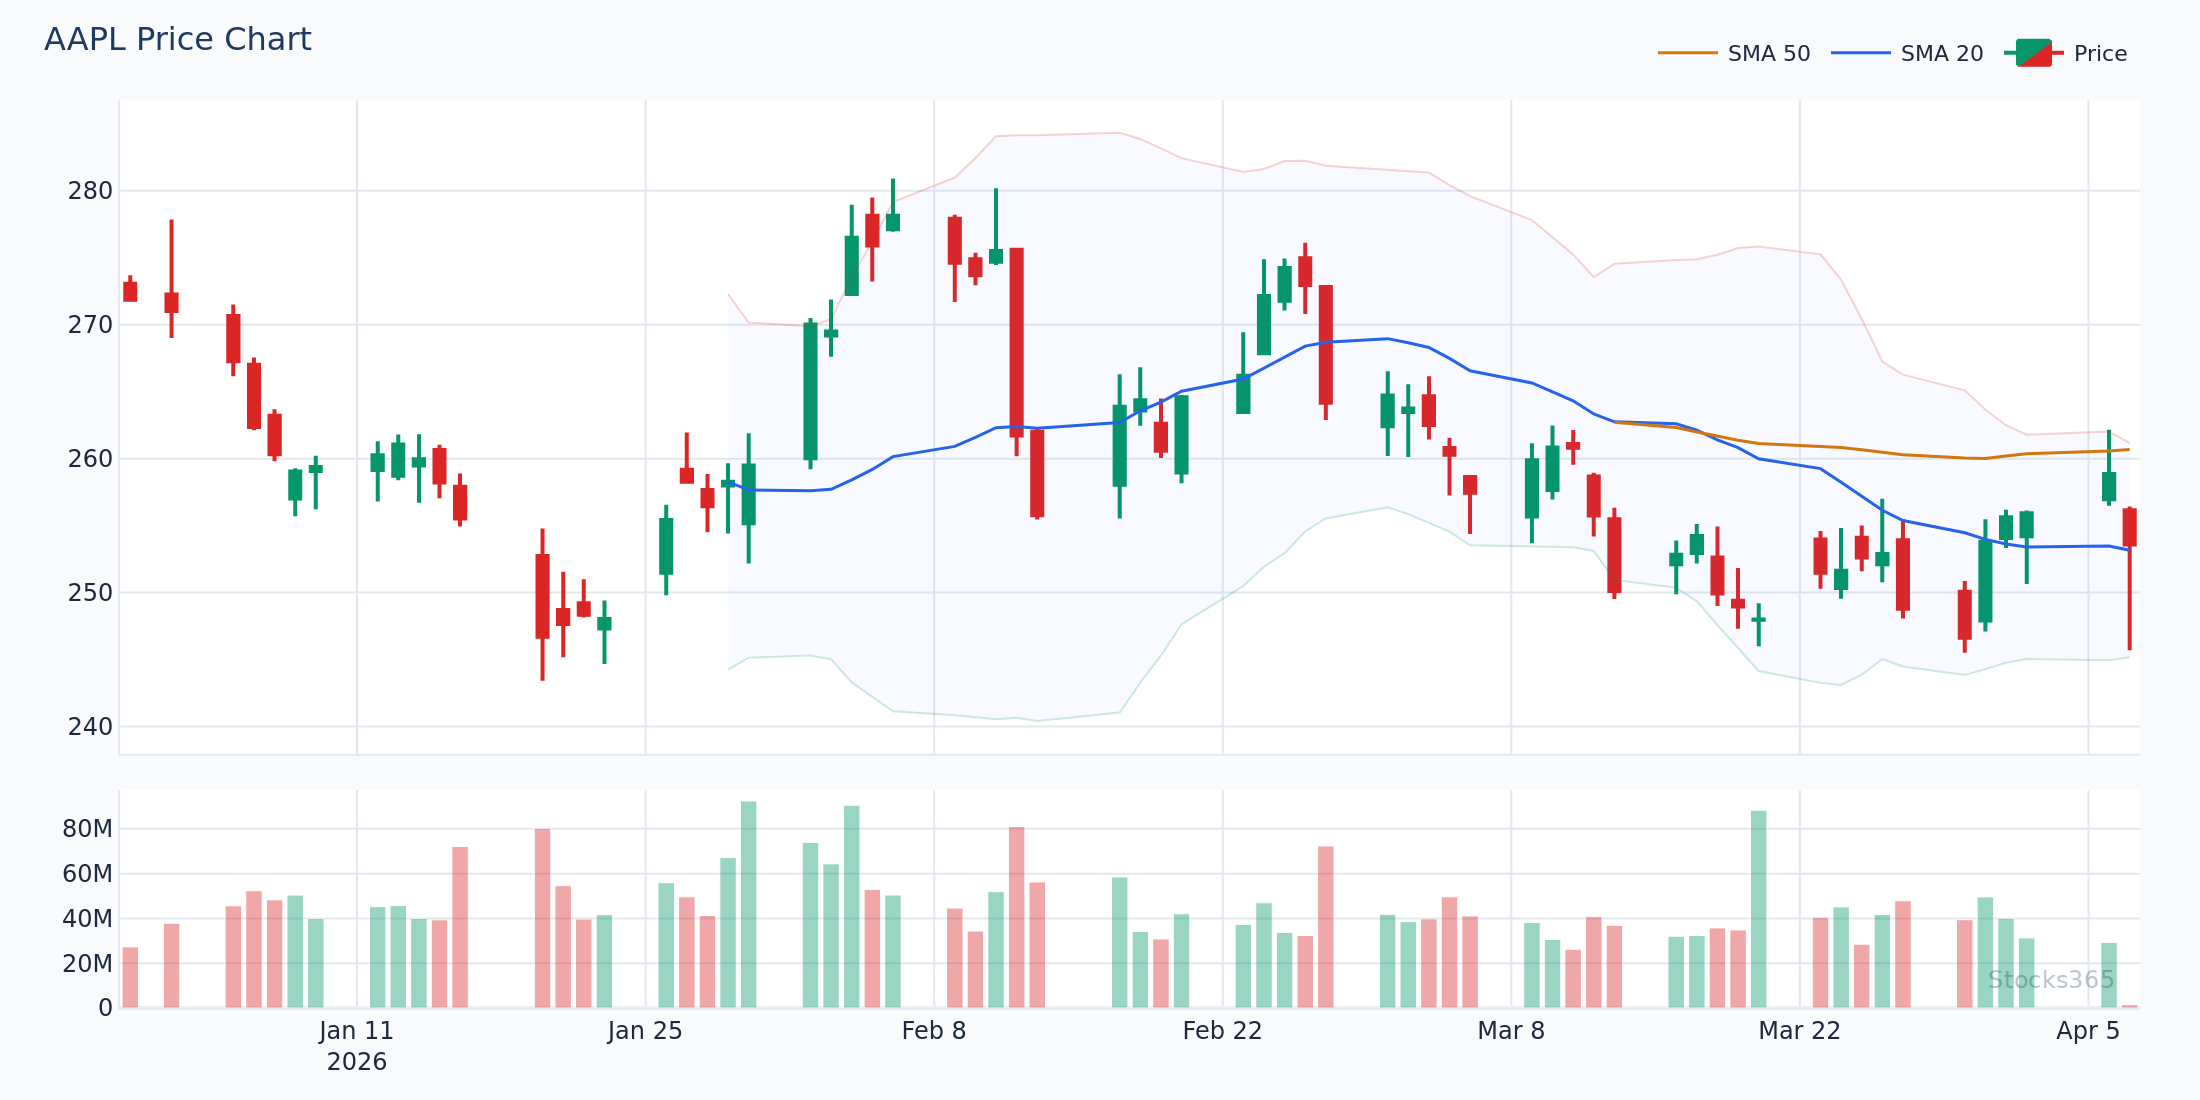
For example, when analyzing a potential trade on AAPL, a complete MACD-based analysis would check: daily MACD histogram direction, RSI positioning relative to 50, volume on recent moves, whether price is above or below the 200-day EMA, and key support/resistance proximity. Only when multiple factors align does the signal warrant meaningful capital commitment.
Key Takeaways: Avoiding Costly MACD Mistakes
- Never use MACD crossovers in isolation — always require trend and volume confirmation
- Read the histogram — momentum divergence often appears in histogram bars before price reverses
- Customize your settings — default 12/26/9 settings are not optimal for every timeframe or market
- Understand divergence properly — both regular and hidden divergence have distinct trading implications
- Trade with the trend — MACD is a trend-following tool, not a counter-trend indicator
- Respect market regimes — MACD underperforms in choppy, range-bound conditions
- Use multiple timeframes — higher timeframes set direction; lower timeframes time entries
- Always define risk first — stops, position sizing, and targets before every trade
- MACD is not RSI — it doesn't measure overbought/oversold conditions
- Build a complete framework — combine MACD with complementary tools for highest-probability setups
Frequently Asked Questions
What is the most common MACD mistake beginner traders make?
The most common MACD mistake is treating crossovers as standalone buy or sell signals without any additional confirmation. MACD is a lagging indicator built on moving averages, which means crossover signals reflect price movement that has already occurred. Acting on crossovers without considering the prevailing trend, volume, or price action context leads to a high rate of false signals and avoidable losses.
Can MACD be used effectively for day trading?
Yes, but the default settings (12, 26, 9) are generally too slow for intraday trading. Day traders typically need faster settings such as 5/13/8 or 3/10/16 depending on the timeframe. The key for day trading with MACD is multi-timeframe confirmation — verifying that MACD momentum on a higher timeframe (such as the 1-hour chart) aligns with the direction of your trade on the shorter timeframe you're using for entries.
How do I avoid false MACD signals in sideways markets?
The best approach is to avoid MACD signals altogether when markets are clearly range-bound. Use ADX to measure trend strength — when ADX is below 20-25, the market lacks sufficient trend for MACD to generate reliable signals. In sideways conditions, oscillators like RSI or Stochastic are better suited for identifying overbought/oversold extremes within the range. Our guide on RSI overbought and oversold levels covers this approach in detail.
Should I combine MACD with RSI for better signals?
Absolutely — MACD and RSI complement each other well because they measure different aspects of price behavior. MACD measures trend momentum and direction through moving average relationships, while RSI measures the speed and magnitude of price changes on a normalized 0-100 scale. When both indicators align — for example, a bullish MACD crossover occurring while RSI recovers from below 40 — signal reliability increases significantly. Learn more in our complete guide to using RSI in trading.
What does MACD divergence mean and how reliable is it?
MACD divergence occurs when the indicator's movement disagrees with price movement. Bearish divergence — price makes a new high but MACD makes a lower high — warns that upward momentum is weakening and a reversal may be approaching. Bullish divergence — price makes a new low but MACD makes a higher low — suggests downward momentum is exhausting. Divergence signals are more reliable when confirmed across multiple timeframes, when they occur near key support or resistance levels, and when volume data supports the signal. Divergence alone is a warning, not a trigger — always wait for additional confirmation before acting.