
MACD vs Bollinger Bands: The Power of Combining Two Elite Indicators
Every serious trader eventually faces the same dilemma: which technical indicator should I trust? The debate around MACD vs Bollinger Bands is one of the most common in trading forums, strategy rooms, and professional desks alike. But here's the truth that separates average traders from consistently profitable ones — you don't have to choose.
MACD (Moving Average Convergence Divergence) and Bollinger Bands are not rivals. They are complementary tools that, when used together, paint a far more complete picture of market behavior than either can alone. In this guide, we'll break down exactly how each indicator works, where they differ, and — most importantly — how to combine them into a unified, high-conviction trading strategy.
Key Insight: MACD measures momentum and trend direction. Bollinger Bands measure volatility and price extremes. Together, they answer both when and where to enter a trade.
Understanding MACD: The Momentum Engine
The Moving Average Convergence Divergence (MACD) was developed by Gerald Appel in the late 1970s and remains one of the most widely used momentum indicators in technical analysis. At its core, MACD tracks the relationship between two exponential moving averages (EMAs) of price.
MACD Components Explained
- MACD Line: The difference between the 12-period EMA and the 26-period EMA
- Signal Line: A 9-period EMA of the MACD line itself
- Histogram: The visual representation of the gap between the MACD line and signal line
When the MACD line crosses above the signal line, it generates a bullish crossover — a classic buy signal. When it crosses below, that's a bearish crossover. The histogram expands when momentum is accelerating and contracts when momentum is fading, giving traders early warning of potential reversals.
One critical advantage of MACD is its ability to reveal divergence — when price makes a new high but MACD fails to follow, that hidden weakness is often a precursor to a reversal. If you want to explore divergence signals in depth, our article on RSI Divergence Explained: Master Bullish & Bearish Signals covers the same concept applied to RSI, which pairs beautifully with MACD analysis.
MACD Strengths and Limitations
Strengths:
- Excellent at identifying trend direction and momentum shifts
- Works well in trending markets (strong bullish or bearish moves)
- Histogram provides early divergence clues before price confirms
- Flexible across multiple timeframes from 5-minute intraday to weekly swing charts
Limitations:
- Lagging indicator — signals can arrive after the move has begun
- Prone to false signals in sideways, choppy markets
- Does not indicate how far price may move — no volatility context
That last limitation — the lack of volatility context — is precisely where Bollinger Bands step in.
Understanding Bollinger Bands: The Volatility Framework
Developed by John Bollinger in the 1980s, Bollinger Bands consist of three lines plotted around price: a middle band (typically a 20-period simple moving average), an upper band (middle band + 2 standard deviations), and a lower band (middle band − 2 standard deviations).
The bands expand during high-volatility periods and contract during low-volatility periods. This dynamic nature is what makes Bollinger Bands uniquely powerful — they adapt to market conditions in real time.
Key Bollinger Bands Signals
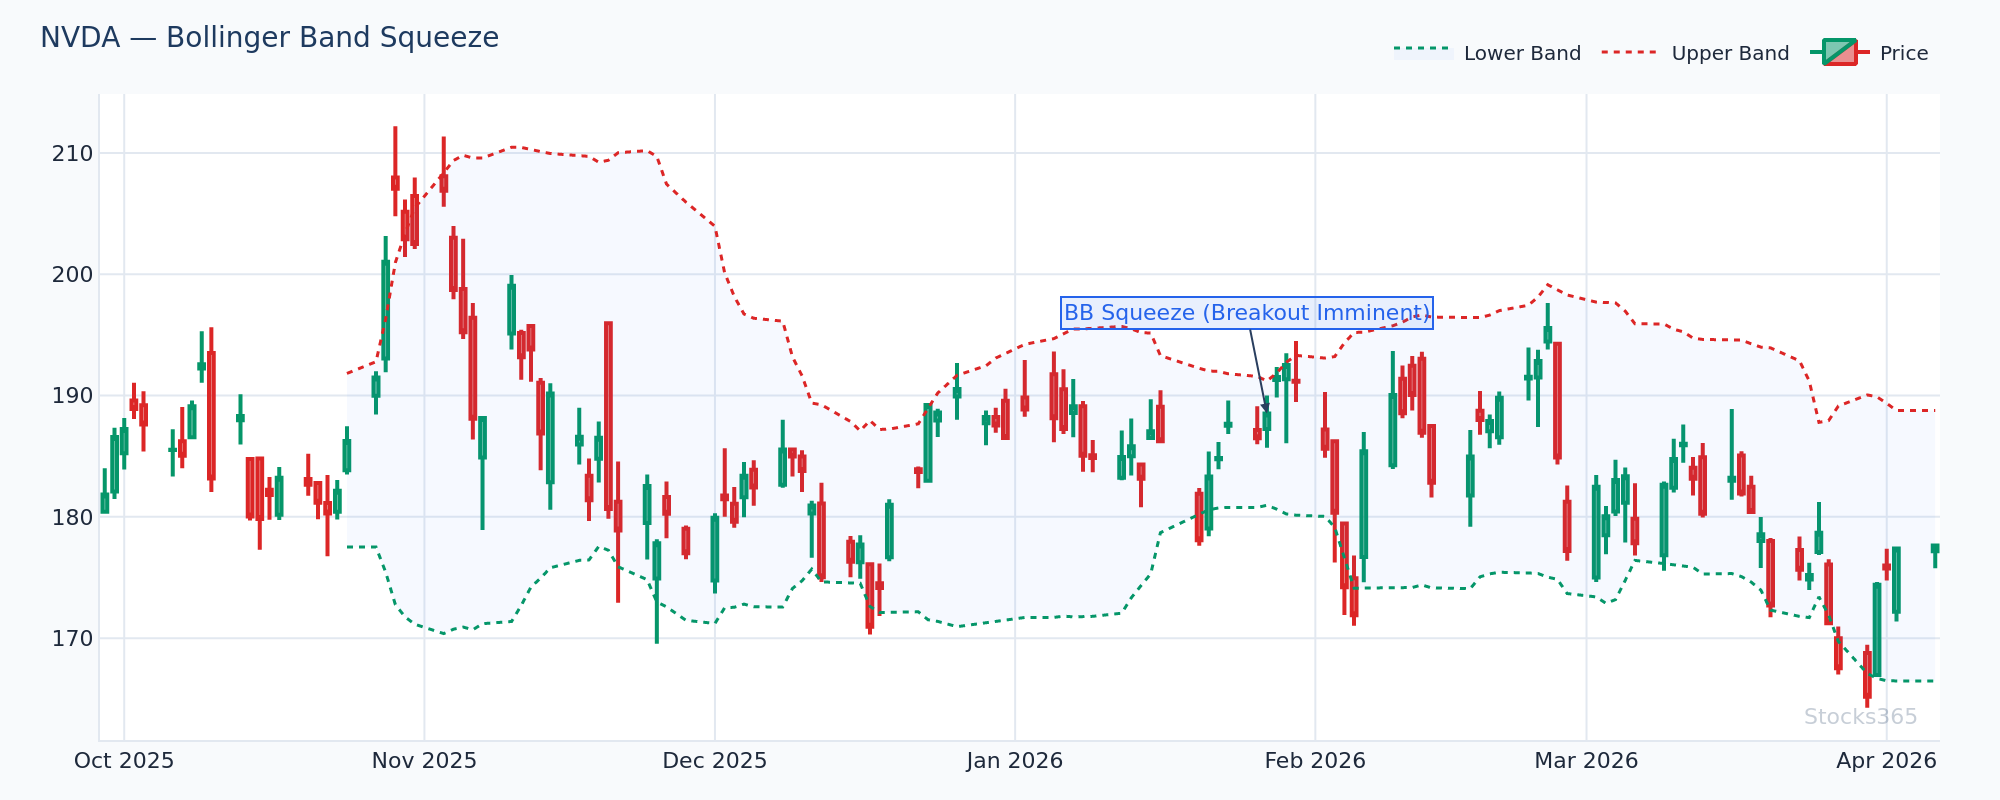
- Band Squeeze: When the bands narrow to historic tightness, a major price move is imminent — though direction is not yet confirmed
- Band Walk: In a strong trend, price can "walk" along the upper or lower band, signaling sustained momentum
- Mean Reversion: Price touching the upper band may revert to the middle SMA, and vice versa in ranging markets
- Band Breakout: A close outside the bands with high volume often signals the start of a new trend leg
Bollinger Bands Strengths and Limitations
Strengths:
- Dynamically adjusts to market volatility — always contextually relevant
- Clearly shows price extremes and potential mean-reversion levels
- The squeeze is one of the most reliable pre-breakout setups in technical analysis
- Visual and intuitive — easy to interpret at a glance
Limitations:
- Does not indicate trend direction — a squeeze can break either way
- In strong trends, price can remain at extreme band levels for extended periods
- Requires a directional confirmation signal to be actionable
Notice the pattern? Bollinger Bands reveal volatility and price extremes but lack directional conviction. MACD provides directional momentum but lacks volatility context. They are, by design, two halves of a complete analytical framework.
MACD vs Bollinger Bands: A Direct Comparison
Before diving into combination strategies, let's formalize the key differences between MACD vs Bollinger Bands:
- Type: MACD is a momentum/trend oscillator; Bollinger Bands are a volatility envelope indicator
- Primary Use: MACD identifies the strength and direction of a trend; Bollinger Bands identify volatility cycles and price extremes
- Signal Type: MACD generates crossovers and divergence signals; Bollinger Bands generate squeeze, breakout, and mean-reversion signals
- Market Condition: MACD excels in trending markets; Bollinger Bands work in both trending and ranging markets
- Lagging Factor: Both are technically lagging, but the BB squeeze is a near-leading signal for volatility expansion
The bottom line: these indicators measure fundamentally different market properties. That's exactly why combining them is so effective — you're getting redundancy in interpretation, not redundancy in signal type.
How MACD and Bollinger Bands Complement Each Other
The real magic of MACD and Bollinger Bands together comes from their complementary nature. Here's a practical framework for how to think about each indicator's role in your analysis:
- Bollinger Bands set the stage — they tell you when the market is coiled and ready to move
- MACD pulls the trigger — it tells you which direction that move is likely to go
This two-step process dramatically reduces false signals. A Bollinger Band squeeze alone doesn't tell you to buy or sell. A MACD crossover alone might trigger in a range-bound market with no follow-through. But a MACD bullish crossover immediately following a Bollinger Band squeeze? That's a high-probability, high-conviction trade setup.
Strategy 1: The Squeeze and Trigger Setup
This is the most popular MACD + Bollinger Bands combination strategy:
- Identify a Bollinger Band squeeze — bands narrowing to their tightest range in 20+ periods
- Wait for the MACD histogram to shift direction or for a MACD line crossover above the signal line (for longs)
- Enter the trade on the next candle's open after confirmation
- Set stop loss below the lower Bollinger Band (for longs) or above the upper band (for shorts)
- Target the opposite band or a 2:1 risk-reward minimum
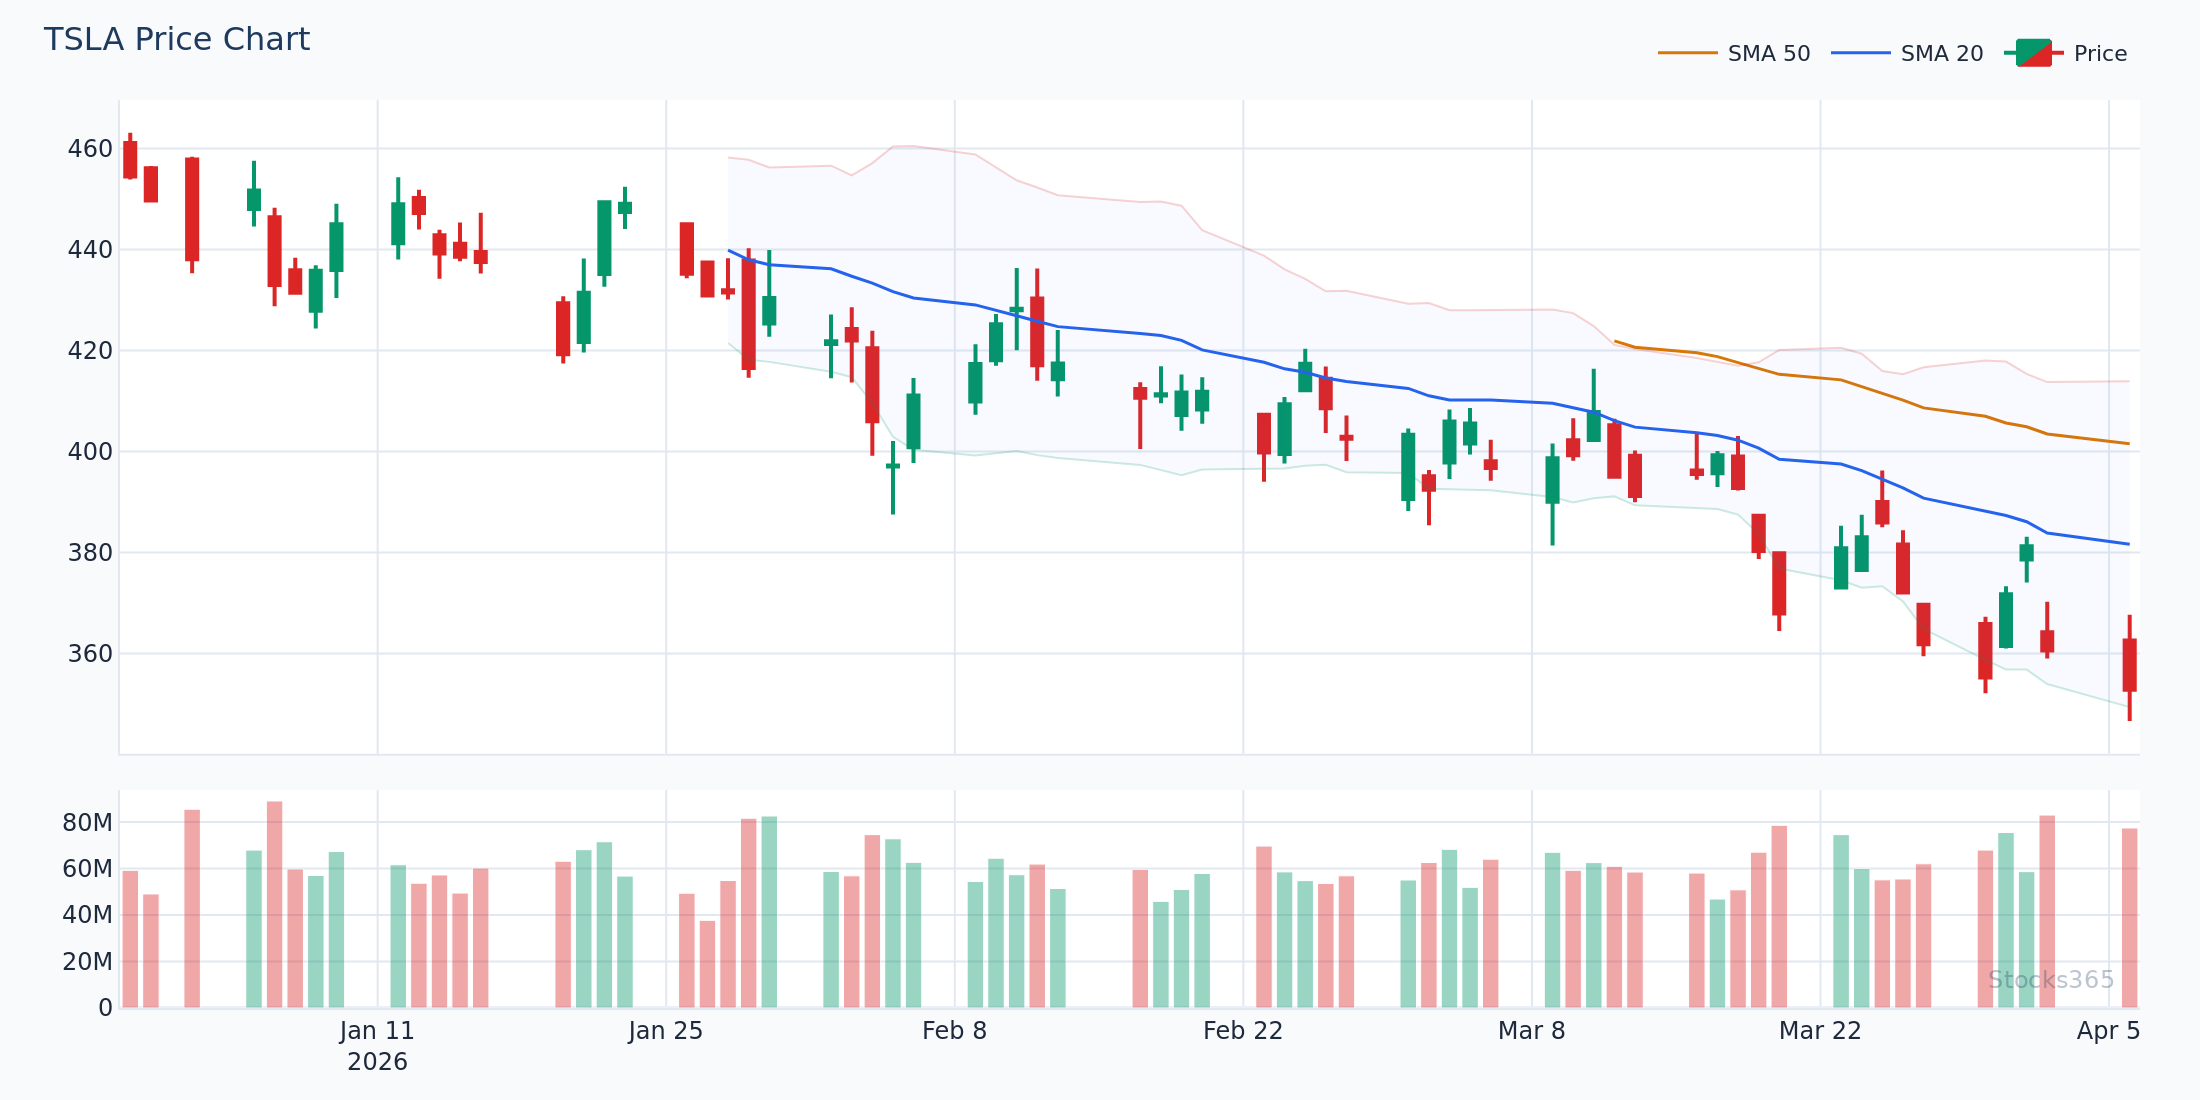
Example — TSLA in March 2026: TSLA consolidated between $285 and $295 for 12 sessions, compressing the Bollinger Bands to their tightest point in 8 weeks. On session 13, the MACD line crossed bullishly above the signal line with the histogram turning positive. The entry at $296 (breakout open) carried a stop at $284 (below lower band). TSLA ran to $318 over the next 6 sessions — a clean 7.4% gain with a defined, narrow risk.
Strategy 2: Band Walk Confirmation with MACD
When a stock is in a strong trend and "walking" the upper Bollinger Band, traders often panic, thinking the move is overextended. MACD saves you from premature exits:
- If price is walking the upper band and MACD histogram is still expanding (or at least positive), the trend is intact — hold or add
- Only when MACD begins to contract (histogram shrinking) while price pulls away from the upper band do you have a legitimate exit signal
This prevents traders from selling into strong trends just because price "looks high." In trending markets, high prices go higher — MACD tells you when the momentum engine is finally running out of fuel.
Strategy 3: Divergence at Band Extremes
One of the highest-probability setups in all of technical analysis occurs when:
- Price makes a new high (or low) and touches or exceeds the Bollinger Band
- But the MACD histogram makes a lower high (on a price high) — classic bearish MACD divergence
This combination of Bollinger Band extreme + MACD divergence is a powerful reversal signal. Price is extended and momentum is fading — that's two independent confirmation systems agreeing on a potential turn.
For a deeper dive into divergence signals, check out our comprehensive guide on Hidden RSI Divergence: The Advanced Signal Most Traders Miss — the same divergence logic applies to MACD and is worth mastering across multiple indicators.
Adding RSI as a Third Confirmation Layer
For traders who want an additional layer of confidence, adding RSI (Relative Strength Index) as a third confirmation tool creates an extremely robust system. The logic:
- Bollinger Bands: Confirms the volatility setup (squeeze or extreme)
- MACD: Confirms the momentum direction
- RSI: Confirms overbought/oversold conditions or adds its own divergence signal
When all three align, the signal quality is exceptional. For example, a Bollinger Band squeeze, MACD bullish crossover, and RSI coming off an oversold level below 30 is a three-way confluence that rarely fails to produce a meaningful move. Explore the full world of RSI trading with our guides on RSI Overbought and Oversold Levels: Master the Signals and How to Use RSI in Trading: The Ultimate Step-by-Step Guide.
Understanding RSI Settings: Master the Best Period for Your Strategy is also essential — the default 14-period RSI may not suit every timeframe or asset class you're trading.
Practical Tips: Optimizing Your MACD and Bollinger Bands Setup
Settings Recommendations
- MACD: Standard (12, 26, 9) works well for most swing and position traders. For scalpers, (5, 13, 5) is popular. For longer-term investors, consider (19, 39, 9)
- Bollinger Bands: Standard (20, 2) for daily charts. Tighten to (10, 1.5) for intraday volatility. Expand to (50, 2.5) for monthly trend analysis
- Timeframe: For best results, confirm signals across two timeframes — find the squeeze on the daily chart and time the MACD entry on the 4-hour chart
Risk Management Rules
- Never risk more than 1-2% of account per trade, regardless of signal strength
- Always define your stop loss before entering — use the Bollinger Band boundaries as natural stop-loss anchors
- Scale into positions if the initial signal is confirmed by additional indicators
- Reduce position size in low-volume environments where band squeezes can be misleading
Using Stocks365 to Implement This Strategy
Identifying these multi-indicator setups manually across hundreds of stocks is time-consuming and error-prone. The Stocks365 signals dashboard streamlines this process by aggregating technical signals — including momentum and volatility indicators — into a unified trust score for each ticker.
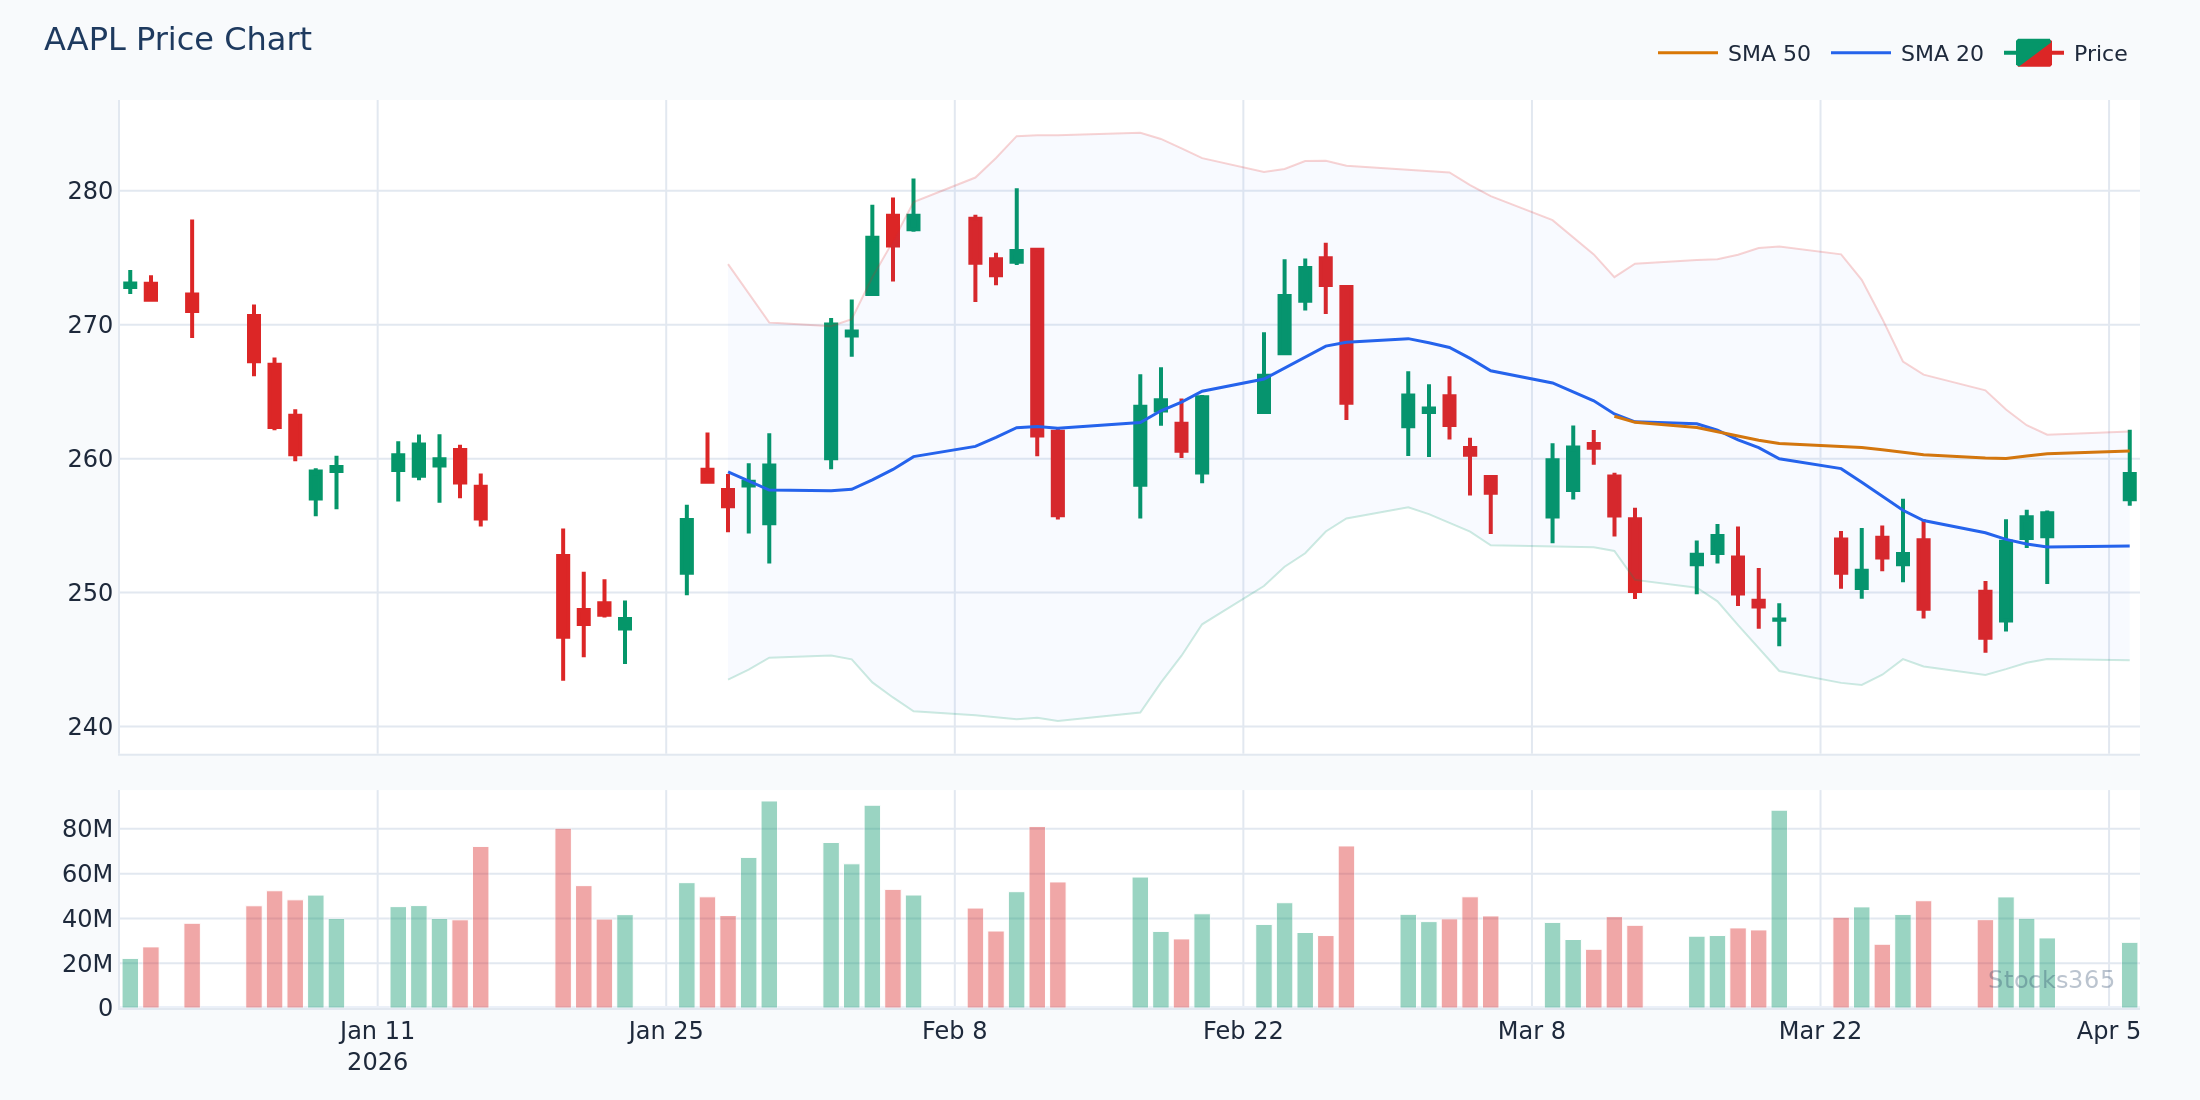
When a stock like AAPL shows a high Stocks365 trust score, it typically means multiple technical signals are converging — including the type of MACD and Bollinger Bands alignment we've discussed throughout this article. Instead of manually scanning charts, you can quickly identify the highest-probability setups and then zoom in to confirm the details before executing.
The platform is particularly useful for filtering squeeze setups — one of the most labor-intensive patterns to find manually across a broad universe of stocks. If you're comparing technical approaches, our article on RSI vs Stochastic Oscillator: The Essential Guide also explores how different momentum tools can be integrated into a platform-supported workflow.
Common Mistakes When Using MACD and Bollinger Bands Together
- Acting on the squeeze alone: The Bollinger Band squeeze tells you a move is coming — not which way. Always wait for MACD directional confirmation before entering
- Ignoring the broader trend: A bearish MACD crossover at the lower Bollinger Band in a strong uptrend is often a pullback, not a reversal. Always contextualize signals within the larger trend
- Overtrading MACD crossovers: In choppy markets, MACD generates frequent crossovers that fail. Use Bollinger Band width as a filter — only trade MACD signals when bands are either squeezing (pre-breakout) or expanding (confirming a trend)
- Ignoring volume: Both MACD and Bollinger Bands are price-based. Volume confirmation significantly increases the reliability of breakout signals
- Using identical settings across all markets: MACD and Bollinger Bands need to be tuned to the volatility profile of each asset. Crypto requires different settings than blue-chip equities
Key Takeaways
📊 MACD vs Bollinger Bands — Summary
- ✅ MACD measures momentum and trend direction via EMA divergence; best in trending markets
- ✅ Bollinger Bands measure volatility cycles and price extremes; effective in all market conditions
- ✅ Together, they create a complete system: Bollinger Bands set the context, MACD provides directional conviction
- ✅ The Squeeze and Trigger Setup is the most reliable combination strategy — wait for band compression, then enter on MACD confirmation
- ✅ Adding RSI as a third layer further filters false signals and increases trade confidence
- ✅ Always define risk using Bollinger Band boundaries as stop-loss anchors
- ✅ The Stocks365 trust score system helps identify when multiple indicators are converging, saving hours of manual chart scanning
Frequently Asked Questions
Can MACD and Bollinger Bands be used together effectively?
Absolutely — in fact, they are one of the most natural indicator pairings in technical analysis. MACD provides momentum direction and trend confirmation, while Bollinger Bands provide volatility context and price extreme identification. Using them together significantly reduces false signals and improves trade timing.
Which is better for day trading — MACD or Bollinger Bands?
For day trading, Bollinger Bands are often preferred as a primary tool because they dynamically reflect intraday volatility. However, MACD remains essential as a momentum filter to confirm the direction of breakouts from band squeezes. Most professional day traders use both simultaneously rather than choosing one.
What is the best MACD setting to use with Bollinger Bands?
The standard MACD settings (12, 26, 9) work well alongside the standard Bollinger Bands settings (20-period SMA, ±2 standard deviations) for daily swing trading. For shorter timeframes, consider adjusting MACD to (5, 13, 5) and Bollinger Bands to (10, 1.5) to increase sensitivity to intraday price action.
How do I avoid false signals when using MACD and Bollinger Bands?
The most effective false signal filter is requiring both indicators to confirm simultaneously. A MACD crossover alone isn't sufficient — wait for it to occur during or immediately after a Bollinger Band squeeze, or when price is at a defined band extreme. Adding RSI as a third confirmation layer further reduces false entries. Always use a stop loss anchored to the Bollinger Band boundaries to limit damage from the signals that don't work out.
Should I add RSI to a MACD and Bollinger Bands strategy?
Yes — RSI is an excellent third-layer indicator for this combination. It adds overbought/oversold context that neither MACD nor Bollinger Bands provide on their own. When all three confirm (e.g., band squeeze + MACD bullish crossover + RSI bouncing from oversold), you have a high-conviction setup with multiple independent confirmation systems aligned. Learn more in our guide on What Is RSI? The Complete Beginner's Guide.