
What Is the MACD Zero Line Cross?
The MACD zero line cross is one of the most reliable momentum signals available to traders. When the MACD line — calculated as the difference between a 12-period and 26-period exponential moving average — crosses above or below the zero line, it signals a meaningful shift in the balance between buyers and sellers. Unlike the more commonly discussed signal line crossover, the zero line cross often carries deeper conviction about trend direction.
Understanding this signal is essential for any trader who wants to move beyond basic indicators and develop a more nuanced, high-probability approach to the market. Whether you trade equities, ETFs, or index futures, the MACD zero line cross can serve as a core component of your technical toolkit.
How the MACD Zero Line Cross Works: The Mechanics
To fully appreciate this signal, it helps to understand the mathematics behind it. The MACD line itself is an expression of momentum — specifically, how fast or slow price is moving relative to its recent history. When the MACD line sits above zero, it means the short-term EMA (12-period) is trading above the long-term EMA (26-period), indicating bullish momentum. When it sits below zero, the opposite is true.
Bullish MACD Zero Line Cross
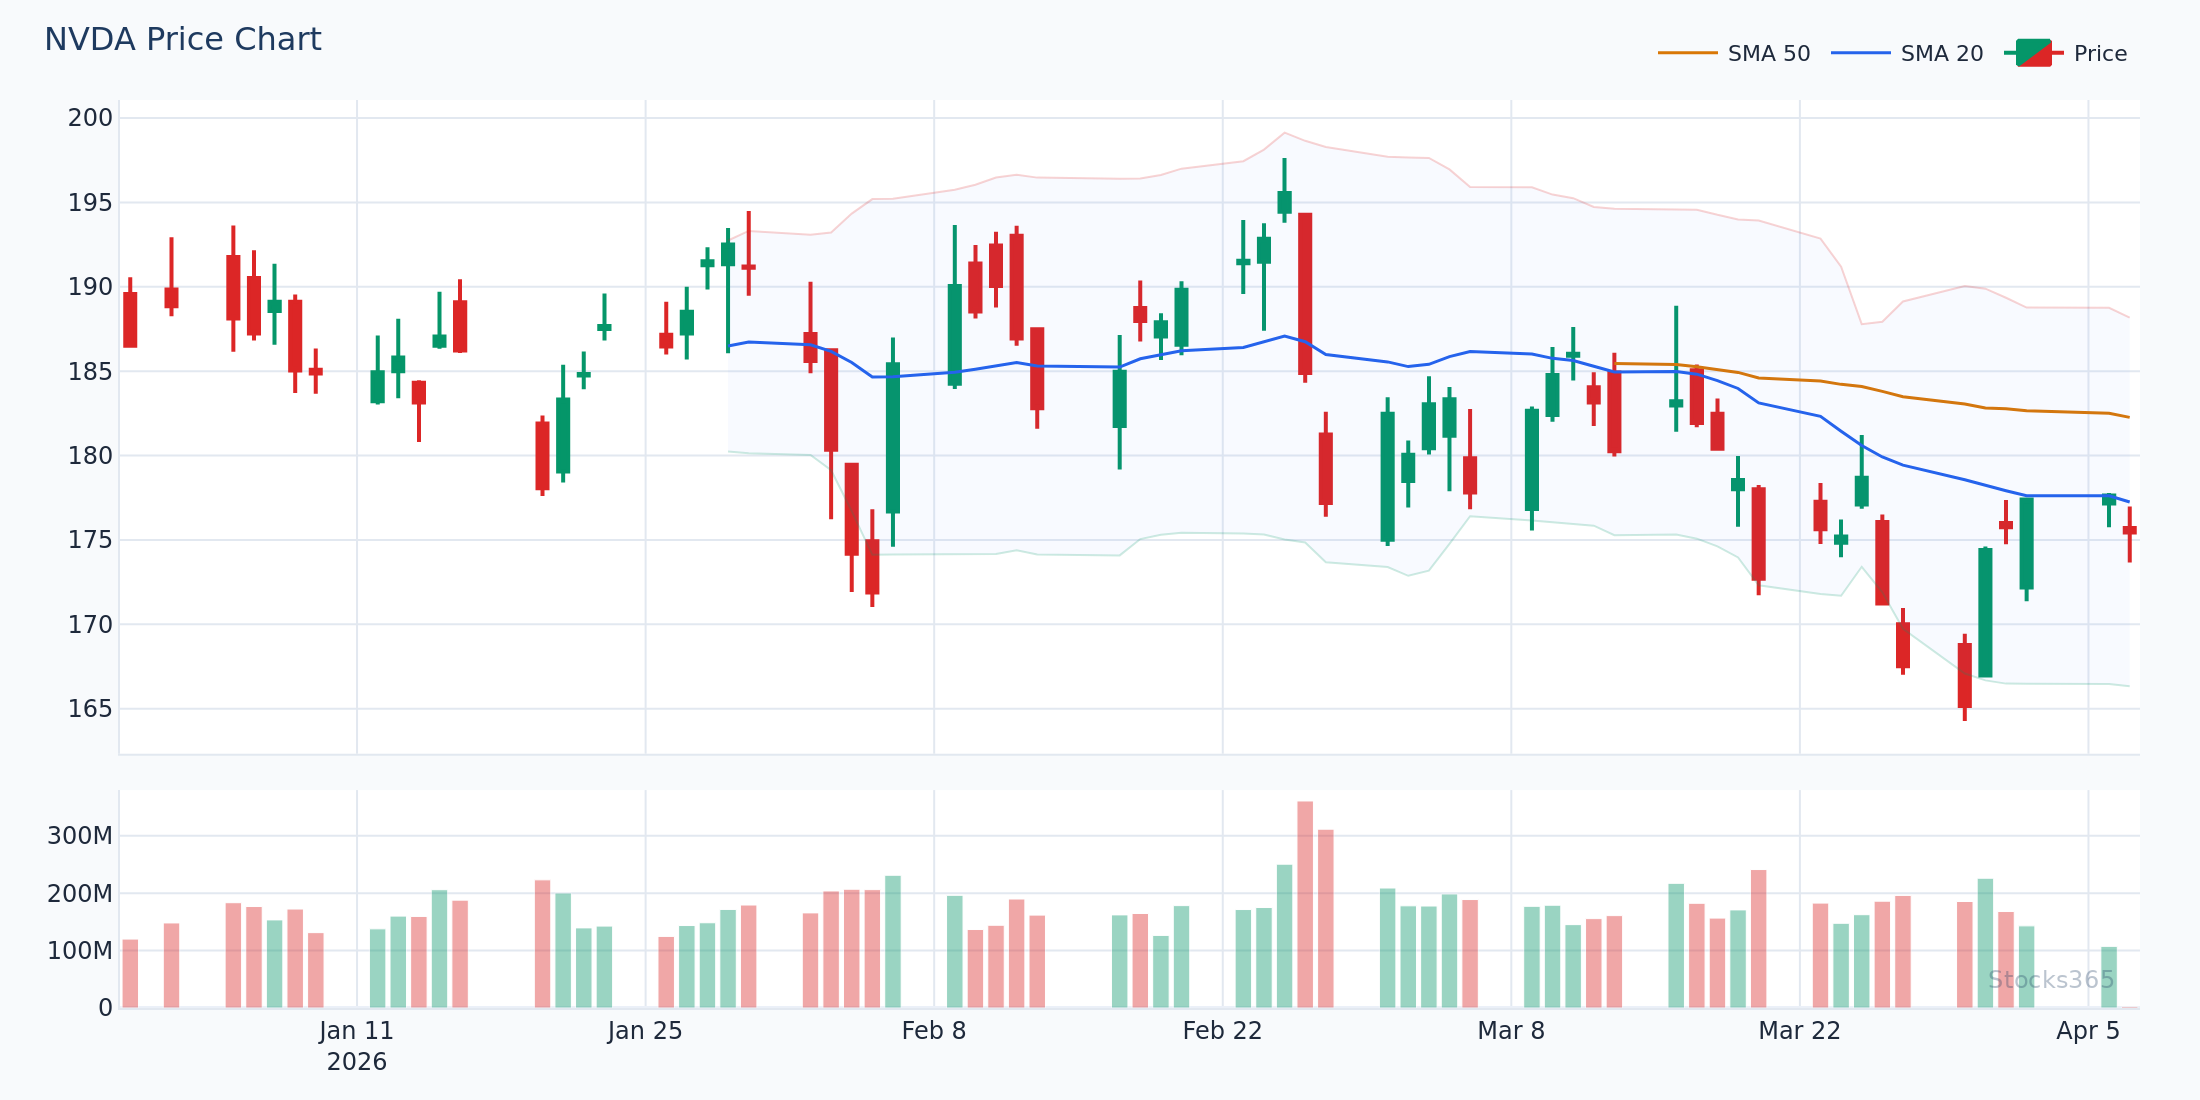
A bullish MACD zero line cross occurs when the MACD line moves from below zero to above it. This is a signal that short-term buying pressure has become strong enough to push the fast EMA above the slow EMA — a structural shift in momentum. For example, imagine NVDA trading around $980 in early 2026. If the MACD line crosses zero from below while price is breaking above a key resistance level at $990, that combination provides strong evidence of an emerging uptrend.
Bearish MACD Zero Line Cross
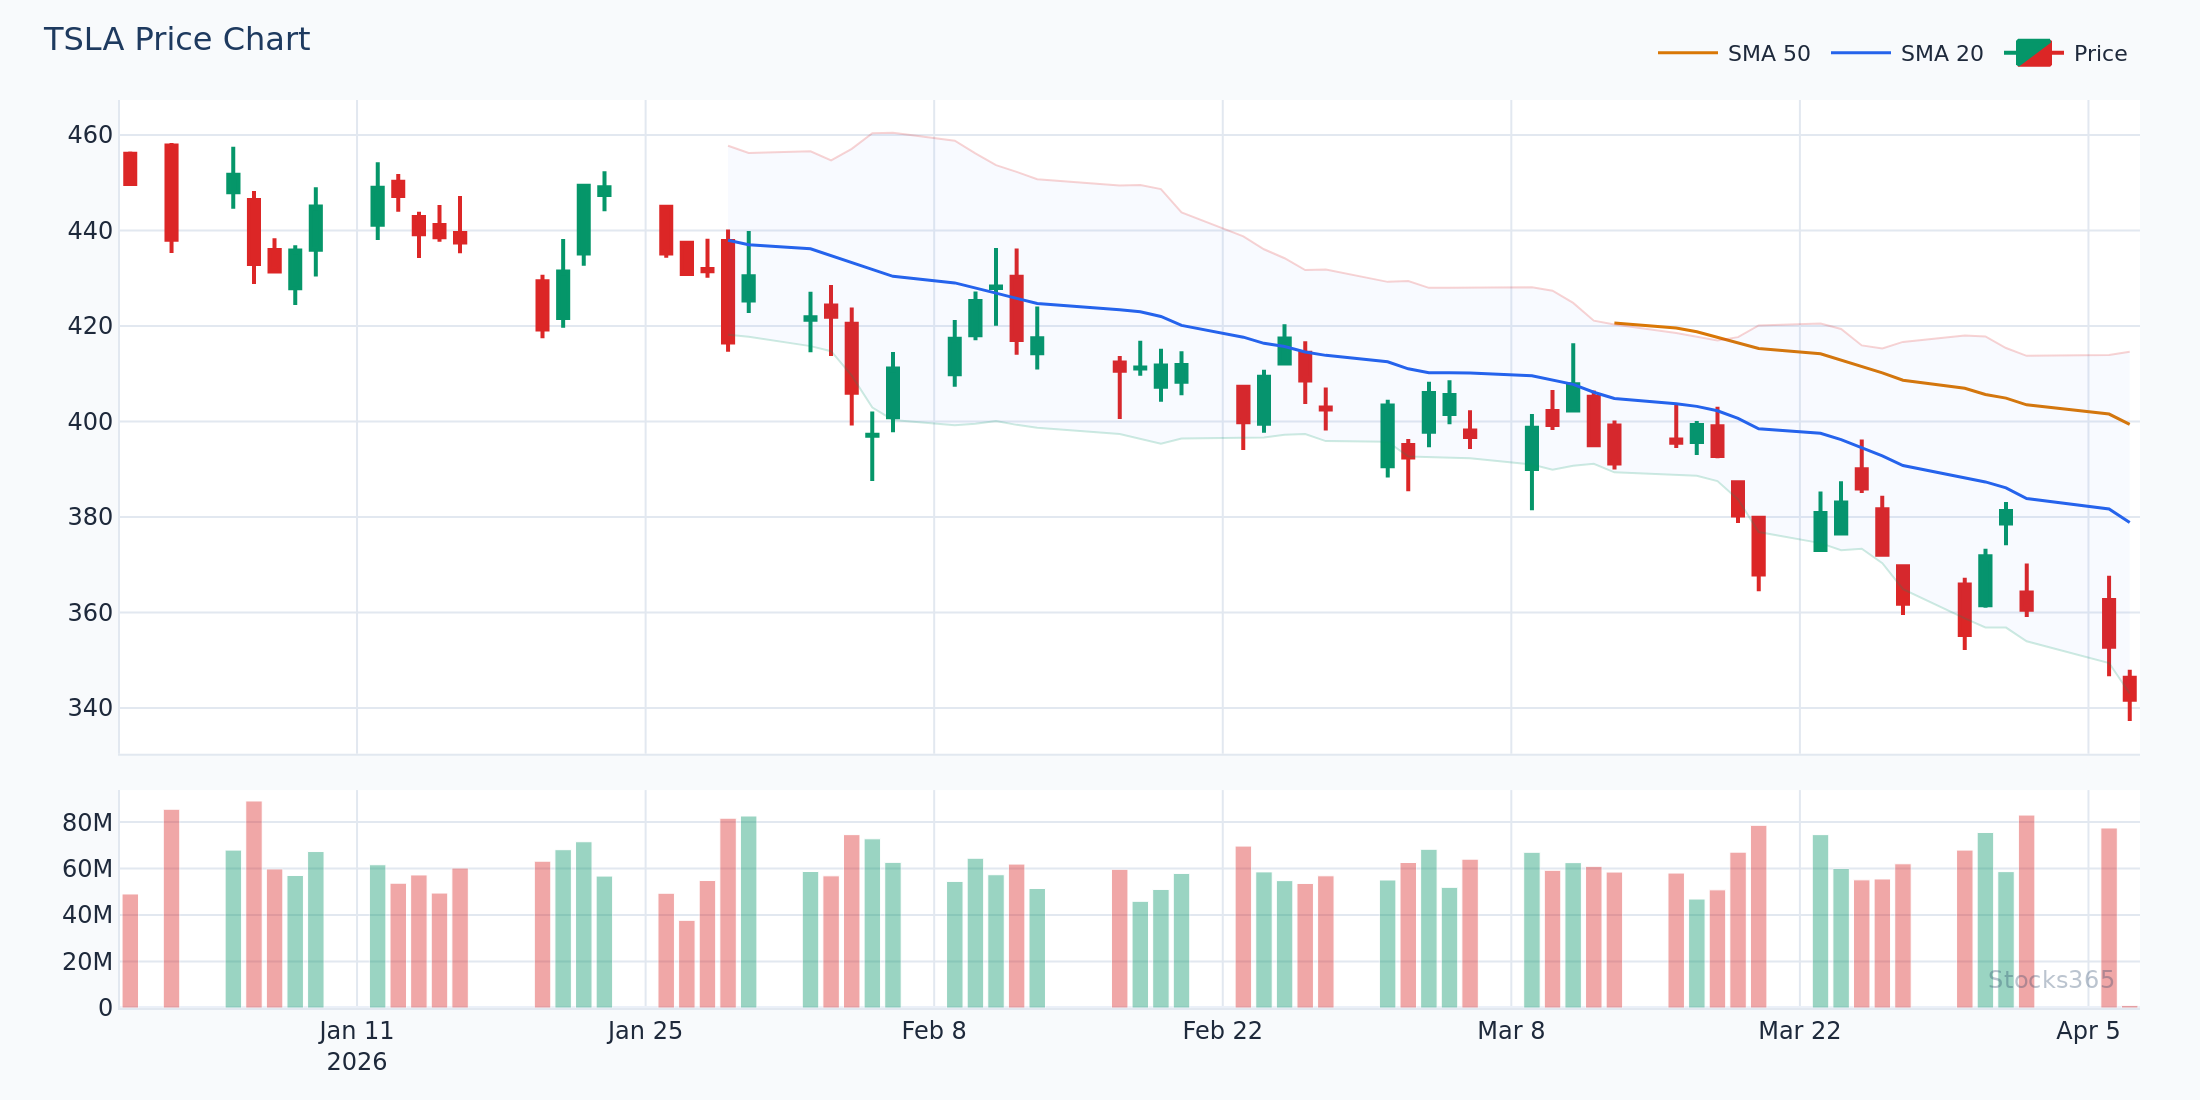
Conversely, a bearish MACD zero line cross happens when the MACD line falls from above zero to below it. This confirms that short-term selling pressure has overtaken buying momentum. Picture TSLA trading at $310 and the MACD line dropping through zero after a failed attempt to reclaim the $325 resistance zone — that's a textbook bearish zero line cross signaling accelerating downside momentum.
Key Insight: The zero line cross does not merely suggest momentum is shifting — it confirms the shift has already occurred. This makes it a lagging but high-conviction signal, ideal for trend-following strategies.
MACD Zero Line Cross vs. Signal Line Crossover: What's the Difference?
Many traders confuse the MACD zero line cross with the signal line crossover. While both are valid signals, they serve different purposes and carry different weights.
- Signal Line Crossover: Occurs when the MACD line crosses the 9-period signal line (EMA of MACD). This is an early-warning signal, often appearing before the zero line cross. It is more sensitive and generates more frequent — but sometimes false — signals.
- Zero Line Cross: Occurs when the MACD line crosses the zero baseline. This is a confirmation signal, slower to appear but more structurally significant. It filters out much of the noise inherent in the signal line crossover.
Think of the signal line crossover as your early alert and the zero line cross as your confirmation. The most powerful trades often occur when both align — the signal line crossover comes first, followed shortly by the zero line cross, all within an established price trend.
How to Identify a High-Quality MACD Zero Line Cross
Not every zero line cross is worth trading. The key is learning to distinguish high-probability setups from noise. Here are the core criteria for a quality signal:
1. Align with the Prevailing Trend
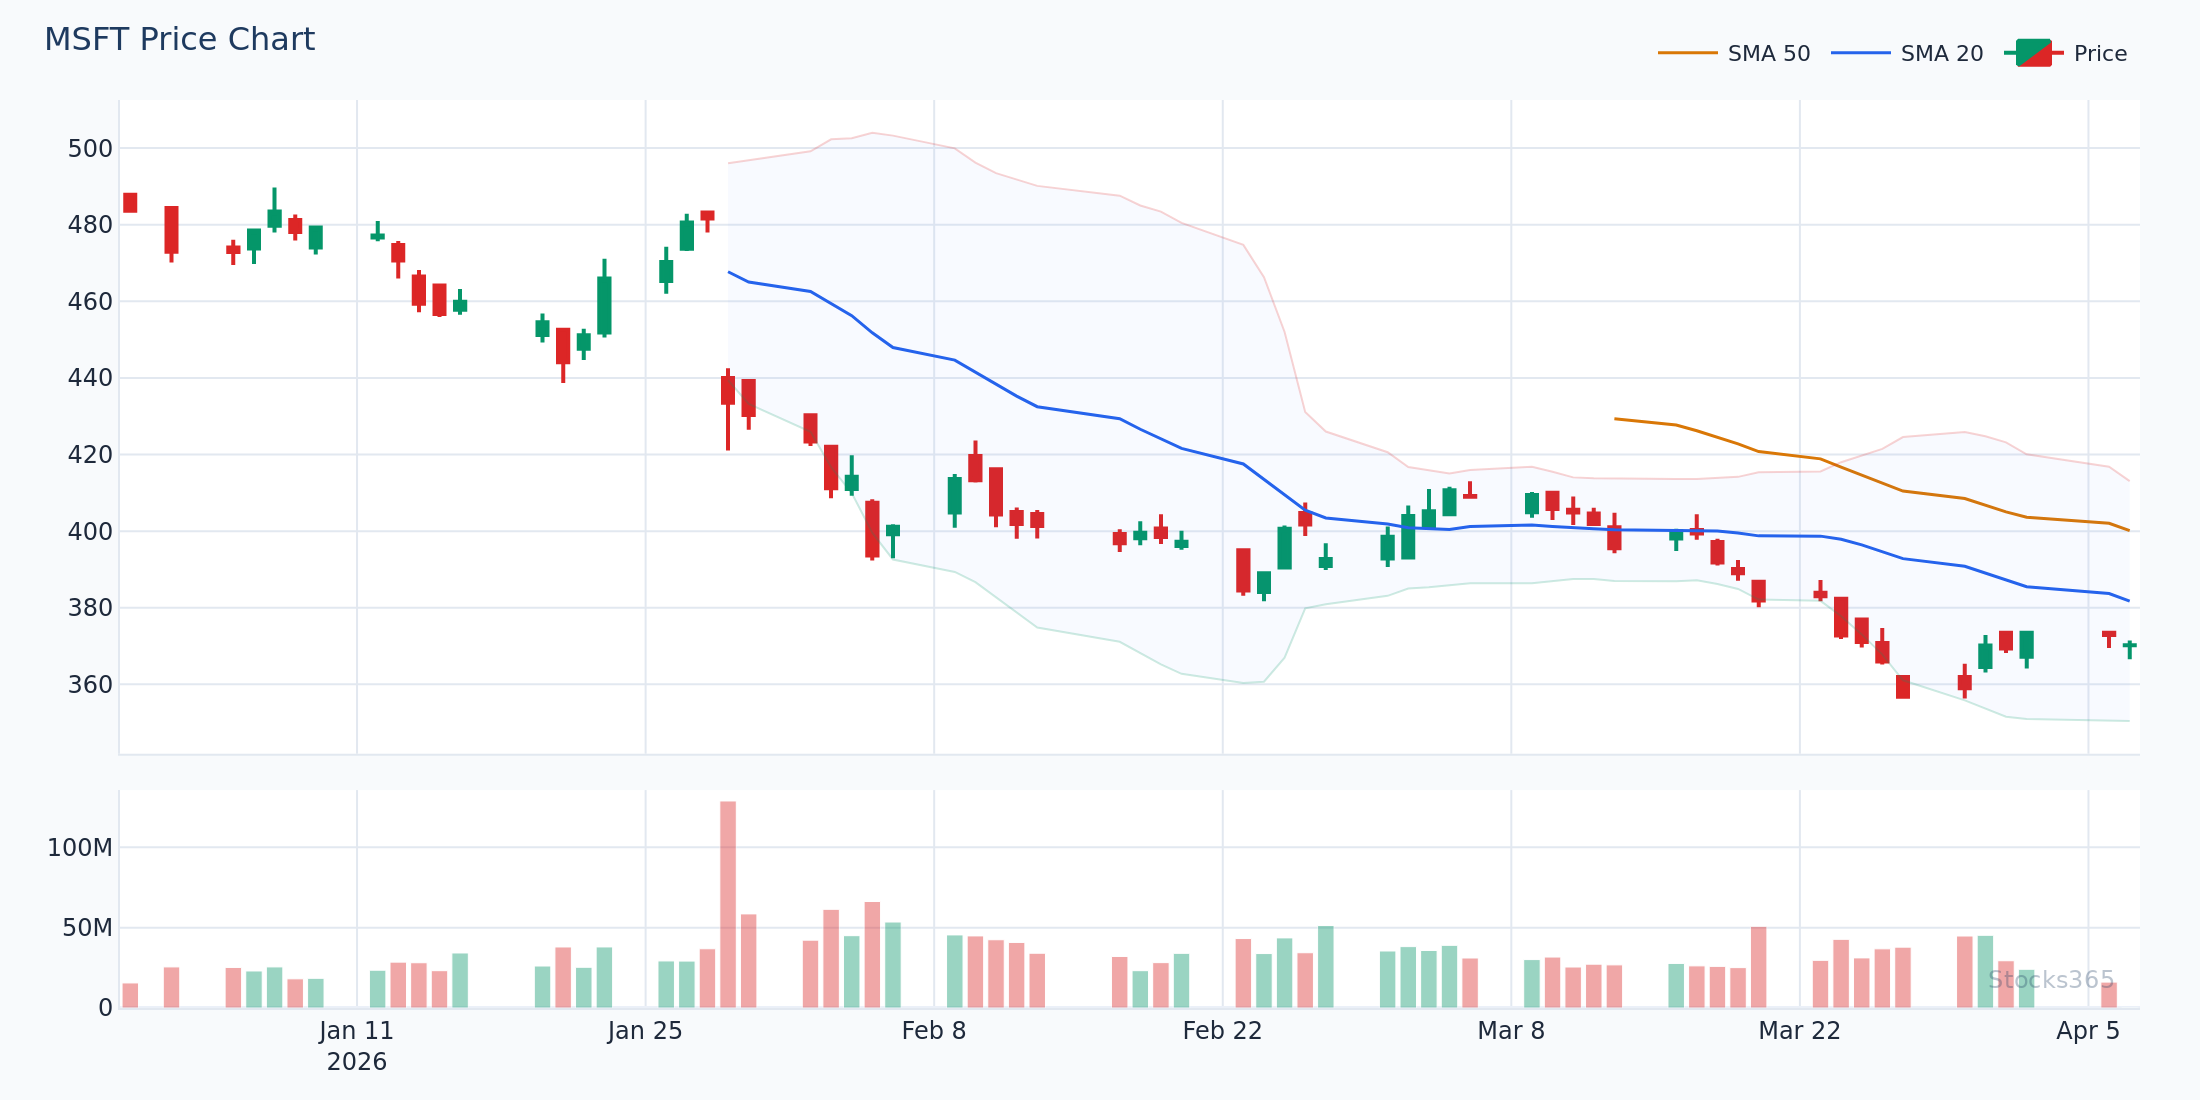
The most reliable MACD zero line crosses occur in the direction of the larger trend. On a weekly chart, if MSFT has been in a confirmed uptrend — higher highs, higher lows — then a bullish zero line cross on the daily chart carries significantly more weight. Always check one timeframe above your trading timeframe to confirm the broader trend direction.
2. Look for Volume Confirmation
A zero line cross accompanied by expanding volume is far more convincing than one that occurs on low, drifting volume. If AMZN crosses the zero line to the upside and the accompanying daily candle shows volume 40% above the 20-day average, that's meaningful institutional participation — not just retail noise.
3. Check for Price Structure Alignment
The best zero line crosses happen in concert with price breaking a key level. If GOOGL has been consolidating between $185 and $195 and the MACD line crosses zero just as price pushes through $195 resistance, the technical alignment is exceptional. Price structure and momentum confirmation together create a high-conviction trade setup.
4. Consider the Histogram Behavior
Before the MACD line crosses zero, the histogram will typically have been expanding in the direction of the cross. Watching the histogram build momentum — increasing bars in one direction — provides an early preview of an impending zero line cross, allowing you to prepare your trade plan in advance.
Step-by-Step: How to Trade the MACD Zero Line Cross
Let's walk through a practical, repeatable trading process using the MACD zero line cross as the primary signal.
Step 1: Set Up Your Chart
Apply the standard MACD settings (12, 26, 9) to your preferred timeframe. For swing trading, the daily chart is ideal. For position trading, use the weekly. For shorter-term trades, the 4-hour chart works well. Ensure your chart also displays volume so you can confirm participation.
Step 2: Identify the Setup
Look for the MACD line approaching zero from either direction. On the bullish side, you want to see the MACD line rising from below zero, ideally with a series of increasing histogram bars. On the bearish side, watch for the MACD line declining toward and through zero with expanding negative histogram bars.
Step 3: Wait for Confirmation
Do not enter on anticipation — wait for the candle to close with the MACD line clearly through zero. A common mistake is entering too early, before the cross is confirmed, which exposes traders to false signals and whipsaws.
Step 4: Define Your Entry
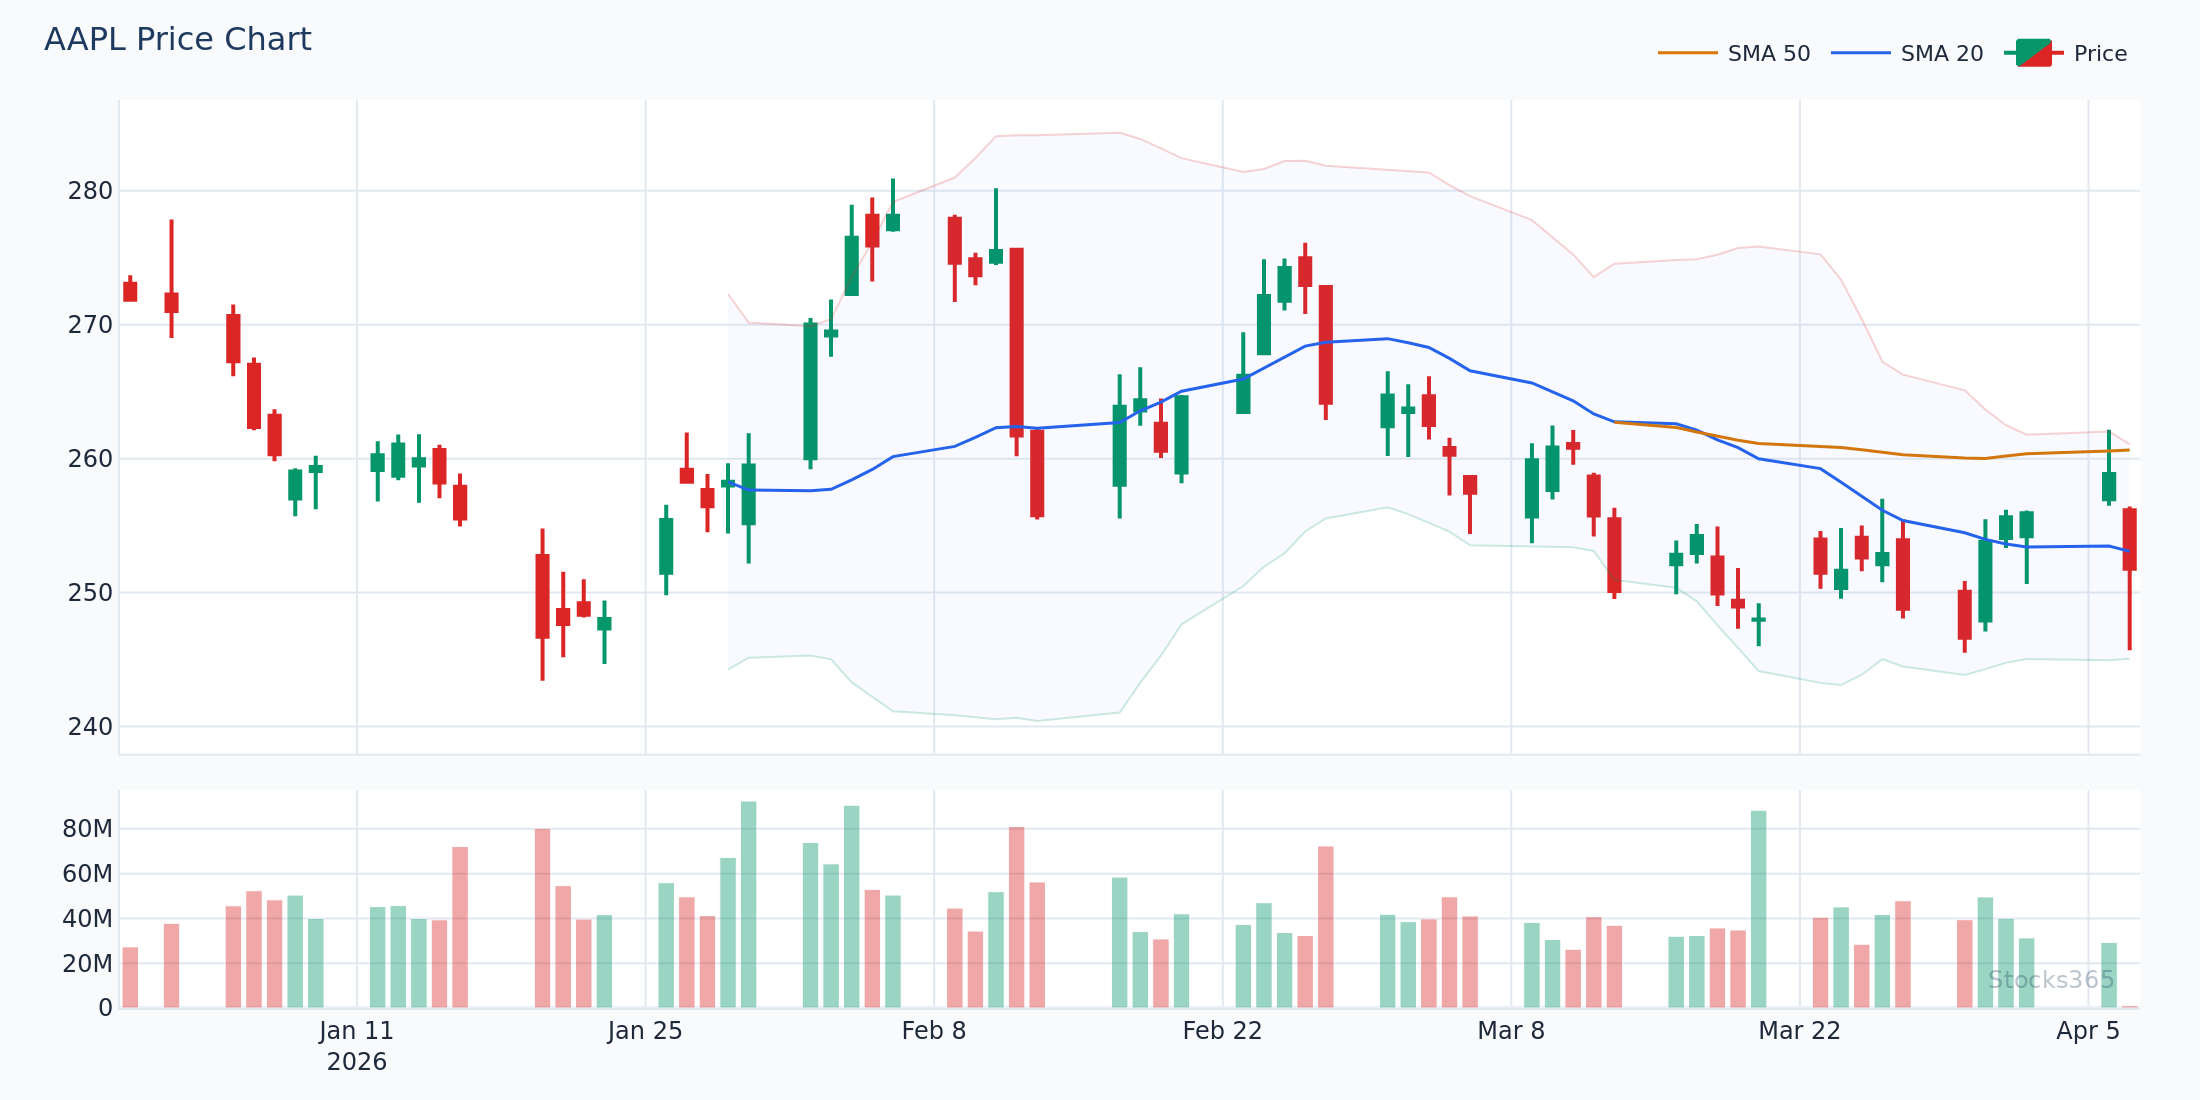
For a bullish zero line cross on AAPL, for example, suppose the cross occurs with AAPL at $228. A disciplined entry might be a limit buy at $228.50 on the next candle's open, or a breakout entry above the previous candle's high at $230. Your exact entry mechanics will depend on your personal style and risk tolerance.
Step 5: Set Your Stop Loss
Place your stop loss below the most recent swing low prior to the zero line cross. If AAPL formed a swing low at $221 before the MACD crossed zero, a stop at $219.50 gives the trade breathing room while limiting risk to a defined level. Never ignore stop placement — it is the cornerstone of trade management.
Step 6: Define Your Target
Use the next significant price structure — resistance for longs, support for shorts — as your initial profit target. For more aggressive traders, the MACD zero line cross can be held as a trend-following position, exited only when the MACD line crosses zero in the opposite direction or when a bearish signal line crossover occurs near resistance.
Combining the MACD Zero Line Cross with Other Indicators
The MACD zero line cross is powerful on its own, but its effectiveness is multiplied when combined with complementary indicators. Here are the most productive combinations:
MACD Zero Line Cross + RSI
The Relative Strength Index is the natural companion to MACD. When a bullish MACD zero line cross occurs simultaneously with the RSI rising above 50, the combined signal is significantly stronger than either alone. The RSI crossing 50 to the upside independently confirms that momentum has shifted bullish — it's measuring the same shift through a different mathematical lens. If you're new to RSI, our guide What Is RSI? The Complete Beginner's Guide provides an excellent foundation, and for understanding how RSI levels strengthen or weaken momentum signals, see our article on RSI Overbought and Oversold Levels.
For even more advanced confluence, consider looking for RSI divergence in the periods leading up to the MACD zero line cross. If bullish RSI divergence forms and is then confirmed by a bullish MACD zero line cross, that is an exceptionally strong setup. Advanced traders should also explore hidden RSI divergence, which can provide powerful continuation signals that complement the MACD zero line cross strategy.
MACD Zero Line Cross + Moving Averages
Adding a 50-period and 200-period simple moving average to your chart allows you to gauge the broader trend context. A bullish MACD zero line cross that occurs while price is trading above both moving averages — and especially after bouncing off the 50 SMA — is a particularly high-conviction long setup.
MACD Zero Line Cross + Support and Resistance
Price action context remains king in technical analysis. A MACD zero line cross that coincides with price testing and bouncing from a well-established support zone creates a multi-factor confluence that dramatically improves the probability of a successful trade. Conversely, a bearish zero line cross at a long-standing resistance zone compounds the bearish case.
Common Mistakes When Trading the MACD Zero Line Cross
Even experienced traders fall into predictable traps with this signal. Here are the most common errors and how to avoid them:
- Trading in choppy, range-bound markets: The MACD zero line cross is a trend-following signal. In sideways markets, the MACD line will oscillate around zero repeatedly, generating false signals. Always assess whether the market is trending or ranging before applying this strategy.
- Ignoring the broader timeframe: A bearish zero line cross on a 15-minute chart means very little if the daily and weekly charts are in strong uptrends. Always ensure alignment across timeframes.
- Entering before candle close: MACD values update with every tick. A MACD line that appears to be crossing zero may retreat before the candle closes. Always wait for candle confirmation.
- Over-relying on a single indicator: No indicator, including MACD, is infallible. Always seek confluence with price action, volume, and at least one additional indicator before committing capital.
- Neglecting risk management: The most accurate signal in the world is worthless without a defined stop loss and position sizing strategy. The MACD zero line cross will produce losing trades — the goal is ensuring winners outpace losers over a large sample size.
Real-World Example: Trading the MACD Zero Line Cross on TSLA
Let's walk through a realistic example using Tesla (TSLA) in early 2026. Assume TSLA has been in a corrective phase, pulling back from $370 to a swing low of $295. During this decline, the MACD line moved deep into negative territory, reaching -18.
As TSLA begins to stabilize around $300, the histogram bars start to shrink — negative momentum is decelerating. The MACD line begins climbing. The signal line crossover occurs first at approximately MACD -4, generating an early alert. Then, as TSLA pushes through $315 with above-average volume, the MACD line crosses zero for the first time.
A trader using this methodology would:
- Enter long at $316 on the next candle open after the zero line cross confirms on candle close
- Place a stop loss at $298 — below the recent swing low with a small buffer
- Target the next significant resistance zone at $340, representing a reward-to-risk ratio of approximately 1.3:1
- Monitor the RSI, which crossed 50 contemporaneously, providing additional bullish confluence
If the trade works as expected and TSLA advances to $340, the gain would be approximately 7.6% with a defined risk of 5.7% — a respectable risk-adjusted outcome that, applied consistently over time, builds meaningful edge.
Using Stocks365 to Enhance Your MACD Zero Line Cross Strategy
While the mechanics of the MACD zero line cross can be applied manually, modern trading platforms like Stocks365 accelerate the process considerably. The Stocks365 signals dashboard aggregates technical signals across hundreds of instruments, allowing you to quickly identify stocks where MACD zero line crosses are forming or have recently triggered — without manually scanning every chart.
Each signal on the platform includes a proprietary Trust Score, which evaluates signal strength by measuring the quality of technical confluence — essentially doing the multi-factor confirmation work described in this article automatically. A high Trust Score on a MACD-related signal suggests that the zero line cross is accompanied by supporting factors like volume expansion, trend alignment, and price structure — exactly the conditions that produce high-probability setups.
For individual stock analysis, pages like the AAPL signal page provide real-time technical signal data, making it simple to assess whether a zero line cross is occurring within a favorable technical context. This kind of integrated analysis is particularly valuable in fast-moving market conditions where manual scanning simply cannot keep pace.
MACD Zero Line Cross Across Different Timeframes
One of the most powerful aspects of the MACD zero line cross is its adaptability across timeframes. The signal is fundamentally the same whether you're looking at a 1-hour chart or a monthly chart — though the implications differ significantly.
- Monthly/Weekly Charts: Zero line crosses on these timeframes signal major, multi-month trend shifts. They are rare, slow to develop, but extremely significant. A monthly MACD zero line cross to the upside on a major index constituent is a strong long-term bullish signal.
- Daily Charts: The sweet spot for swing traders. Daily zero line crosses offer a balance of signal frequency and quality, typically leading to multi-day to multi-week trading opportunities.
- 4-Hour/1-Hour Charts: Suitable for active traders seeking shorter-term opportunities. Signals are more frequent and require tighter stop management, but can still be highly effective when aligned with the daily trend.
The most sophisticated approach is a top-down analysis: use weekly charts to define the macro trend, daily charts to identify the MACD zero line cross entry signal, and intraday charts to refine entry timing and minimize risk.
Key Takeaways: MACD Zero Line Cross
- The MACD zero line cross occurs when the MACD line crosses the zero baseline, confirming a structural shift in momentum between bulls and bears.
- Bullish crosses (MACD rising through zero) signal emerging upward momentum; bearish crosses (MACD falling through zero) signal emerging downward momentum.
- The zero line cross is a confirmation signal — more reliable but slower than the signal line crossover.
- High-quality setups require trend alignment, volume confirmation, price structure confluence, and histogram expansion prior to the cross.
- Combining the MACD zero line cross with RSI (especially RSI divergence and the 50-level) significantly enhances signal quality.
- Always wait for candle close confirmation before entering, and never trade without a defined stop loss.
- The signal is most effective in trending markets — avoid applying it in choppy, sideways conditions.
- Tools like the Stocks365 Trust Score system help quantify signal quality, making it easier to identify the strongest zero line cross setups in real time.
Frequently Asked Questions About the MACD Zero Line Cross
What does the MACD zero line cross tell traders?
The MACD zero line cross tells traders that short-term momentum has shifted relative to longer-term momentum. A bullish cross indicates that the 12-period EMA has crossed above the 26-period EMA — meaning recent buying pressure is outpacing the broader trend's average. A bearish cross signals the opposite. It is widely used as a trend-confirmation signal in both discretionary and systematic trading strategies.
Is the MACD zero line cross better than the signal line crossover?
Neither is strictly "better" — they serve different purposes. The signal line crossover is an earlier, more sensitive signal that can provide advance notice of a potential zero line cross. The zero line cross is slower but carries more structural weight. Most professional traders use both in combination: the signal line crossover as an early alert, the zero line cross as confirmation. For trend-following strategies where false signals are costly, the zero line cross is generally preferred.
Can the MACD zero line cross be used on any asset class?
Yes. The MACD zero line cross is applicable to any liquid, price-driven asset — stocks, ETFs, index futures, currencies, commodities, and even cryptocurrencies. The key requirement is that the asset trends meaningfully, as the signal loses effectiveness in highly erratic or range-bound markets. Standard MACD settings (12, 26, 9) work across most asset classes, though some traders adjust the periods for faster-moving assets.
How do I avoid false MACD zero line cross signals?
The most effective filters are: (1) only trade zero line crosses that align with the dominant trend on a higher timeframe; (2) require volume confirmation — expanding volume during the cross adds conviction; (3) look for price action context such as a breakout from a consolidation zone; (4) confirm with a secondary indicator like RSI crossing 50. Using the RSI as a complementary indicator is one of the most reliable ways to filter MACD signals. Avoiding trades during choppy, low-volatility market conditions also significantly reduces false signals.
What MACD settings work best for the zero line cross strategy?
The standard settings of 12, 26, 9 are the most widely used and are appropriate for most trading styles and timeframes. These settings are well-tested and provide a reliable balance between sensitivity and noise reduction. Shorter settings (such as 8, 17, 9) produce more frequent signals with more noise, while longer settings (such as 19, 39, 9) produce fewer but slower signals. For most traders, the default 12, 26, 9 configuration is the best starting point. You can explore similar considerations around indicator settings in our detailed guide on RSI Settings, which applies the same optimization principles to period selection.