
ما هو المتوسط المتحرك؟ المفهوم الأساسي
المتوسط المتحرك واحد من أكثر الأدوات استخدامًا في التحليل الفني. يُنعّم بيانات الأسعار على مدى فترة محدّدة — ليمنحك صورة أوضح عن المكان الذي كان فيه السعر، وإلى أين قد يتجه.
الفكرة المبسّطة: بدلاً من النظر إلى رسم بياني متعرّج ومليء بالضوضاء، يرسم المتوسط المتحرك خطًا سلسًا عبر البيانات. هذا الخط يخبرك بمتوسط السعر خلال نافذة زمنية محددة — على سبيل المثال، آخر 20 يومًا أو آخر 200 يوم.
بسيط. قوي. كثيرًا ما يُساء فهمه.
جزء "المتحرك" يعني ببساطة أن النافذة الزمنية تتحرك للأمام مع كل شمعة جديدة. أقدم نقطة بيانات من الأمس تسقط، سعر اليوم الجديد يُضاف، ويُعاد حساب المتوسط باستمرار.
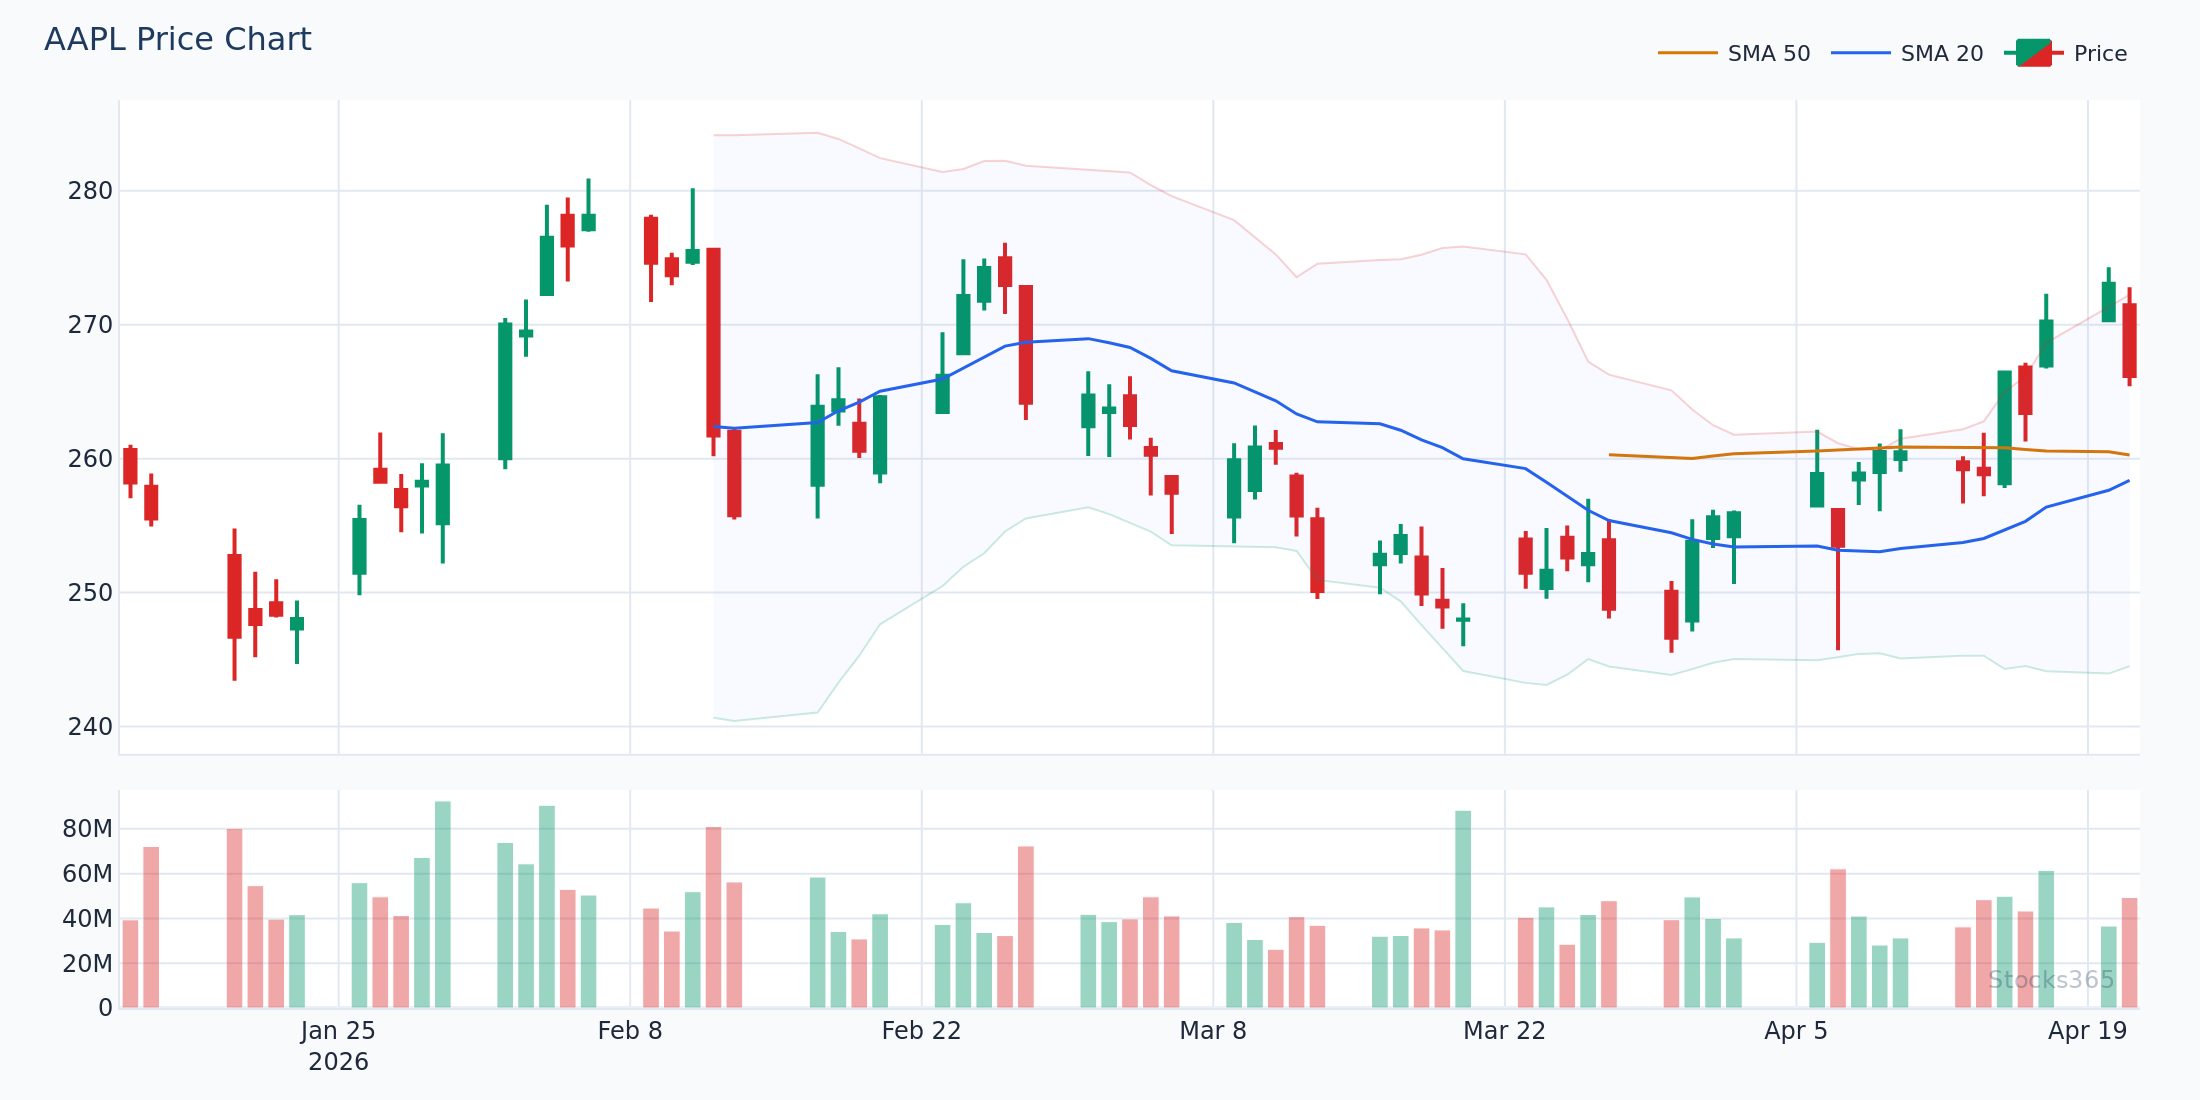
يُظهر هذا الرسم تفاعل السعر مع متوسطين متحركين رئيسيين في الوقت ذاته. لاحظ كيف يميل السعر لإيجاد الدعم قرب المتوسط 20-SMA الصاعد خلال الاتجاهات الصاعدة، وكيف تكشف العلاقة بين المتوسطين عن اتجاه الاتجاه الأوسع. إغلاق مستدام تحت المتوسط 200-SMA سيُبطل البنية الصاعدة بالكامل.
النوعان الرئيسيان من المتوسط المتحرك
ليست كل المتوسطات المتحركة مبنية بالطريقة نفسها. نوعان يهيمنان عمليًا: المتوسط المتحرك البسيط والمتوسط المتحرك الأسي. معرفة الفرق أمر مهم.
المتوسط المتحرك البسيط (SMA)
المتوسط SMA يعطي وزنًا متساويًا لكل سعر في النافذة. المتوسط المتحرك لـ 20 يومًا يجمع آخر 20 سعر إغلاق معًا ويقسمهم على 20. هذا كل شيء. لا حيل.
الفائدة: سلس، ثابت، وسهل التفسير. العيب: يتفاعل ببطء. قفزة سعرية من قبل أسبوعين لها نفس التأثير بالضبط مثل إغلاق اليوم. هذا التأخير قد يكلفك في أسواق سريعة الحركة.
المتوسط المتحرك الأسي (EMA)
المتوسط EMA يعالج مشكلة التأخير — جزئيًا. يطبّق مُضاعفًا يعطي وزنًا أكبر للأسعار الحديثة. الإغلاق الأحدث يُحسب أكثر من إغلاق قبل عشرة أيام.
النتيجة: المتوسط EMA يلتصق بالسعر أكثر. يتفاعل أسرع مع المعلومات الجديدة. متداولو اليوم الواحد والمتداولون المتأرجحون يميلون لتفضيل EMA لهذا السبب. متداولو المراكز ومتابعو الاتجاه غالبًا ما يلتزمون بـSMA.
لا أحد منهما أفضل بشكل عام. السياق هو كل شيء.
أنواع أخرى تستحق المعرفة
- المتوسط المتحرك المرجّح (WMA): مشابه لـEMA لكنه يستخدم مخطط ترجيح خطي. أقل شيوعًا في الممارسة.
- متوسط Hull المتحرك (HMA): مُصمّم لتقليل التأخير مع الحفاظ على السلاسة. شائع لدى المتداولين الخوارزميين.
- VWMA (المتوسط المتحرك المرجّح بالحجم): يرجّح السعر حسب الحجم. مفيد للسياق اليومي على الأصول السائلة.
ابدأ بـSMA وEMA. أتقنهما أولاً قبل استكشاف البقية.
الفترات الأكثر استخدامًا للمتوسط المتحرك
فترات معيّنة أصبحت أعرافًا في السوق. ليس لأنها مثالية رياضيًا — بل لأن عددًا كافيًا من المتداولين يراقبونها، فتصبح نبوءة تحقّق ذاتها.
- 9 EMA: يفضّله سكالبرز ومتداولو اليوم الواحد. حسّاس للغاية للسعر.
- 20 SMA: الافتراضي للمتداول المتأرجح. يتتبع الاتجاه قصير المدى بنظافة.
- 50 SMA: مرجع اتجاه متوسط المدى. المتداولون المؤسساتيون يراقبونه عن كثب.
- 100 SMA: نقطة وسط بين 50 و200. أقل مراقبة، لكنه ذو صلة في بعض الإعدادات.
- 200 SMA: معيار الاتجاه طويل المدى. الخط الفاصل بين منطقة السوق الصاعد والهابط بالنسبة لمعظم المحللين.
المتوسطان 20 و200 هما اللذان لا يمكن للمبتدئ تجاهلهما.
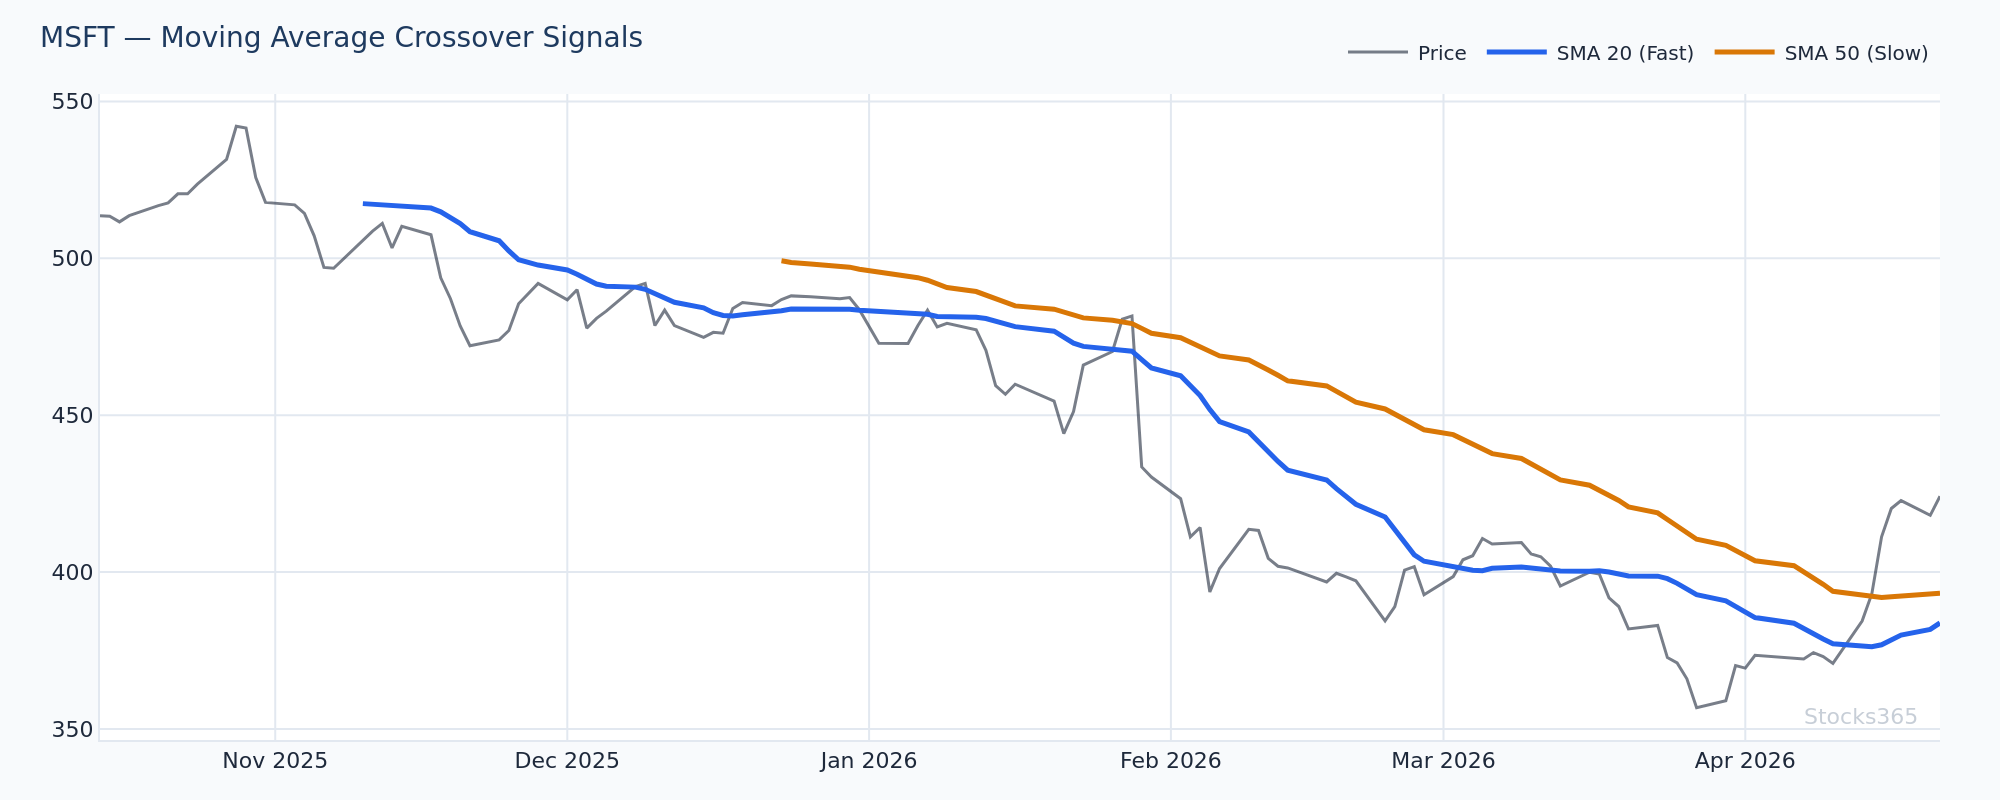
يوضّح هذا الإعداد اثنين من أكثر أحداث التقاطع مناقشة في التداول. عندما يعبر 50-SMA فوق 200-SMA ("التقاطع الذهبي")، يشير إلى تحوّل محتمل من حالة سوق هابطة إلى صاعدة. العكس — "تقاطع الموت" — يشير للعكس. التأكيد الرئيسي الذي ينبغي مراقبته: توسّع الحجم عند لحظة التقاطع، وما إذا كان السعر يتداول بالفعل فوق كلا المتوسطين عند حدوث التقاطع.
كيف تُستخدم المتوسطات المتحركة في التداول
المتوسطات المتحركة تخدم أربعة أغراض متميّزة. معظم المبتدئين يستخدمون واحدًا أو اثنين فقط. معرفة الأربعة جميعًا توسّع ميزتك.
1. تحديد الاتجاه
الاستخدام الأكثر أساسية. عندما يتداول السعر فوق متوسط متحرك صاعد، الاتجاه صاعد. عندما يتداول السعر تحت متوسط متحرك هابط، الاتجاه هابط. هذه القراءة الأساسية.
مرشّح عملي مفيد: إذا كان السعر فوق 200-SMA، فأنت تعمل في اتجاه صاعد طويل المدى. أولوية لإعدادات الشراء. تحت 200-SMA، يميل الانحياز نحو البيع — أو تبقى خارج السوق تمامًا.
2. الدعم والمقاومة الديناميكية
المتوسطات المتحركة تعمل كمستويات دعم ومقاومة عائمة. في اتجاه صاعد صحي، يتراجع السعر إلى المتوسط 20-SMA ويرتد. المتداولون يراقبون هذا النمط تحديدًا — اختبار نظيف للمتوسط المتحرك يتبعه شمعة صاعدة وتأكيد حجم.
المتوسطان 50-SMA و200-SMA يعملان كمستويات دعم أعمق خلال تصحيحات أكبر. سهم يتراجع إلى متوسطه 200-SMA بعد صعود قوي، ثم يصمد، هو أحد إعدادات الشراء الأنظف في التداول التقني.
3. إشارات التقاطع
عندما يعبر متوسط متحرك ذو فترة أقصر فوق آخر أطول، يولّد إشارة صاعدة. عندما يعبر تحته، هابطة. التقاطع الذهبي (50 يعبر فوق 200) وتقاطع الموت (50 يعبر تحت 200) هما الأمثلة الأكثر إشارة.
التقاطعات متأخّرة بطبيعتها. تؤكّد تحوّل الاتجاه بعد أن يكون بالفعل قيد الحركة. هذا ليس عيبًا — إنها ميزة. أنت تتداول التأكيد، وليس التنبؤ.
4. الدمج مع مؤشرات أخرى
المتوسطات المتحركة تعمل بشكل أفضل عند دمجها مع مؤشرات الزخم. إذا لم تكن معتادًا على RSI بعد، دليلنا الشامل للمبتدئين حول RSI هو القراءة التالية الطبيعية. دمج مرشّح اتجاه المتوسط المتحرك مع زخم RSI يمنحك مصدرَي بيانات مستقلّين يشيران في نفس الاتجاه — هنا تتراكم الميزة.
لنظرة أعمق على كيفية تكامل RSI مع المتوسطات المتحركة عمليًا، راجع دليلنا التفصيلي حول استخدام RSI في التداول.
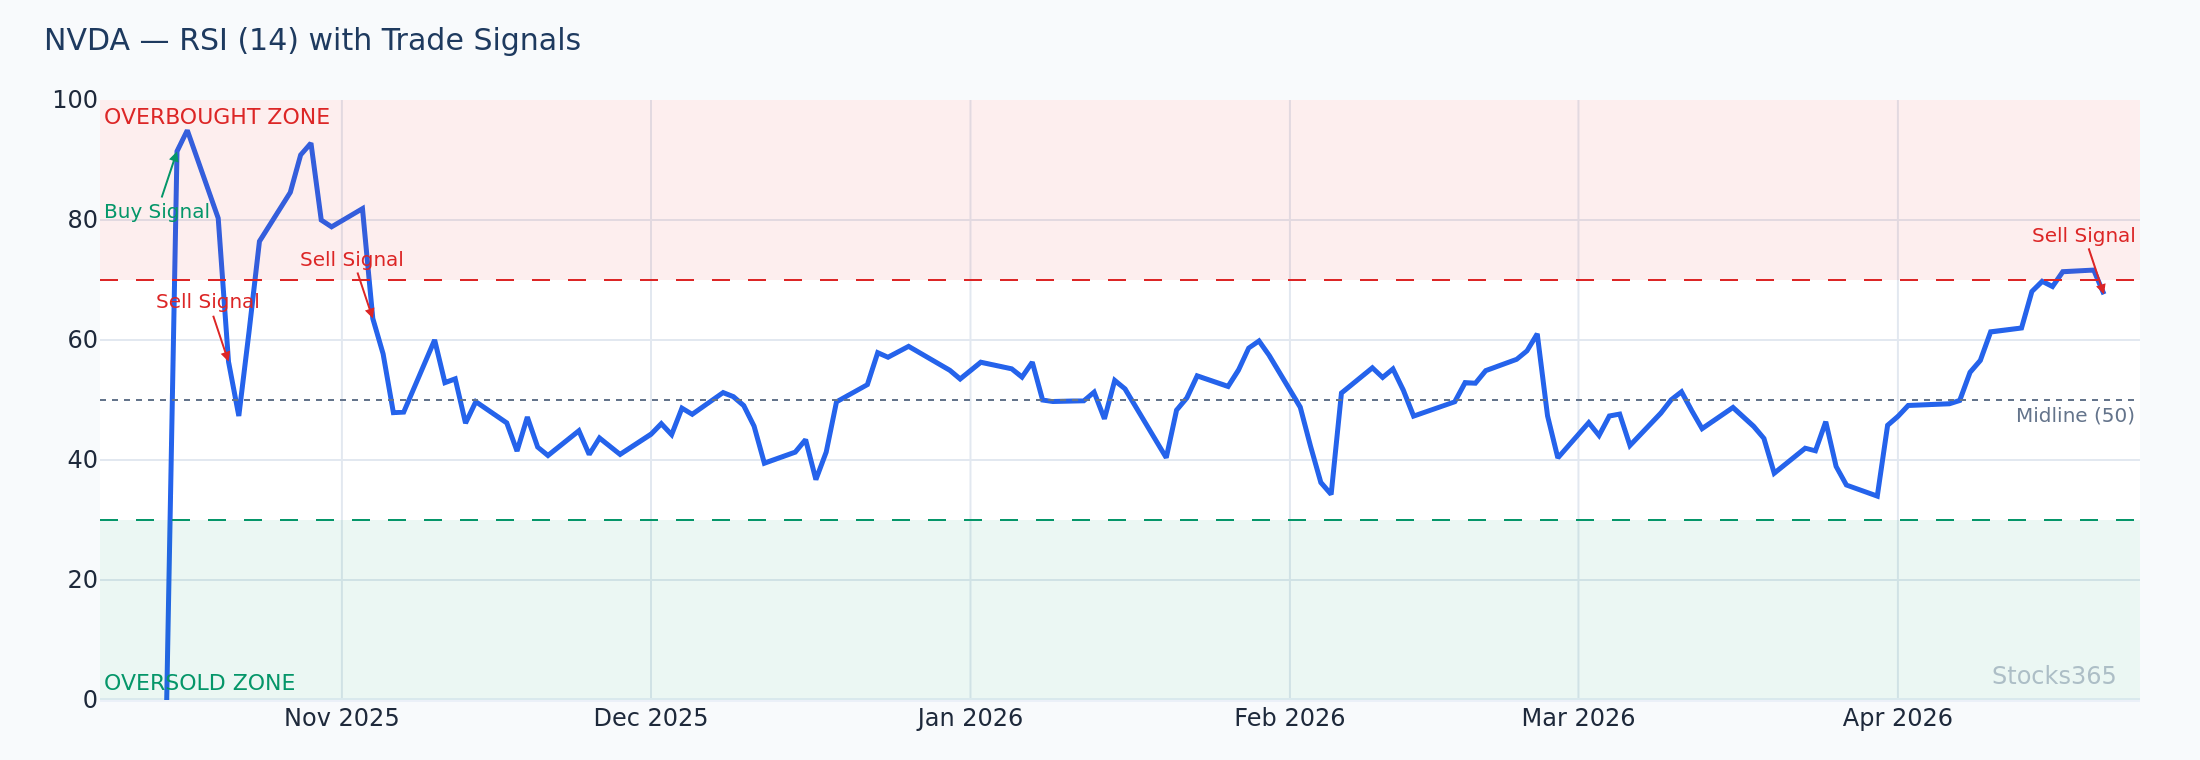
عندما يستعيد السعر المتوسط 20-EMA من الأسفل ويعبر RSI في الوقت نفسه إلى ما فوق 50، يكون لديك تأكيد مزدوج لاستئناف الاتجاه. راقب هذا المزيج تحديدًا بعد تراجع في اتجاه صاعد سائد. يصبح الإعداد ذا احتمالية أعلى عندما يتجاوز الحجم على شمعة التعافي متوسط الـ20 جلسة.
ما يخطئ فيه معظم المتداولين
معظم المبتدئين يعاملون عبور السعر تحت المتوسط 20-SMA كإشارة بيع تلقائية. في اتجاه صاعد قوي، يعبر السعر تحت المتوسط 20-SMA مرارًا — ويرتد في كل مرة. الميزة ليست في العبور نفسه. الميزة في مراقبة ما إذا كان السعر يغلق مرة أخرى فوق المتوسط المتحرك خلال 1-3 جلسات، أو يستمر للأسفل مع توسّع الحجم. انخفاض موجز تحته يتبعه استعادة قوية غالبًا هو النمط الأكثر صحة في اتجاه صاعد. عبور للأسفل مصحوب بحجم متزايد ومحاولات استعادة فاشلة هو عندما يكون التحذير حقيقيًا.
استراتيجيات تقاطع المتوسط المتحرك: الإعدادات التي تعمل فعلاً
إعداد التراجع إلى المتوسط المتحرك
هذا هو الإعداد الأنظف للمتداولين المتأرجحين. السعر في اتجاه صاعد واضح فوق المتوسط 20-EMA. يتراجع السعر ليلمس المتوسط 20-EMA. تتشكل شمعة انعكاس صاعدة عند المتوسط مع ارتفاع الحجم. الدخول عند كسر قمة شمعة الانعكاس. وقف الخسارة تحت المتوسط المتحرك.
نظيف. مخاطر محدّدة. يسير مع الاتجاه.
إعداد استعادة المتوسط المتحرك
ينخفض السعر تحت متوسط متحرك رئيسي (مثلاً، 50-SMA)، يتماسك، ثم يخترق فوقه مرة أخرى بقناعة. هذه "الاستعادة" غالبًا تشير إلى بداية المرحلة التالية للأعلى. تأكيد الحجم حاسم — استعادة على حجم منخفض مشبوهة. استعادة على حجم 1.5x إلى 2x المتوسط قابلة للتنفيذ.
مرشّح الاتجاه بمتوسطين
استخدم المتوسط 200-SMA لتحديد الاتجاه الكلي (فوقه = انحياز صاعد، تحته = انحياز هابط). استخدم المتوسط 20-EMA لتوقيت الدخول ضمن ذلك الاتجاه الكلي. خذ فقط إعدادات شراء عندما السعر فوق 200-SMA. هذا المرشّح الوحيد يُزيل نسبة كبيرة من صفقات عكس الاتجاه التي تستنزف الحسابات.
للمتداولين الذين يسعون لصقل مداخلهم أكثر، دمج هذا مع قراءات RSI لذروة الشراء والبيع يضيف طبقة أخرى. راجع دليلنا حول مستويات ذروة الشراء والبيع لـRSI لكيفية طبقات هذه الإشارات بفعالية.
ما تقوله البيانات فعلاً عن تقاطعات SMA
تقاطعات المتوسطات المتحركة يُتحدث عنها باستمرار. لكن ماذا تقول الأرقام؟
تحليلنا لـ3,332 إشارة عبر الأسهم والعملات الرقمية والفوركس وجد أن عبور السعر تحت المتوسط 20-SMA ينتج نسبة فوز 50.9% على مدى فترة احتفاظ 10 أيام — مع عامل ربح 1.06. فئة الأصول الأفضل أداءً لهذه الإشارة كانت العملات الرقمية بنسبة 66.8%. الأسوأ كان الفوركس بنسبة 42.5%. هذا الفارق وحده يخبرك بشيء مهم: نفس إشارة المتوسط المتحرك تتصرف بشكل مختلف تمامًا حسب فئة الأصول التي تتداولها. انظر مجموعة البيانات الكاملة في Stocks365 Insights.
الاستنتاج ليس أن المتوسطات المتحركة أدوات ضعيفة. بل أن إشارات التقاطع الخام دون مرشّحات إضافية قريبة من قلب العملة في معظم الأسواق. الميزة تأتي من السياق: اتجاه الاتجاه، الحجم، تأكيد الزخم، واختيار فئة الأصول.
المتوسطات المتحركة في ظروف سوق مختلفة
الأسواق ذات الاتجاه
المتوسطات المتحركة تتألّق في الأسواق ذات الاتجاه. يحترم السعر المتوسطات كدعم ديناميكي. إشارات التقاطع لها متابعة. إعدادات التراجع إلى المتوسط المتحرك تعمل بشكل متكرر. هذه البيئة التي صُمّمت المتوسطات المتحركة من أجلها.
الأسواق الجانبية
المتوسطات المتحركة تعاني في الأسواق الجانبية المتقلبة. يتذبذب السعر فوق وتحت المتوسط. إشارات التقاطع تُطلق بشكل متكرر دون متابعة. في ظروف النطاق، مؤشرات التذبذب مثل RSI ومؤشر Stochastic تتفوق على المتوسطات المتحركة كأدوات مستقلة. للمقارنة التفصيلية، راجع دليلنا حول RSI مقابل مؤشر Stochastic.
اعرف حالة السوق. كيّف الأدوات.
الأسواق المتقلبة
في حالات التقلب العالي، يتحرك السعر عبر المتوسطات المتحركة بقوة في كلا الاتجاهين. المتوسطات المتحركة قصيرة الفترة تنتج ضوضاء زائدة. المتوسطات طويلة الفترة (50، 100، 200) تصبح أكثر صلة كمراجع هيكلية. قلّل حجم المركز في هذه الظروف بغض النظر عما يقوله المتوسط المتحرك.
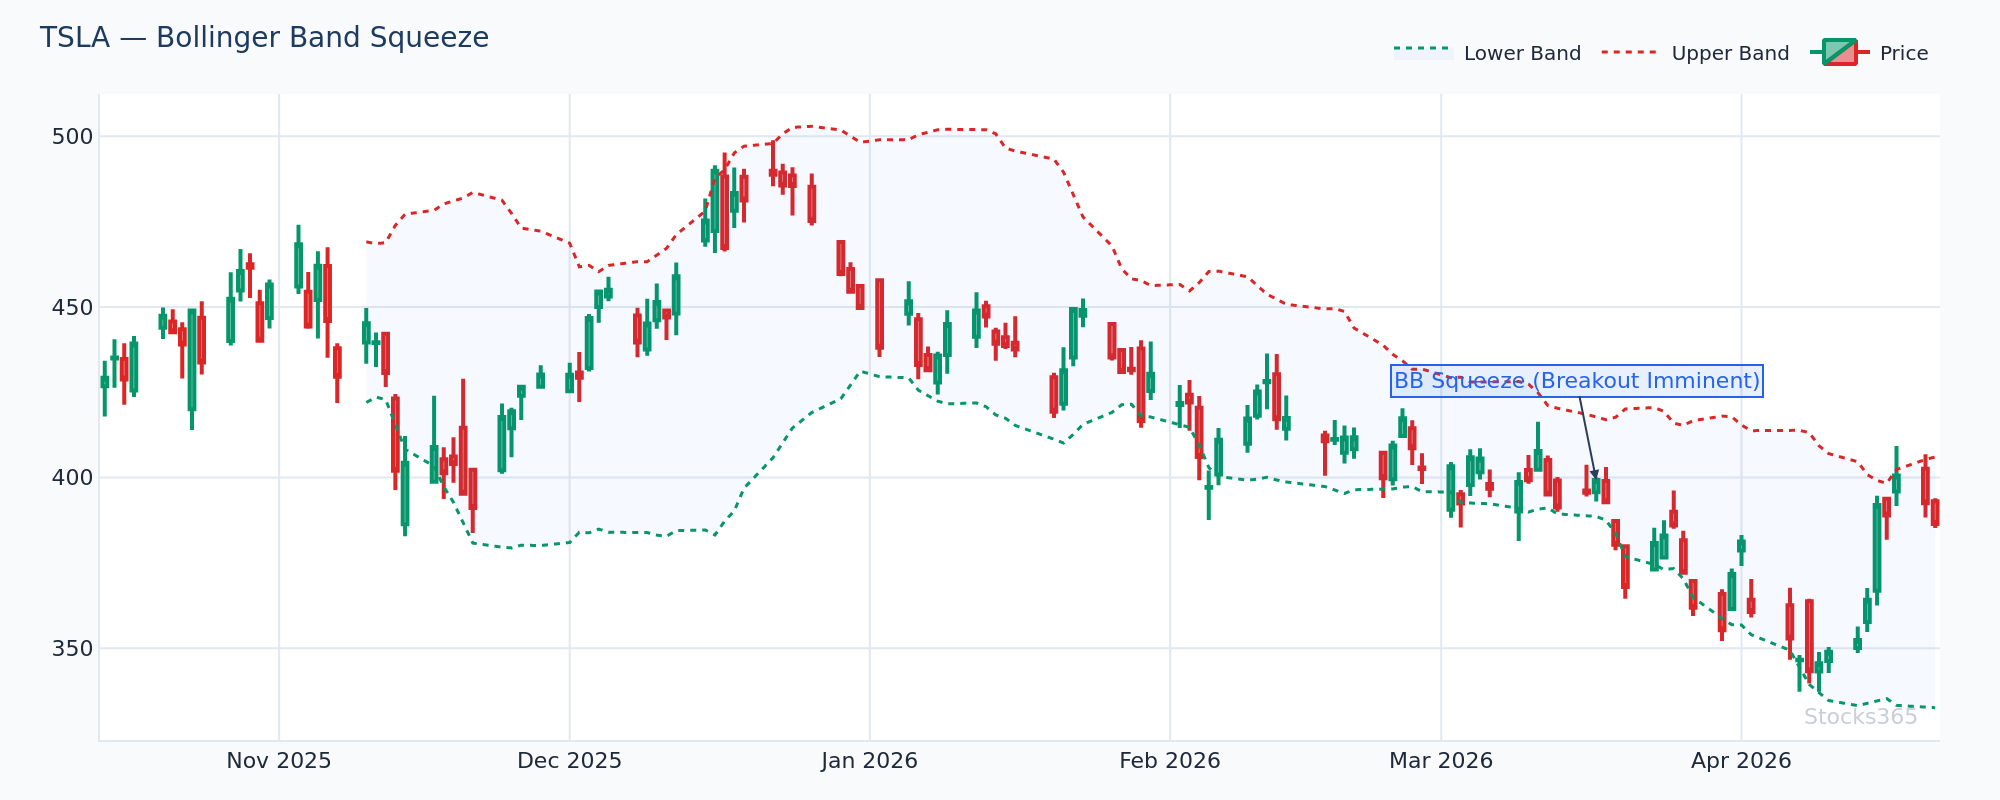
ضغط Bollinger Band — حيث تنقبض النطاقات بإحكام حول المتوسط 20-SMA — يشير لفترة تقلب منخفض قبل توسّع تقلب عالٍ. المتوسط 20-SMA يعمل كمرساة نقطة المنتصف أثناء الضغط. راقب الشمعة التي تخترق خارج النطاقات على حجم متوسّع — هذا عادة اتجاه الحركة المستدامة التالية. كسر عائد داخل النطاقات بعد التوسع الأولي غالبًا يشير لاختراق كاذب.
المتوسطات المتحركة مقابل مؤشرات أخرى: أين تتناسب
المتوسطات المتحركة أدوات متابعة اتجاه. تؤكّد الاتجاه لكن لا تتنبأ بالانعكاسات. RSI ومؤشرات الزخم تحدّد ظروف الإفراط. مؤشرات الحجم تؤكّد القناعة. كل أداة تجيب على سؤال مختلف.
إطار تداول كامل يستخدم المتوسطات المتحركة للإجابة: ما هو الاتجاه؟ ثم يستخدم مؤشرات الزخم للإجابة: هل الاتجاه مفرط؟ ثم يستخدم الحجم للإجابة: هل هناك قناعة وراء الحركة؟
إذا كنت تبني هذا النوع من النهج متعدد الطبقات، فهم إشارات تباعد RSI مكمّل طبيعي لإعدادات تقاطع المتوسط المتحرك. التباعد بين السعر والزخم — مرصود مقابل اتجاه متوسط متحرك — واحد من إشارات الانعكاس ذات الاحتمالية الأعلى في التحليل الفني.
وللمتداولين الذين يريدون الغوص أعمق في إشارات الزخم التي تعمل حتى عندما تعطي المتوسطات المتحركة قراءات غير واضحة، تباعد RSI الخفي يستحق الدراسة.
اختيار المتوسط المتحرك الصحيح لاستراتيجيتك
لا يوجد أفضل متوسط متحرك واحد. الاختيار الصحيح يعتمد على إطارك الزمني، فئة أصولك، ونوع استراتيجيتك.
- متداولو اليوم الواحد: 9 EMA و20 EMA على رسوم 5 دقائق أو 15 دقيقة. رد فعل سريع، إيقافات ضيقة.
- المتداولون المتأرجحون: 20 EMA و50 SMA على الرسوم اليومية. يوازن الحساسية مع تقليل الضوضاء.
- متداولو المراكز: 50 SMA و200 SMA على الرسوم اليومية أو الأسبوعية. تحديد اتجاه هيكلي فقط.
مبدأ عملي واحد: كلما طالت فترة المتوسط المتحرك، كانت الإشارة أكثر أهمية عندما يتفاعل السعر معه. اختبار المتوسط 200-SMA يعني أكثر من اختبار 20-SMA من حيث الأهمية الهيكلية.
للمهتمين بكيفية تأثير اختيار الفترة على أداء المؤشر بشكل أوسع، نفس المنطق ينطبق على إعدادات RSI — دليلنا حول إعدادات RSI واختيار الفترة يغطي هذا بعمق.
📌 النقاط الرئيسية
- المتوسط المتحرك يُنعّم بيانات السعر للكشف عن اتجاه الاتجاه بحساب متوسط أسعار الإغلاق خلال فترة محددة.
- النوعان الأكثر أهمية هما المتوسط المتحرك البسيط (SMA) والمتوسط المتحرك الأسي (EMA) — EMA يتفاعل أسرع، SMA أكثر سلاسة.
- الفترات الأكثر مراقبة هي 20 و50 و200. كل منها يخدم إطارًا زمنيًا وغرضًا مختلفًا.
- المتوسطات المتحركة تحدّد اتجاه الاتجاه، تعمل كدعم/مقاومة ديناميكية، تولّد إشارات تقاطع، وترشّح مداخل عند دمجها مع مؤشرات الزخم.
- تعمل بشكل أفضل في الأسواق ذات الاتجاه وتعاني في ظروف جانبية متقلبة — الوعي بحالة السوق أساسي.
- إشارات التقاطع الخام تنتج نتائج قريبة من قلب العملة دون سياق إضافي. الحجم، الزخم، واختيار فئة الأصول تحسّن النتائج بشكل كبير.
- ادمج المتوسطات المتحركة مع RSI للحصول على تأكيد اتجاه-زائد-زخم — إشارتان مستقلتان تشيران لنفس الاتجاه إعداد احتمالية أعلى.
ما يجب مراقبته
- ارتدادات التراجع إلى 20-EMA في أسهم ذات اتجاه: عندما يتراجع سهم في اتجاه صاعد واضح لاختبار متوسطه 20-EMA ويطبع شمعة ابتلاع صاعدة أو مطرقة على حجم فوق المتوسط، هذا أحد أنظف إعدادات الاستمرار. النمط يُبطل إذا أغلق السعر تحت 20-EMA مع توسّع الحجم.
- استعادات 200-SMA في أسهم كبيرة بعد تصحيحات ممتدة: عندما يستعيد السعر المتوسط 200-SMA بعد التداول تحته لأسابيع متعددة، ويفعل ذلك مع توسّع حجم، غالبًا يشير لبداية مرحلة تعافي مستدامة بدلاً من ارتداد راحة موجز.
- تشكيلات التقاطع الذهبي حيث السعر ممتد بالفعل فوق كلا المتوسطين: عندما يعبر 50-SMA المتوسط 200-SMA لكن السعر ارتفع بالفعل 15-20% فوق كليهما، الإشارة متأخرة. راقب هذه لتنتج توحيدًا بدلاً من تسريع اتجاه فوري — الدخول الأفضل على أول تراجع إلى 50-SMA بعد تأكيد التقاطع.
- تقارب المتوسط المتحرك في حالات تقلب منخفض: عندما تنضغط المتوسطات 20 و50 و200 SMA نحو بعضها على رسم يومي، حركة اتجاهية كبرى تتراكم عادة. أول كسر وإغلاق نظيف فوق أو تحت المتوسطات الثلاثة جميعًا على توسّع حجم غالبًا يحدّد الاتجاه التالي لأسابيع.
- انضغاط شريط EMA في العملات الرقمية: على أصول العملات الرقمية، عندما ينضغط شريط EMA متعدد (9، 20، 50 EMAs) بإحكام بعد اتجاه مستدام، التوسع اللاحق يميل لأن يكون حادًا واتجاهيًا. هذا الإعداد يتزاوج جيدًا مع RSI يتعافى من منطقة ذروة البيع لتأكيد اتجاه التوسع.
⚡ كيف تستخدم Stocks365 المتوسطات المتحركة
المتوسطات المتحركة مدمجة مباشرة في نظام درجة الثقة لدى Stocks365 كواحد من أكثر من 12 مؤشرًا تقنيًا يساهم في التصنيف المركّب لكل إشارة. تحديدًا، موضع المتوسط المتحرك — ما إذا كان السعر فوق أو تحت SMAs وEMAs رئيسية — يُغذّي طبقة تسجيل حالة الاتجاه من درجة الثقة. إشارة مولّدة في أصل حيث السعر فوق كل من 20-SMA و200-SMA تحصل على درجة توافق حالة أعلى من واحدة مولّدة في أداة هيكلياً هابطة.
درجة الثقة أيضًا تدمج حداثة تقاطع المتوسط المتحرك — تقاطعات ذهبية حديثة تزيد درجة الاتفاق بين مؤشرات متابعة الاتجاه، بينما تقاطعات الموت تضيف وزنًا لمجموعات إشارات هابطة. هذا يعني عندما تعرض أي إشارة على لوحة تحكم إشارات Stocks365، سياق المتوسط المتحرك مُخبوز بالفعل في تصنيف الجودة — أنت لا تقيّمه يدويًا. لمثال محدّد عن كيف يبدو هذا عمليًا، تحقق من تفصيل درجة الثقة على أي إشارة فردية مثل صفحة إشارة AAPL.
تحليلنا لـ3,289 إشارة عبور-السعر-فوق-SMA-20 وجد نسبة فوز 48.3% وعامل ربح 0.88 على مدى فترة احتفاظ 10 أيام — نتيجة تحت الحياد عبر مجموعة البيانات الكاملة. لكن الأسهم كفئة أصول أظهرت نسبة فوز 52.3% لهذه الإشارة المحددة، ولهذا درجة الثقة ترجّح سياق فئة الأصول بدلاً من معاملة جميع إشارات التقاطع بالتساوي. بحث إشارات كامل متاح في Stocks365 Insights.
الأسئلة الشائعة
ما هو المتوسط المتحرك ببساطة؟
المتوسط المتحرك هو متوسط سعر إغلاق أصل ما خلال عدد محدّد من الفترات — يُحدّث مع كل شمعة جديدة. يُنعّم ضوضاء السعر ويرسم خطًا واحدًا على الرسم البياني يُظهر إلى أين كان السعر يتجه. المتوسط المتحرك لـ20 يومًا، على سبيل المثال، يُظهر متوسط سعر الإغلاق خلال آخر 20 يوم تداول، يُعاد حسابه يوميًا مع وصول بيانات جديدة.
ما الفرق بين SMA وEMA؟
المتوسط المتحرك البسيط (SMA) يعطي وزنًا متساويًا لجميع الأسعار في النافذة. المتوسط المتحرك الأسي (EMA) يعطي وزنًا أكبر للأسعار الحديثة، ما يجعله يتفاعل أسرع مع حركة السعر الجديدة. المتداولون على المدى القصير يفضلون EMA لسرعة استجابته. المتداولون الذين يريدون تحديد اتجاه أنظف وأقل تفاعلاً يفضلون SMA. كلاهما له حالات استخدام صحيحة — الاختيار يعتمد على إطارك الزمني واستراتيجيتك.
ما هو أفضل متوسط متحرك للمبتدئين؟
ابدأ بـ20-SMA و200-SMA على الرسوم البيانية اليومية. المتوسط 20-SMA يتتبع الاتجاه قصير المدى ويعمل كدعم ديناميكي في الاتجاهات الصاعدة. المتوسط 200-SMA يحدّد بنية الاتجاه الكلي — فوقه السوق صاعد على نطاق واسع، تحته هابط على نطاق واسع. هذان المتوسطان وحدهما يمنحان المبتدئ إطارًا واضحًا لتحديد الاتجاه دون تعقيد التحليل.
هل تعمل المتوسطات المتحركة في جميع الأسواق؟
المتوسطات المتحركة تعمل بشكل أفضل في الأسواق ذات الاتجاه — أسهم في اتجاهات صاعدة قوية، عملات رقمية خلال مسارات اتجاهية كبرى، سلع في دورات عرض/طلب مستدامة. تنتج إشارات مشوشة وغير موثوقة في الأسواق الجانبية المتقلبة حيث يتذبذب السعر دون قناعة اتجاهية. تحديد ما إذا كان السوق في اتجاه أو نطاق قبل تطبيق استراتيجيات المتوسطات المتحركة مهارة أساسية. في ظروف النطاق، مؤشرات التذبذب مثل RSI تميل للتفوق على المتوسطات المتحركة كأدوات توقيت.
كيف أستخدم المتوسطات المتحركة مع RSI معًا؟
المزيج الأكثر عملية: استخدم المتوسط المتحرك لتحديد اتجاه الاتجاه، استخدم RSI لتوقيت المداخل ضمن ذلك الاتجاه. في اتجاه صاعد (السعر فوق 20-EMA و200-SMA)، انتظر حتى يتراجع RSI نحو منطقة 40-50 — مشيرًا لإعادة ضبط زخم دون كسر اتجاه. عندما يتعافى RSI فوق 50 بينما السعر يبقى فوق المتوسط المتحرك، هذا إعداد شراء بتأكيد مزدوج. لتفصيل كامل لهذا النهج، راجع دليل تداول RSI ودليل إعدادات RSI.