
Moving Average Trading Plan: From Setup to Execution
Most traders know what a moving average is. Few know how to build a complete moving average trading plan around it. There's a significant difference between understanding an indicator and deploying it systematically — and that gap is where most retail traders lose money.
This guide closes that gap. We'll cover every phase of building and executing a moving average trading plan: choosing the right averages, defining your entry and exit rules, managing risk, and adapting to different market conditions.
Stocks365 backtested 3,332 signals across multiple asset classes using a Price Crosses Below SMA 20 setup and found a 50.9% win rate with a profit factor of 1.06 over a 10-day holding period. That's a slim but real edge — and it's the kind of edge a structured trading plan is designed to exploit consistently. Without a plan, that edge evaporates into a series of emotional decisions.
Why Most Moving Average Plans Fail Before They Start
Here's what most traders get wrong: they treat moving averages as buy and sell signals in isolation. They see price cross above the 50-day SMA and immediately enter long. When it doesn't work, they blame the indicator. The problem isn't the indicator. The problem is the absence of a trading plan surrounding it.
A moving average is a filter, not a trigger. It tells you the trend regime. Your entry trigger, risk parameters, and exit logic — those come from the plan you build around it. Without that structure, you're reacting. With it, you're executing.
Step 1 — Define Your Moving Average Setup
Choosing the Right Moving Averages
The first decision in any moving average trading plan is selecting which averages to use. This isn't arbitrary — it depends on your trading timeframe and the asset class you're trading.
- Short-term traders (swing trading, 3–10 day holds): Focus on the 10-SMA, 20-SMA, and 50-SMA. These react quickly and capture momentum shifts early.
- Medium-term traders (position trading, weeks to months): The 50-SMA and 200-SMA provide meaningful trend context without excessive noise.
- Trend-confirmation setups: Using three moving averages together — short, medium, and long — creates a powerful alignment filter. The Triple Moving Average Strategy for Trend Confirmation explains this framework in detail and is worth studying before finalizing your setup.
Simple vs. Exponential Moving Averages
Simple Moving Averages (SMA) weight all periods equally. Exponential Moving Averages (EMA) weight recent prices more heavily. For most trading plans, the distinction matters less than consistency. Pick one. Stick with it. Don't switch between SMA and EMA mid-strategy because recent performance looked better on one. That's curve-fitting, not planning.
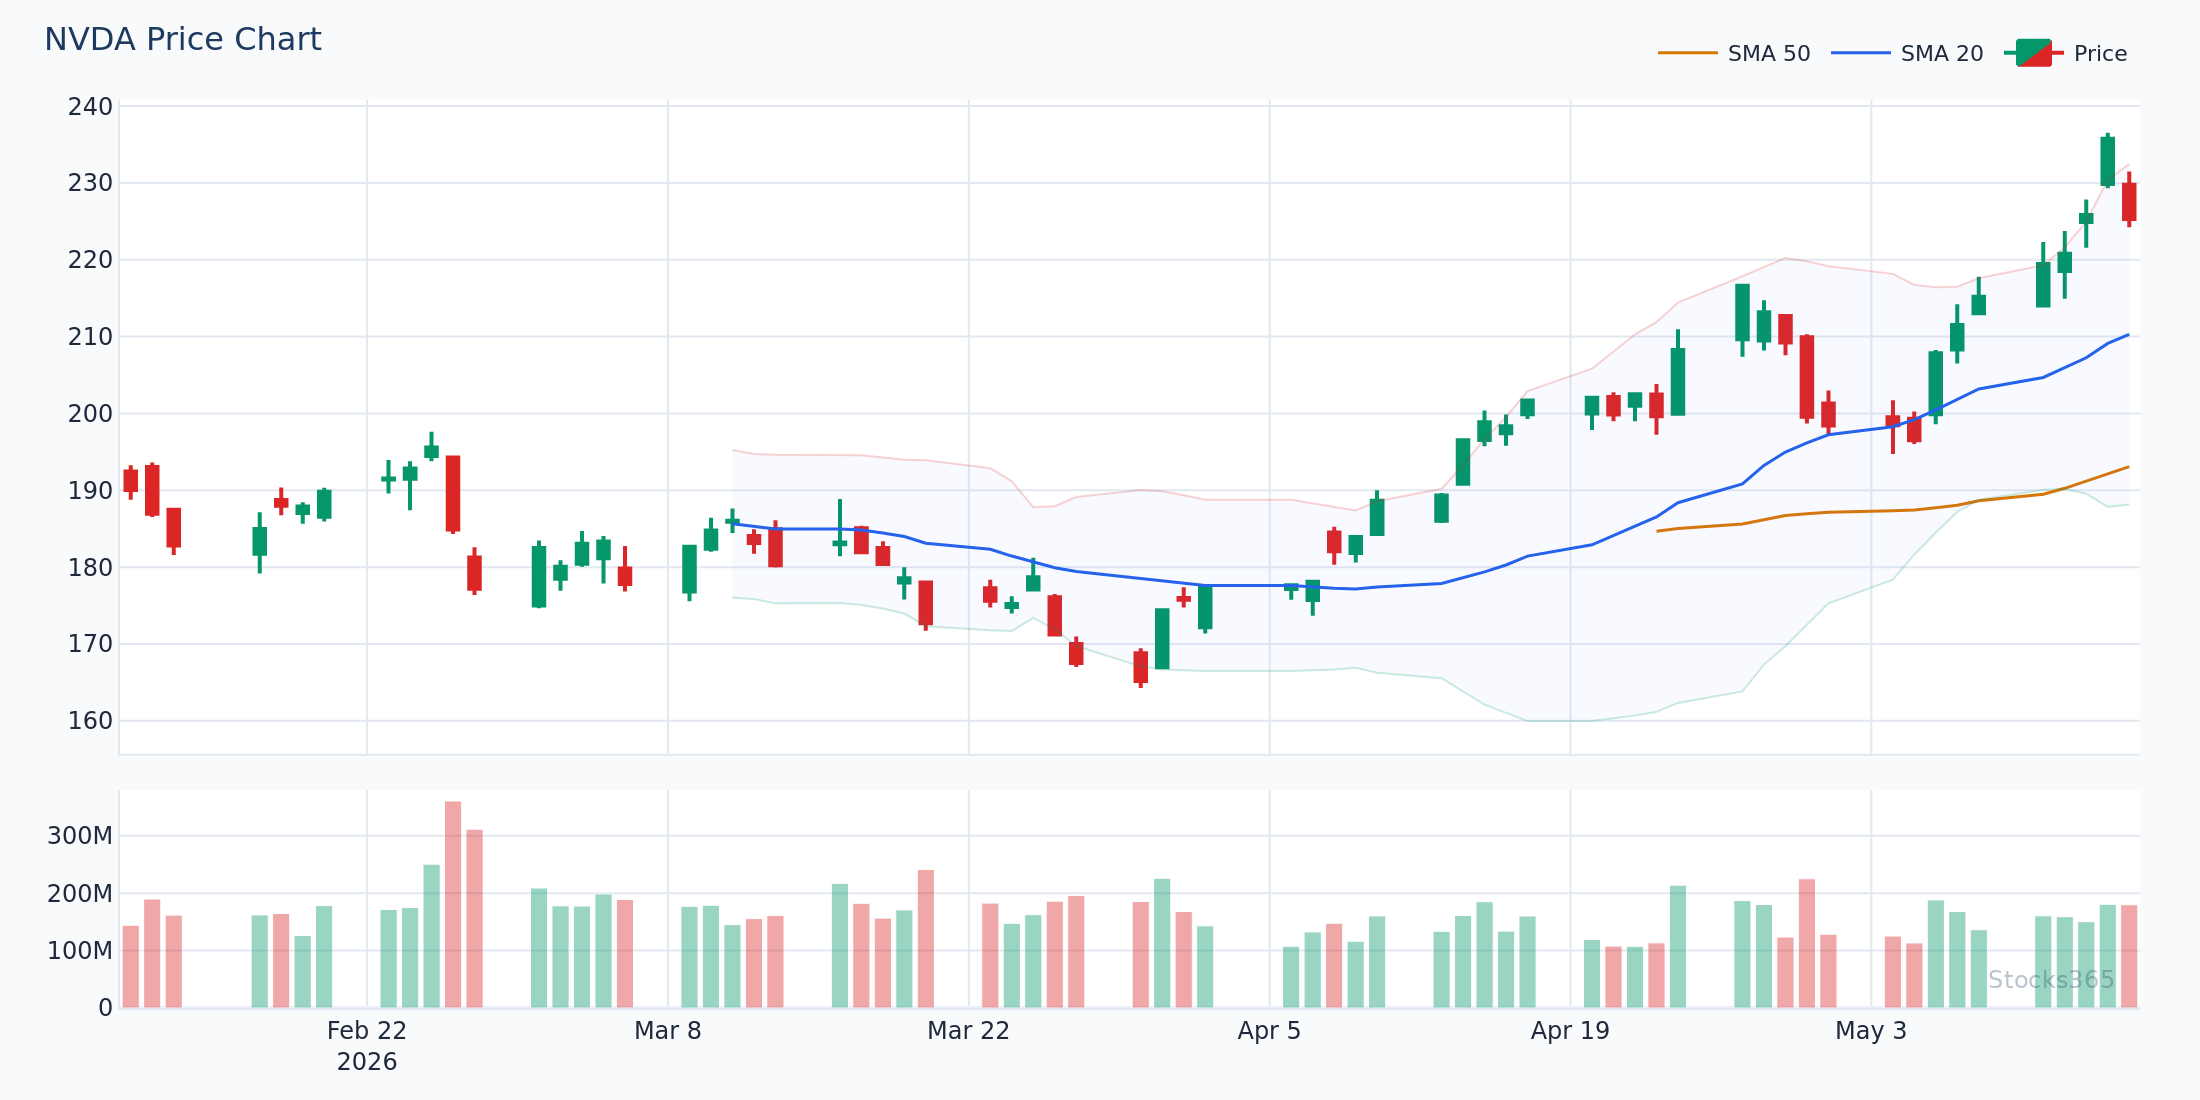
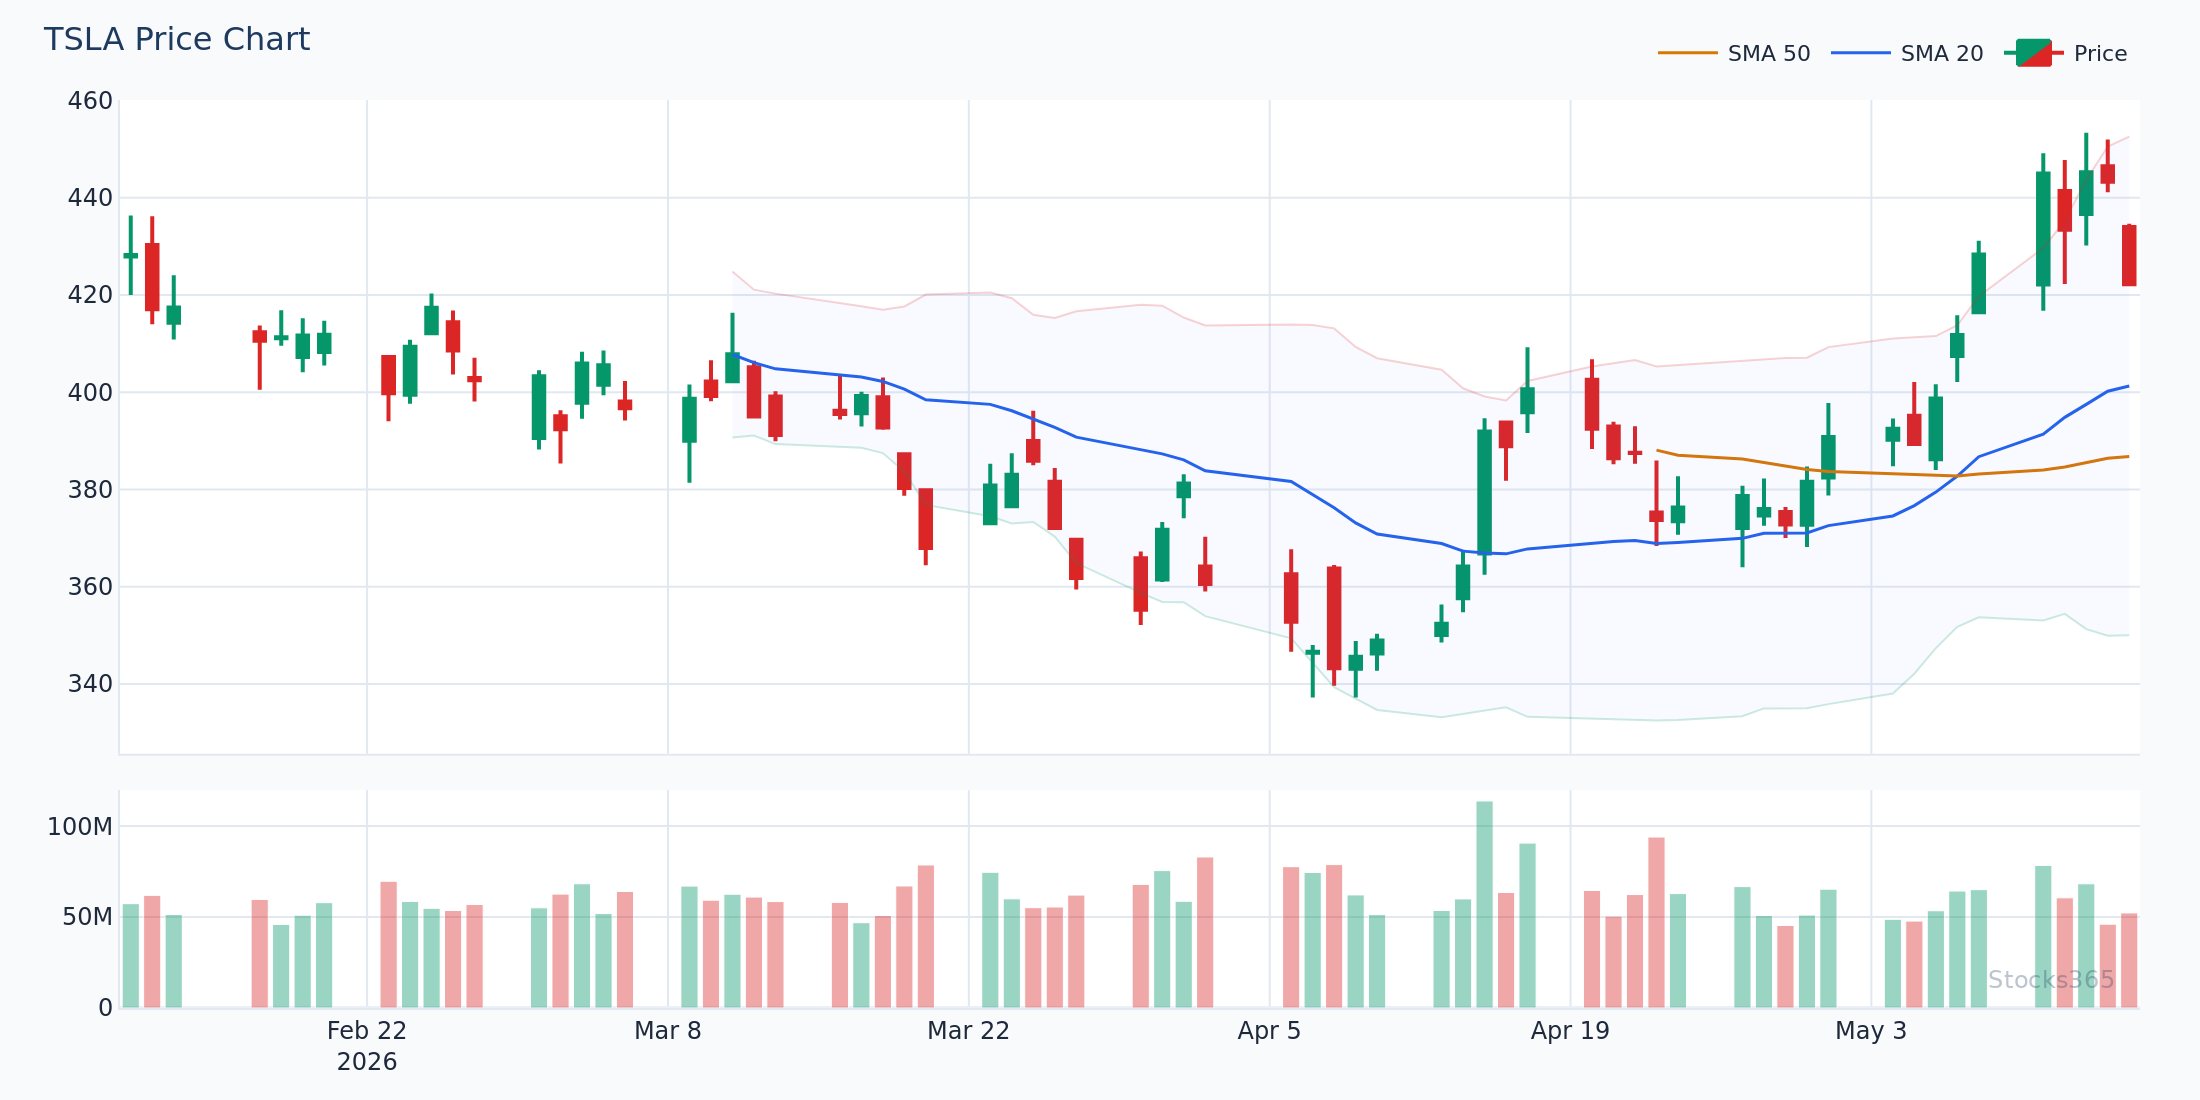
This chart shows price interacting with both the 20-SMA and 50-SMA, with the shorter average beginning to angle upward above the longer one — a classic early-trend alignment setup. When the 20-SMA maintains its position above the 50-SMA while price pulls back to test the 20-SMA as support, that's the high-probability entry zone most plans target. The setup is invalidated if price closes decisively below the 50-SMA on elevated volume.
Step 2 — Establish Your Market Regime Filter
No moving average trading plan works in all conditions. Full stop.
Moving averages are trend-following tools. They perform well in trending markets and produce whipsaws in choppy, range-bound conditions. Before executing any signal, your plan must include a regime filter — a rule that tells you whether the current market environment is favorable.
How to Filter Market Regime
- Price position relative to the 200-SMA: If price is above the 200-SMA, bias your plan toward long setups. Below it, look for shorts or stay flat.
- Moving average slope: A rising 50-SMA confirms an uptrend. A flat or declining 50-SMA signals range or downtrend — reduce position size or skip signals entirely.
- ADX reading: An ADX above 25 indicates a trending market where moving average signals carry more weight. Below 20, moving averages generate noise more than signal.
Regime filtering alone eliminates a large percentage of losing trades. Build it into your rules before you ever look at an entry signal.
Step 3 — Define Entry Rules With Precision
The Entry Trigger vs. The Entry Condition
There's an important distinction here. Your entry condition is the broader context — trend direction, regime, moving average alignment. Your entry trigger is the specific event that causes you to place the trade. Both must be defined.
Example entry condition: Price is above the 50-SMA. The 20-SMA is above the 50-SMA. The 50-SMA is rising. ADX is above 25.
Example entry trigger: Price pulls back to the 20-SMA and forms a bullish candlestick pattern (hammer, engulfing, or inside bar breakout) on above-average volume.
This two-layer approach — condition plus trigger — is what separates disciplined traders from impulsive ones. You don't enter just because conditions are right. You wait for the trigger. Patience is part of the plan.
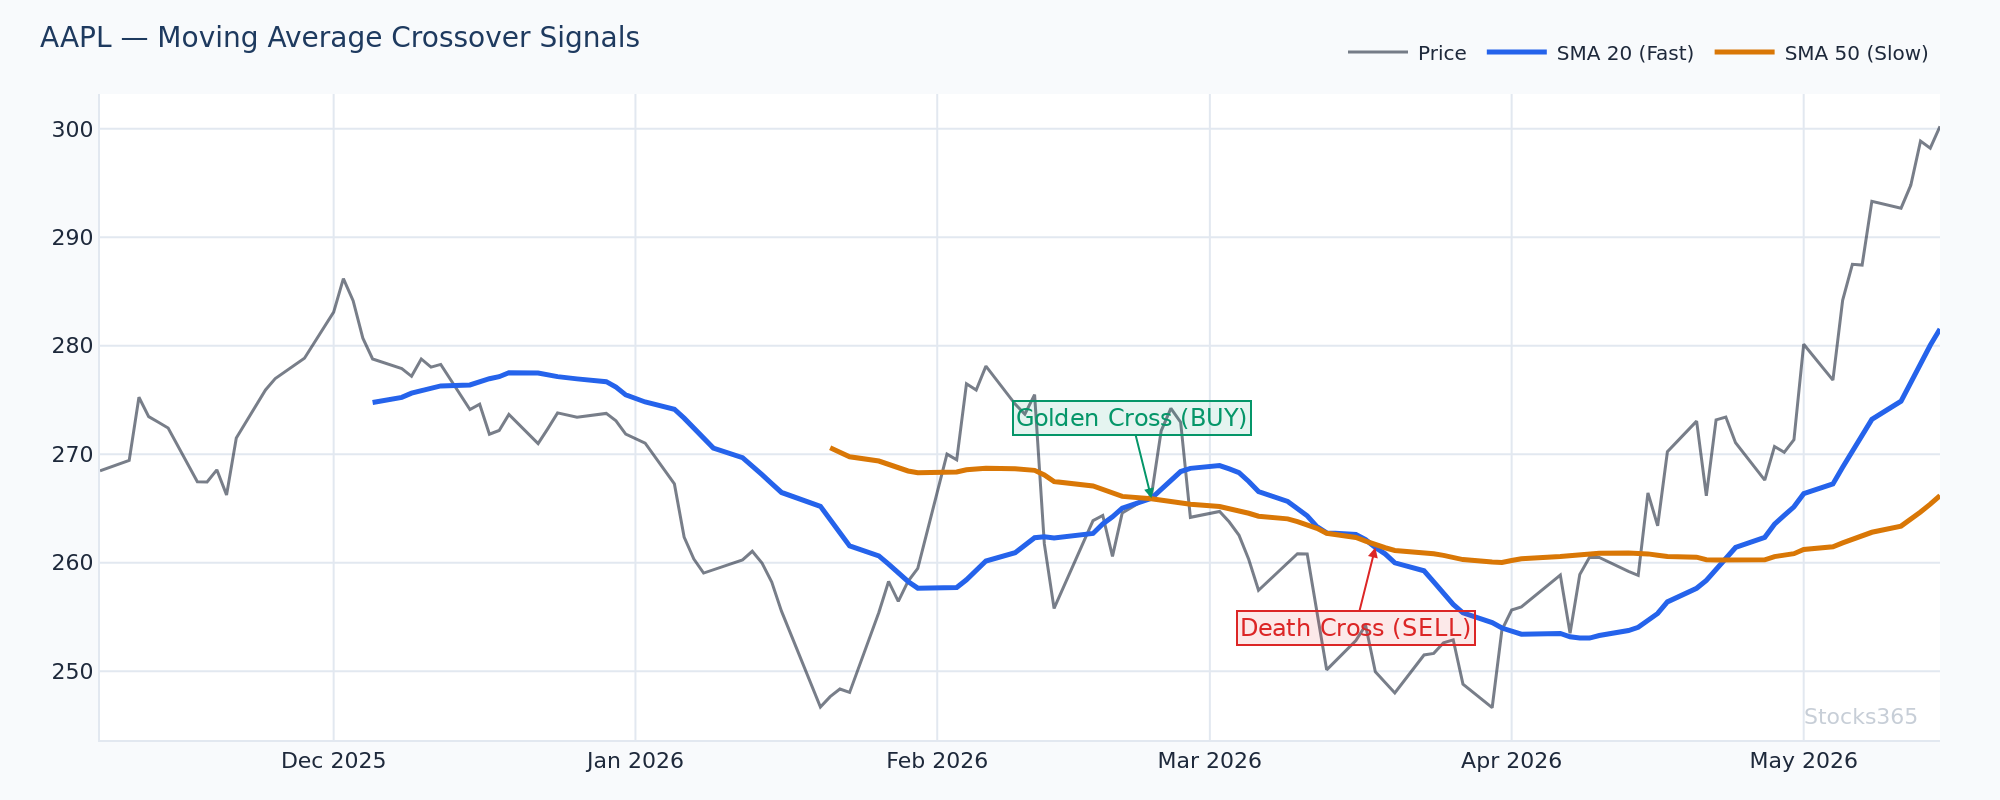
The Moving Average Crossover as Entry Signal
One of the most widely used entry triggers is the moving average crossover. When a faster MA crosses above a slower MA (a "golden cross"), it signals potential bullish momentum. The reverse — a faster MA crossing below a slower MA (a "death cross") — signals bearish momentum. For a thorough breakdown of crossover mechanics, risk, and practical setups, the Moving Average Crossover Strategy: Complete Trading Guide is an essential resource.
Here, price pulls back from a recent high to retest the rising 20-SMA — the classic "buy the dip into the trend" entry setup. The candle structure at the retest point matters enormously: a bullish engulfing or hammer with a volume spike above the 20-day average volume confirms buyer interest at the level. If price instead closes below the 20-SMA with expanding bearish candles, the pullback has become a breakdown and the setup is void.
Step 4 — Adding Confluence: Don't Trade Moving Averages Alone
Moving averages are stronger with confirmation. Period.
The most robust moving average trading plans layer in at least one additional indicator to confirm entry signals. This reduces false signals and increases the probability per trade — even if it means taking fewer trades overall. Fewer, higher-quality trades is always better than frequent, low-conviction ones.
RSI as Moving Average Confirmation
RSI is a natural complement to moving average entries. When price pulls back to the 20-SMA in an uptrend, check whether RSI simultaneously dips toward or below 40 without fully breaking down. That RSI pullback confirms the price pullback is corrective rather than a trend reversal. For a foundational understanding of how RSI works, What Is RSI? The Complete Beginner's Guide covers the essential mechanics.
RSI divergence adds another layer. If price makes a lower low during a pullback but RSI makes a higher low, bullish divergence suggests the downside momentum is weakening — a strong additional signal for a moving average bounce entry. The RSI Divergence Explained: Master Bullish & Bearish Signals guide covers this confluence setup in depth.
MACD for Trend Momentum Confirmation
MACD histogram direction provides momentum context that raw moving averages miss. If price crosses above the 20-SMA and MACD histogram is rising (or turning from negative to positive), that confluence strengthens the bull case. For currency pair traders, the MACD in Forex Trading: Master Currency Pair Strategies article shows how this combination applies across different markets.
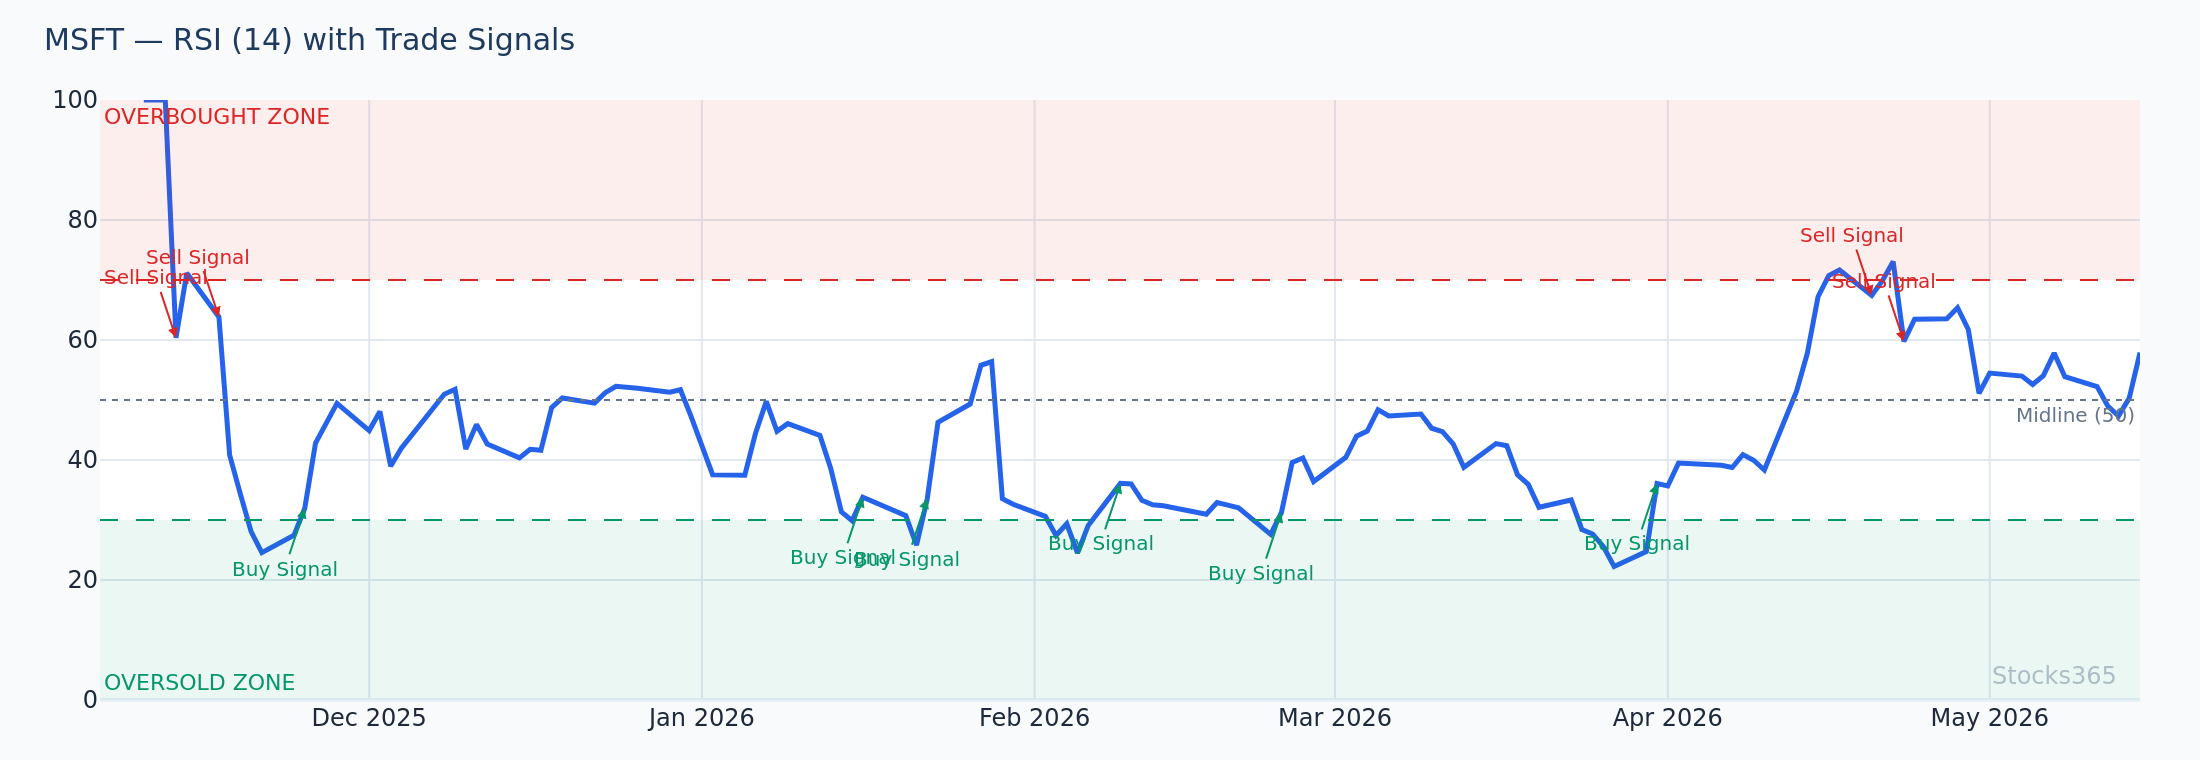
This RSI chart shows momentum dipping toward the 40 level while price simultaneously tests the 20-SMA from above — classic confluence for a pullback-to-trend entry. When RSI holds above 40 and turns back up as price reclaims the 20-SMA, it confirms the trend remains healthy and buyers are re-engaging. If RSI instead breaks below 40 and continues lower, the move is likely more than a simple correction.
Step 5 — Risk Management Rules That Can't Be Skipped
A moving average trading plan without defined risk management isn't a plan. It's a wish.
Stop Loss Placement
Your stop loss in a moving average plan should be placed at a level that definitively invalidates the setup — not based on a fixed percentage.
- For pullback-to-MA entries: Place the stop below the moving average level plus 0.5–1x ATR to avoid getting stopped by normal volatility.
- For crossover entries: Place the stop below the most recent swing low that preceded the crossover.
- Hard rule: If price closes below the 50-SMA in a long setup, the structural trend assumption is broken. Exit.
Position Sizing Based on Risk
Risk a fixed percentage of your trading capital per trade — typically 1–2%. Calculate your position size based on the distance between your entry and your stop loss. This means position sizes vary by setup, not by conviction. Your conviction doesn't determine risk. The chart does.
This is non-negotiable. Scale it down if needed, but never skip it.
Step 6 — Exit Strategy: Taking Profits Systematically
Target-Based Exits vs. Trailing Exits
Two primary exit approaches work well with moving average plans:
- Fixed reward-to-risk targets: Take partial profits at 1.5R–2R and move your stop to breakeven. Let the remainder run with a trailing stop.
- Moving average trailing stop: Trail your stop to the most recent close below the 20-SMA (for shorter-term trades) or 50-SMA (for medium-term). Exit when price closes below the trailing MA.
Combining both approaches is effective: take a partial position off at a fixed target, then trail the rest behind the moving average to capture larger trend moves when they develop.
When to Exit Early
Price closes decisively below the key moving average on high volume. RSI breaks below a critical level and diverges from price. The moving averages flatten and begin converging. These are your early exit signals — price telling you the thesis has changed before your stop is hit.
When This Plan Works — and When It Doesn't
Asset class context matters dramatically for any moving average trading plan. Our analysis of 3,332 signals from the Price Crosses Below SMA 20 setup found a 66.8% win rate in crypto — but only 42.5% in forex. The same setup, the same rules, very different outcomes depending on the market. Visit our research dashboard to explore how these performance differentials break down across asset classes and timeframes.
Why such variance? Forex markets are heavily influenced by macro events, central bank policy, and sentiment shifts that override technical setups. Crypto, particularly in trending regimes, exhibits strong momentum persistence — making trend-following approaches like moving average plans more effective. Stocks fall in the middle, performing best in broad uptrends and poorly in volatile, news-driven environments.
Build your plan around an asset class where moving average signals have historically shown edge. Don't force the strategy onto every market just because you want to trade it.
This setup shows the 20-SMA and 50-SMA in clear bullish alignment — both rising, with price trading above both averages — and a consolidation flag forming just above the 20-SMA. A breakout from the flag's upper boundary on expanding volume is the entry trigger; the prior swing low and the 50-SMA together form a logical stop zone below. The setup fails if price reverses back through the flag and closes below the 20-SMA before the breakout occurs.
Backtesting and Refining Your Moving Average Trading Plan
Build it. Test it. Refine it. In that order.
Backtesting validates whether your specific rules produce a positive expectancy over a meaningful sample of historical trades. It also reveals the strategy's worst drawdown periods — which you must be psychologically prepared to endure before live trading. A plan you abandon during the first losing streak is useless.
What to Track During Backtesting
- Win rate and average win vs. average loss
- Maximum consecutive losing trades
- Performance across different market conditions (trending vs. ranging)
- Asset class performance variance
- Average holding period and whether it matches your lifestyle
Stocks365's signals dashboard provides live signal data and performance tracking that complements your own backtesting process — letting you see how current setups align with historical performance patterns.
Executing the Plan: The Psychology of Consistency
Execution is where most plans die. Not because the strategy was wrong. Because the trader deviated.
You'll have losing streaks. The moving averages will generate false signals. Price will stop you out and then reverse in your original direction. This is unavoidable. What's avoidable is abandoning the plan during those periods. A statistically valid trading plan with a positive expectancy only delivers its edge over a large sample of trades — consistently executed. Cherry-picking signals, overriding stops, doubling down on losers — these destroy the edge that the plan was built to capture.
Write your rules down. Follow them. Review monthly. Adjust with evidence, not emotion.
What to Watch For
- Triple MA alignment in trending stocks: When the 10-SMA, 20-SMA, and 50-SMA are stacked in bullish order and all rising, pullbacks to the 20-SMA represent high-probability continuation entries — especially when accompanied by declining volume on the pullback and RSI holding above 40.
- MA crossover setups after multi-week consolidation: When the 20-SMA and 50-SMA converge tightly during a consolidation period and then diverge with a crossover, the resulting directional move tends to be stronger and more sustained than crossovers that occur in actively trending markets.
- Price reclaiming the 200-SMA after an extended downtrend: When price crosses back above the 200-SMA and the 20-SMA begins curling upward above it, this regime shift often marks the beginning of a multi-week trend recovery — especially in large-cap stocks and major crypto assets.
- RSI trendline breaks coinciding with MA tests: When price tests a key moving average and RSI simultaneously breaks a downward trendline drawn across recent highs, the confluence signals strong momentum reversal. The RSI Trendline Strategy guide details exactly how to draw and trade these lines.
- Hidden RSI divergence at MA support in uptrends: During pullbacks to the 20-SMA or 50-SMA in established uptrends, hidden bullish RSI divergence (higher low in RSI during a lower low in price) is a powerful confirmation that the trend is resuming. The Hidden RSI Divergence guide covers this advanced setup in detail.
Key Takeaways
Moving Average Trading Plan — Summary
- A moving average is a filter, not a standalone signal. Build a plan around it.
- Always define your market regime before evaluating any entry signal.
- Use a two-layer entry approach: condition (trend alignment) + trigger (specific price action).
- Confirm moving average signals with RSI, MACD, or volume — never trade in isolation.
- Stop losses belong at levels that structurally invalidate the setup, not at fixed percentages.
- Asset class matters: moving average plans perform differently across stocks, crypto, and forex.
- Consistency of execution over a large sample is what turns a positive-expectancy plan into realized profits.
How Stocks365 Uses This
How Stocks365 Integrates Moving Averages Into Its Trust Score SystemMoving average alignment is one of 12+ technical indicators that feed into the Stocks365 Trust Score — a composite signal quality rating assigned to every signal on the platform. Specifically, the relationship between short-term and medium-term moving averages contributes to the trend regime component of the Trust Score, helping quantify whether a signal is appearing in a favorable or unfavorable trend context.
When the 20-SMA and 50-SMA are in bullish alignment and rising, the Trust Score trend component increases — adding weight to long signals generated in that environment. When moving averages are flat or negatively stacked, the trend component reduces signal confidence regardless of what other indicators show. This systematic approach ensures that moving average context is never ignored, even when other signals appear strong.
You can see Trust Scores in action on any individual signal page — for example, the AAPL signal page shows how moving average alignment currently contributes to overall signal confidence.