
Why Most Moving Average RSI Strategies Fail Before They Start
Two of the most widely used indicators in technical analysis. One measures trend. One measures momentum. Together, they should be unstoppable — yet most traders using a moving average RSI strategy walk away with inconsistent results and zero confidence in their signals.
The problem isn't the indicators. The problem is how traders combine them.
Stocks365 backtested 2,153 RSI Oversold Bounce signals across multiple asset classes and found a 56.9% win rate with a profit factor of 1.61 over a 10-day holding period — but only when the signal aligned with a broader trend confirmed by a moving average. Strip that confirmation away, and you're trading noise. That distinction matters enormously.
This guide breaks down exactly how to combine these two indicators correctly, when the setup works, when it fails, and what the data actually shows about each asset class.
Understanding the Two Indicators Before Combining Them
Before stacking indicators, you need to know what each one actually tells you — and what it doesn't.
What Moving Averages Actually Measure
A moving average smooths price action over a defined period, revealing the underlying direction of the trend. The 20-period SMA (Simple Moving Average) is the most common short-term benchmark. The 50 SMA and 200 SMA define medium and long-term trends respectively.
Moving averages are lagging indicators. They confirm what has already happened. They do not predict reversals — they define context. When price trades above the 200 SMA, you're in a long-term uptrend. When it trades below, you're not. Simple. Powerful. Often ignored.
What RSI Actually Measures
The Relative Strength Index (RSI) measures the speed and magnitude of recent price changes, producing a value between 0 and 100. Traditional thresholds sit at 70 (overbought) and 30 (oversold). But RSI is far more nuanced than those two numbers suggest.
RSI is a momentum oscillator. It tells you how strong the current move is relative to recent history. For a deeper foundation on how RSI works mechanically, start with What Is RSI? The Complete Beginner's Guide. If you want to optimize the settings for your specific timeframe and asset class, RSI Settings: Master the Best Period for Your Strategy covers exactly that.
The Core Moving Average RSI Strategy: How It Works
The cleanest version of this combined strategy uses three components: a trend filter (typically the 50 or 200 SMA), a short-term dynamic level (the 20 SMA), and RSI as a momentum trigger.
Here's the structure:
- Trend filter: Price must be above the 50 SMA (for long trades) or below it (for short trades)
- Pullback trigger: Price pulls back toward or below the 20 SMA within that trend
- RSI confirmation: RSI drops into the 30–45 zone during the pullback (oversold or approaching it)
- Entry signal: Price reclaims the 20 SMA and RSI turns back upward — momentum confirming trend resumption
The logic is clean. The trend tells you which direction to trade. The 20 SMA identifies a structured pullback. RSI confirms that momentum is shifting back in the trend's direction. You're not guessing reversals. You're joining a trend after a controlled correction.
This chart shows price pulling back to the 20 SMA while RSI drops toward the 40–45 zone before bouncing. When price reclaims the 20 SMA and RSI crosses back above 50, the long setup triggers. If RSI continues declining below 30 and price closes decisively below the 50 SMA, the pullback has extended into a potential trend break — invalidating the trade.
Here's What Most Traders Get Wrong
Most traders use RSI oversold as an entry signal in isolation. RSI drops below 30, and they buy. No trend context. No moving average confirmation. No structure at all.
In a downtrending market — where price sits below both the 20 and 50 SMA — RSI can reach 25, bounce to 40, then collapse to 18. An oversold reading in a bear trend is not a signal. It's a warning. The moving average is what separates a high-probability bounce from catching a falling knife. RSI below 30 in an uptrend, with price near the 20 SMA and the 50 SMA intact below, is a completely different animal.
Context transforms the signal. Always.
The Four Configurations That Actually Work
1. Trend-Pullback-Reclaim (Highest Probability)
Price trends above the 50 SMA. It pulls back, touches or dips briefly below the 20 SMA. RSI reaches the 35–45 zone. Price then closes back above the 20 SMA with RSI turning upward. Enter on the reclaim candle's close or the next open.
This is the bread-and-butter setup. It works best on stocks in established uptrends — our backtested data shows RSI Oversold Bounce signals in stocks carry a 62.9% win rate, the strongest asset class in the study.
Here RSI drops into the 35–42 range while price holds above the 50 SMA — a controlled pullback within a healthy trend. The confirmation arrives when RSI crosses back above 50, signaling renewed upside momentum. If RSI rolls over below 50 and price breaks the 50 SMA, the setup is dead — move on.
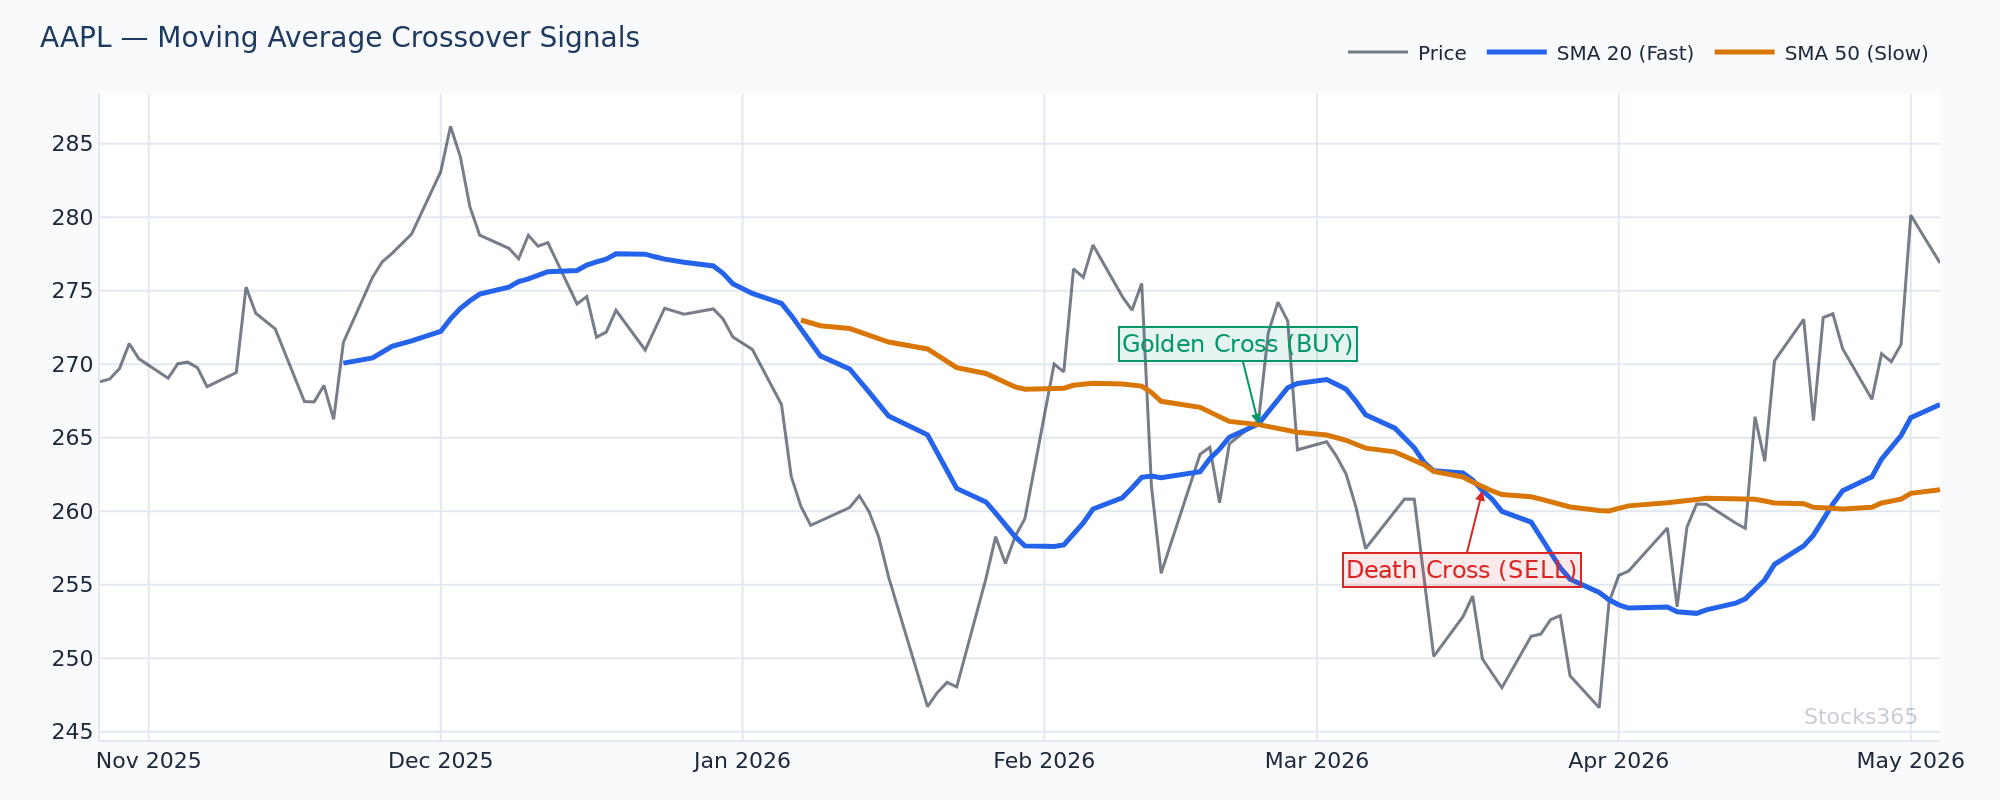
2. SMA Cross Confirmation
When the 20 SMA crosses above the 50 SMA (a "golden cross" on shorter timeframes), pair this with RSI holding above 50. This confirms both trend alignment and sustained momentum. The cross alone is a lagging signal — RSI above 50 tightens the entry timing.
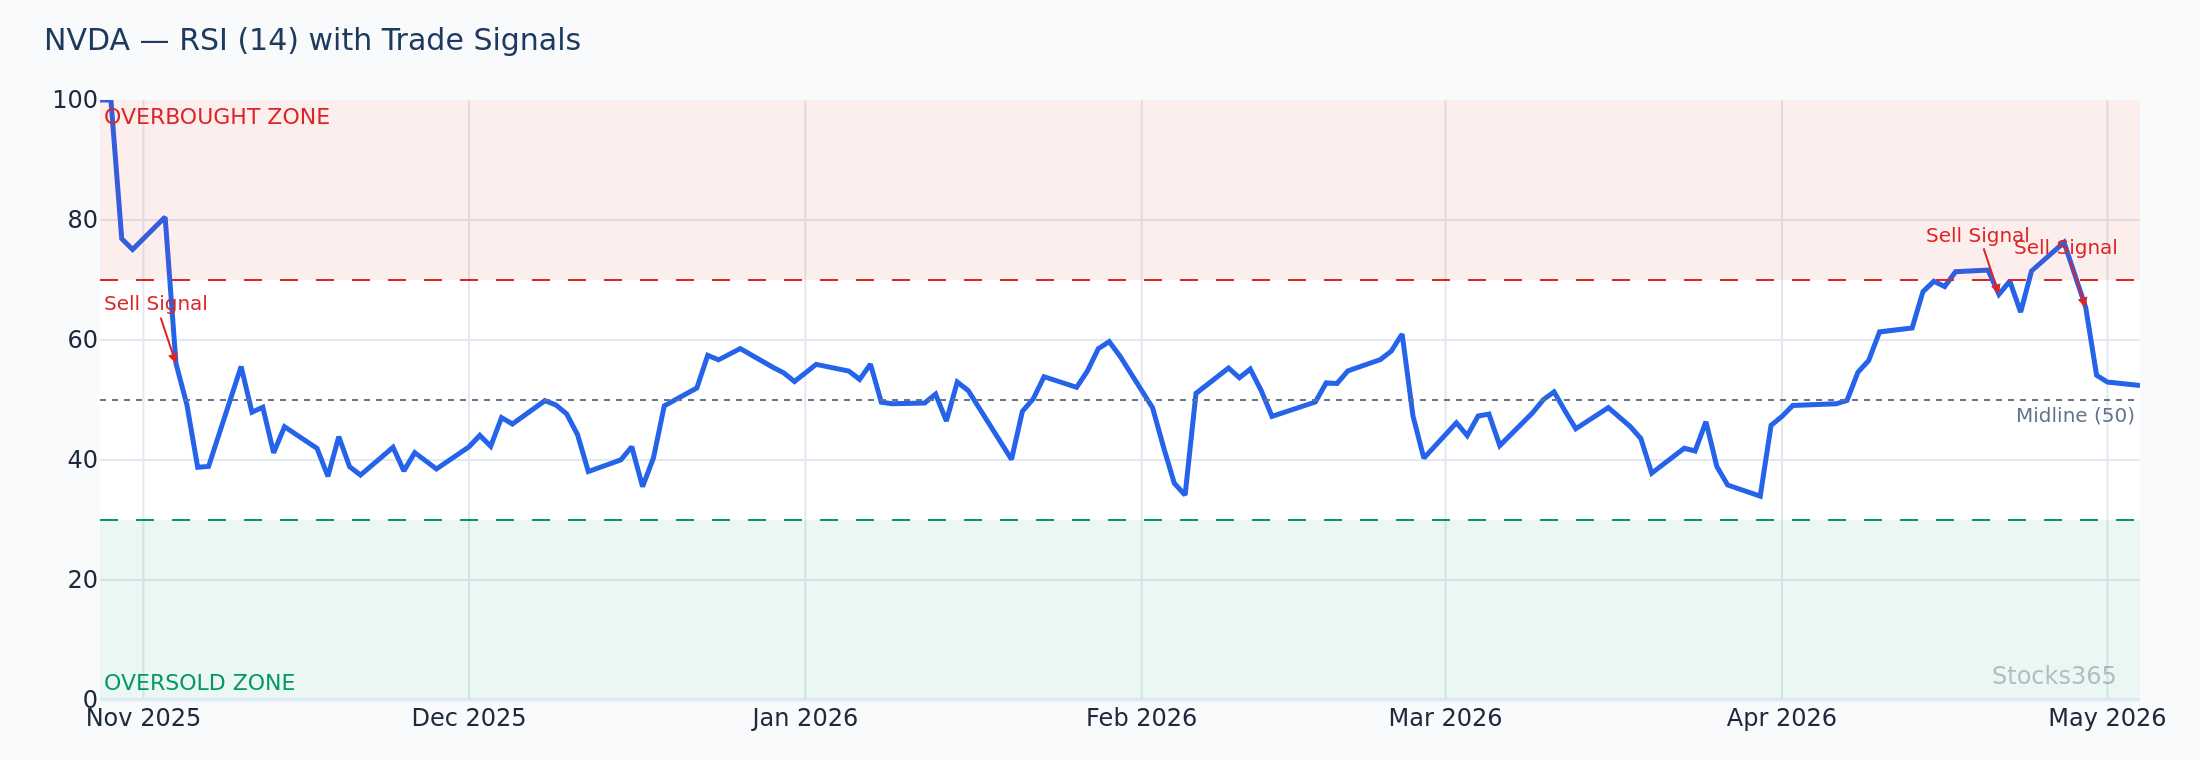
3. RSI Midline Rejection
In a downtrend (price below the 50 SMA), RSI bounces from oversold territory but fails to break above 50. It stalls at 48–52 and turns back down. That midline rejection confirms the trend is intact. Short traders use this as an entry trigger, with the 20 SMA acting as dynamic resistance above price.
4. Double Confirmation on Higher Timeframes
Take the weekly chart. Check trend direction using the 20 and 50 SMA. Then drop to the daily chart and look for RSI pullbacks into the 40–50 zone. When the weekly trend and daily RSI momentum align, win rates climb noticeably. Multi-timeframe confluence is one of the most underused edges in technical analysis.
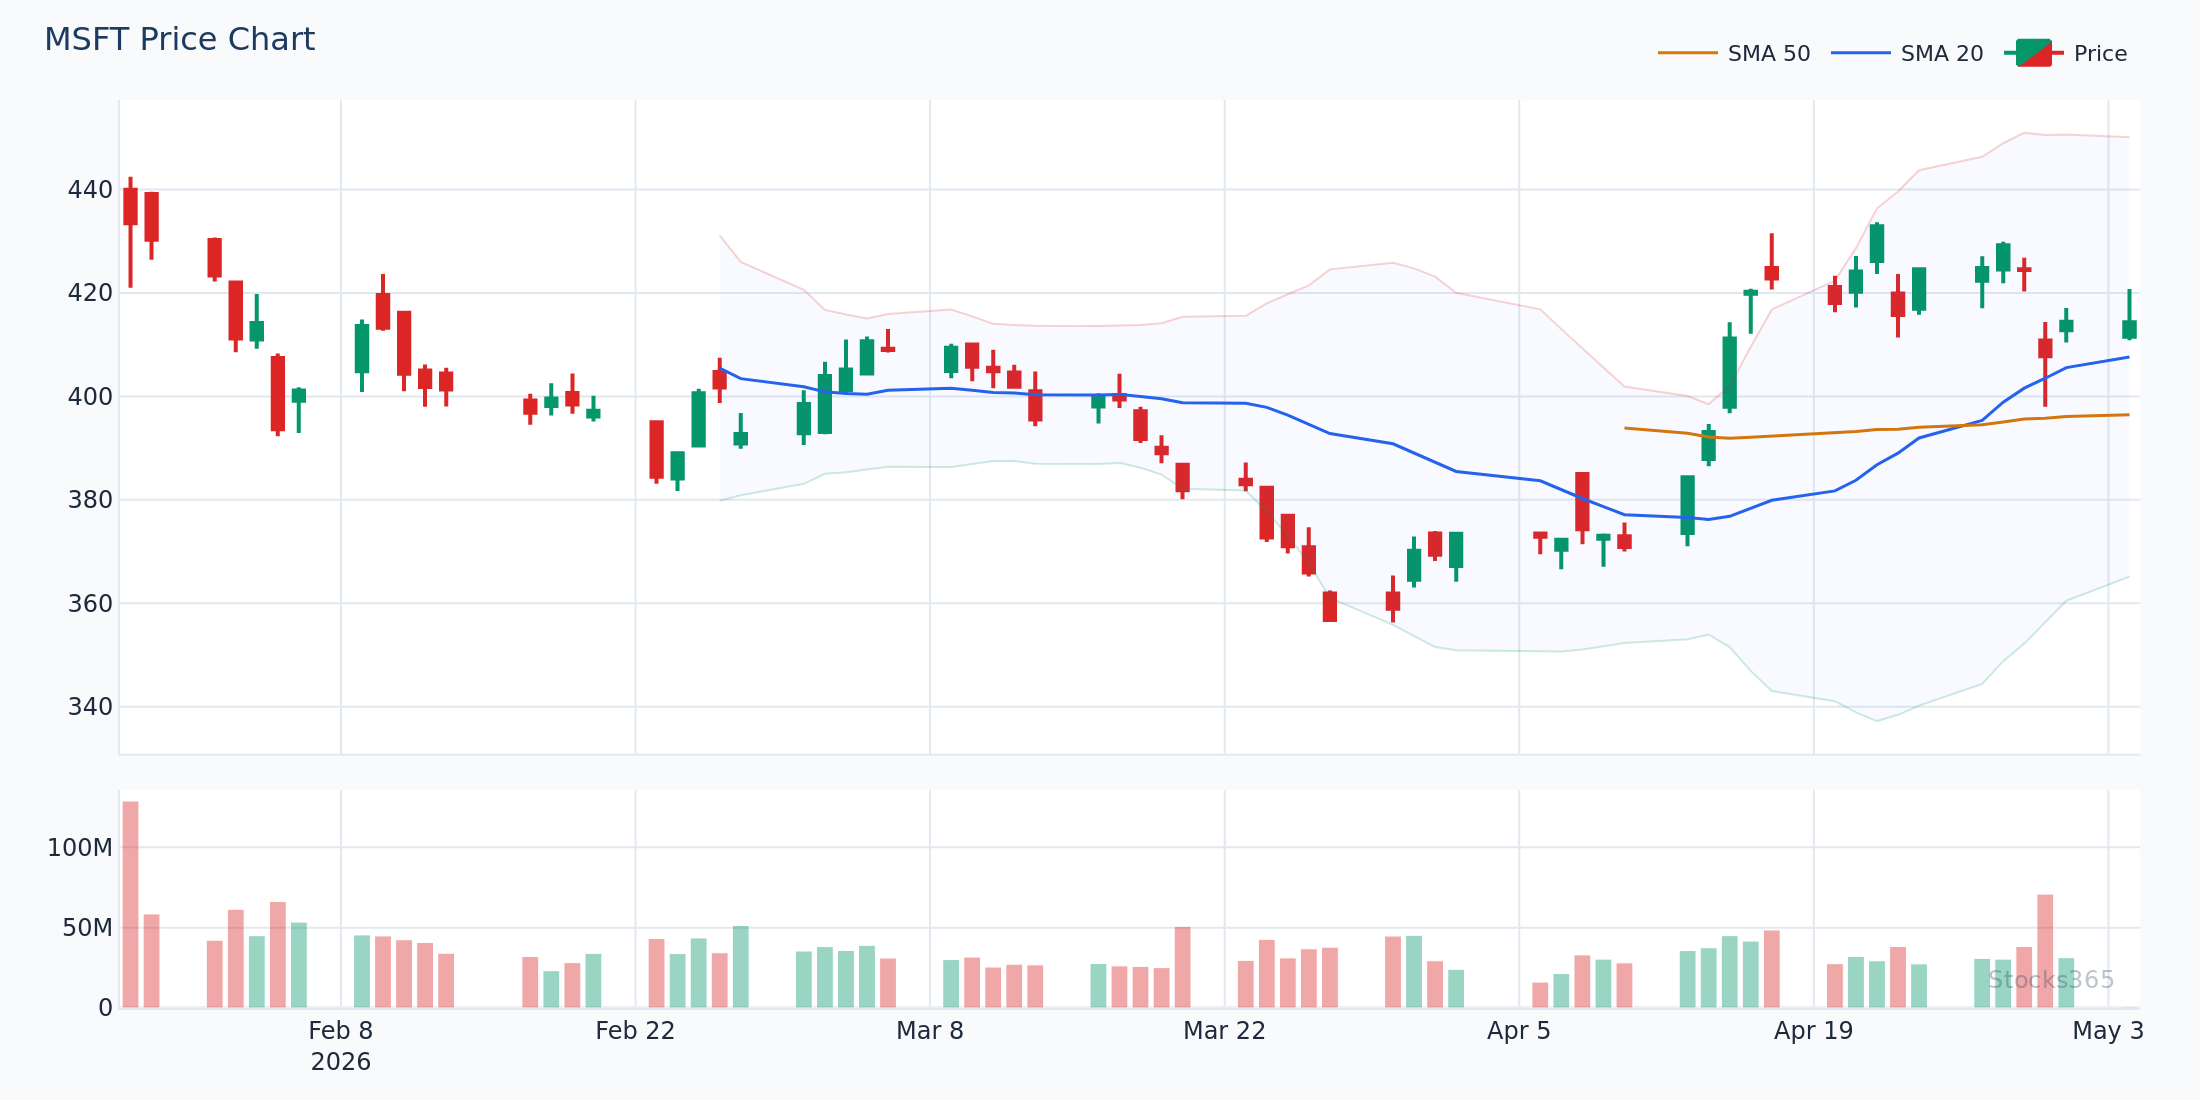
This daily view shows price above both the 20 and 50 SMA — consistent with a weekly uptrend. RSI holds above 50 throughout, never threatening oversold territory, confirming sustained momentum. A close below the 50 SMA accompanied by RSI dropping under 45 would be the first signal that trend structure is weakening.
When the Moving Average RSI Strategy Fails
No strategy works everywhere. Knowing the failure conditions is as important as knowing the entry rules.
Our analysis of research dashboard data shows this clearly: the RSI Oversold Bounce setup carries a 62.9% win rate in stocks but drops to 43.5% in commodities. The same signal, completely different outcomes by asset class. Why?
Commodities are structurally different. Supply shocks, geopolitical events, and seasonal patterns create trend disruptions that RSI cannot anticipate and moving averages are too slow to filter. The indicator combination designed for trend-following simply doesn't map cleanly onto commodity dynamics.
The setup also degrades in:
- Choppy, range-bound markets: When price oscillates between the 20 and 50 SMA repeatedly, you get false signal after false signal. Moving averages flatten. RSI whipsaws between 40 and 60. Avoid the setup until a clear trend re-establishes.
- High-volatility events: Earnings releases, central bank decisions, macro data surprises. RSI can spike from 45 to 78 in a single candle. The indicator hasn't failed — the event-driven environment broke the statistical assumptions the indicator was built on.
- Crypto in bear phases: The Price Crosses Below SMA 20 signal across 3,332 signals shows a 42.5% win rate in forex — but crypto in bear phases creates similar traps. Oversold signals in structural downtrends are traps, not opportunities.
Notice how both the 20 and 50 SMA run nearly horizontal while RSI oscillates without direction. This is the classic chop environment — moving averages provide no trend context, and RSI oscillates without conviction. The pattern to wait for: a decisive close above or below both SMAs with RSI breaking above 60 or below 40 for the first time in multiple sessions.
RSI Divergence: The Add-On Signal That Sharpens Entries
When you layer RSI divergence onto a moving average setup, the signal quality improves significantly. Bullish divergence — where price makes a lower low but RSI makes a higher low — near a key moving average (particularly the 50 SMA) creates a powerful confluence setup.
Price is trying to go lower. RSI is disagreeing. The trend support is holding. That three-way confluence rarely produces nothing.
For a complete breakdown of how to read and trade divergence, RSI Divergence Explained: Master Bullish & Bearish Signals covers both the classic and hidden variations. And if you want to go deeper, Hidden RSI Divergence: The Advanced Signal Most Traders Miss explores the continuation version that most traders completely overlook.
Practical Entry and Exit Framework
Entry Checklist
Before entering any trade using a moving average RSI strategy, run through this checklist:
- Is the primary trend defined? (Price above or below 50 SMA)
- Has price pulled back to the 20 SMA within that trend?
- Is RSI in the 30–50 zone for long setups, or 50–70 for short setups at the pullback low/high?
- Is RSI turning in the direction of the trade?
- Does volume confirm the move? (Look for volume expanding as price reclaims the 20 SMA)
Exit Logic
Exits are where most traders lose money they've correctly made on entry. Three clean exit approaches:
- Trail stop below the 20 SMA: As long as price holds above the 20 SMA on closes, stay in. A daily close below it is your exit trigger.
- RSI overbought exit: When RSI crosses above 70 and then breaks back below 70, take partial profits or full exit. For a complete breakdown of how to use these levels, see RSI Overbought and Oversold Levels: Master the Signals.
- Fixed time-based exit: The backtested data uses a 10-day holding period — a reasonable benchmark for swing traders if neither of the above triggers first.
Combining RSI Trendlines with Moving Averages
One underutilized technique: drawing trendlines on RSI itself, then using moving averages for price context. When RSI breaks a descending trendline while price simultaneously reclaims the 20 SMA, you get a highly specific trigger with structural backing.
This technique is covered in depth at RSI Trendline Strategy: Master Drawing Lines for Better Signals. It pairs naturally with everything covered in this guide.
Precision matters more than prediction. The cleaner your trigger, the tighter your stop.
Applying This to Forex: Important Differences
Forex deserves its own note. The Price Crosses Below SMA 20 signal carries only a 42.5% win rate in forex — the worst performing asset class in that study. Forex pairs trend differently than equities. News-driven volatility, carry dynamics, and 24-hour liquidity create conditions where moving average crossovers generate excessive false signals.
In forex, the RSI strategy works better when applied to RSI levels rather than crossovers. Wait for RSI to reach extreme territory (below 30 or above 70) and then confirm with a moving average trend filter rather than a crossover trigger. For currency-specific applications, MACD in Forex Trading: Master Currency Pair Strategies shows how momentum indicators adapt to the forex environment — principles that apply directly to RSI-based approaches too.
What to Watch For
- Pullbacks to the 50 SMA with RSI in the 40–50 zone on large-cap stocks: When an established uptrending stock pulls back to the 50 SMA and RSI holds above 40 without reaching oversold, it signals trend resilience. The bounce from this zone, confirmed by RSI crossing back above 55, has historically been one of the cleanest long setups available.
- SMA compression setups: When the 20 SMA and 50 SMA converge within a narrow range, a directional break is imminent. Whichever way price breaks — confirmed by RSI either surging above 60 or collapsing below 40 — often initiates a sustained trend move worth trading.
- RSI divergence at the 20 SMA on daily charts: When price makes a lower low at the 20 SMA but RSI makes a higher low, the divergence signals weakening selling pressure at a natural support zone. Volume confirmation on the bounce adds high-quality additional validation.
- Failed breakdown below the 50 SMA with RSI reclaiming 50: Price briefly breaks below the 50 SMA, sellers fail to extend the move, price reclaims it within 1–2 sessions, and RSI crosses back above 50. This pattern — common on institutional-grade stocks — often precedes sharp trend resumption moves.
- Crypto-specific caution — avoid RSI oversold signals below the 200 SMA: In crypto, when price sits below the 200 SMA, RSI oversold readings have historically resolved with continued downside rather than meaningful bounces. Reserve bullish RSI setups in crypto for above-200-SMA environments.
How Stocks365 Uses This
How Stocks365 Integrates Moving Averages and RSI
Stocks365's trust score system evaluates over 12 technical and quantitative indicators simultaneously, and the moving average RSI relationship is one of the core inputs. When a signal appears on the signals dashboard, the trust score reflects both trend alignment (via SMA positioning) and momentum state (via RSI), contributing to the overall agreement score across indicators.
A signal with price above the 50 SMA and RSI recovering from below 40 receives stronger agreement weighting than an isolated RSI crossover with no trend context. Conversely, signals where RSI and moving average direction conflict — RSI bullish but price below all key SMAs — receive lower trust scores, flagging the disagreement explicitly.
When you view individual signals like AAPL's signal page, the trust score breakdown shows exactly how each indicator contributes, including the SMA-RSI relationship. This makes it transparent, not a black box — you see what's driving the score and why.
Key Takeaways
Summary: Moving Average RSI Strategy
- Use moving averages for trend direction and context — never trade RSI in isolation without knowing the trend
- The 50 SMA is your primary trend filter; the 20 SMA identifies structured pullback entry zones
- RSI works as a momentum trigger, not a standalone signal — it confirms trend resumption, not reversal
- Stocks365's backtested data (n=2,153 signals) shows RSI Oversold Bounce produces a 56.9% win rate — rising to 62.9% in stocks when combined with trend context
- The setup degrades in choppy markets, commodity environments, and during high-impact news events
- RSI divergence near key SMAs creates high-quality confluence setups worth prioritizing
- Multi-timeframe confirmation — weekly trend direction, daily RSI entry timing — is an underused edge
- Exit using 20 SMA trail stops or RSI overbought breakdown, not arbitrary price targets