
Moving Averages in Stock Screening: How to Find Trade Setups That Actually Work
Most traders scan hundreds of charts and still miss the best setups. A moving average stock screener changes that. It cuts through the noise, surfaces the stocks that are setting up, and lets you focus on execution rather than hunting.
But a screener is only as good as the logic behind it.
Our analysis of over 6,600 signals across equities, crypto, and forex reveals exactly which moving average setups carry genuine edge — and which ones are statistical noise dressed up as strategy. This article breaks down how to build and use a moving average stock screener the right way, with the setups that have the highest probability of working in current market conditions.
What Is a Moving Average Stock Screener?
A moving average stock screener is a filtering tool that scans a universe of securities and returns only those that meet specific moving average conditions. Instead of manually reviewing thousands of charts, you define rules — price crosses above the 50-day SMA, the 20-day EMA turns upward, price reclaims the 200-day MA — and the screener does the hunting for you.
The most commonly screened moving average events include:
- Price crossing above or below a key MA (most widely used trigger)
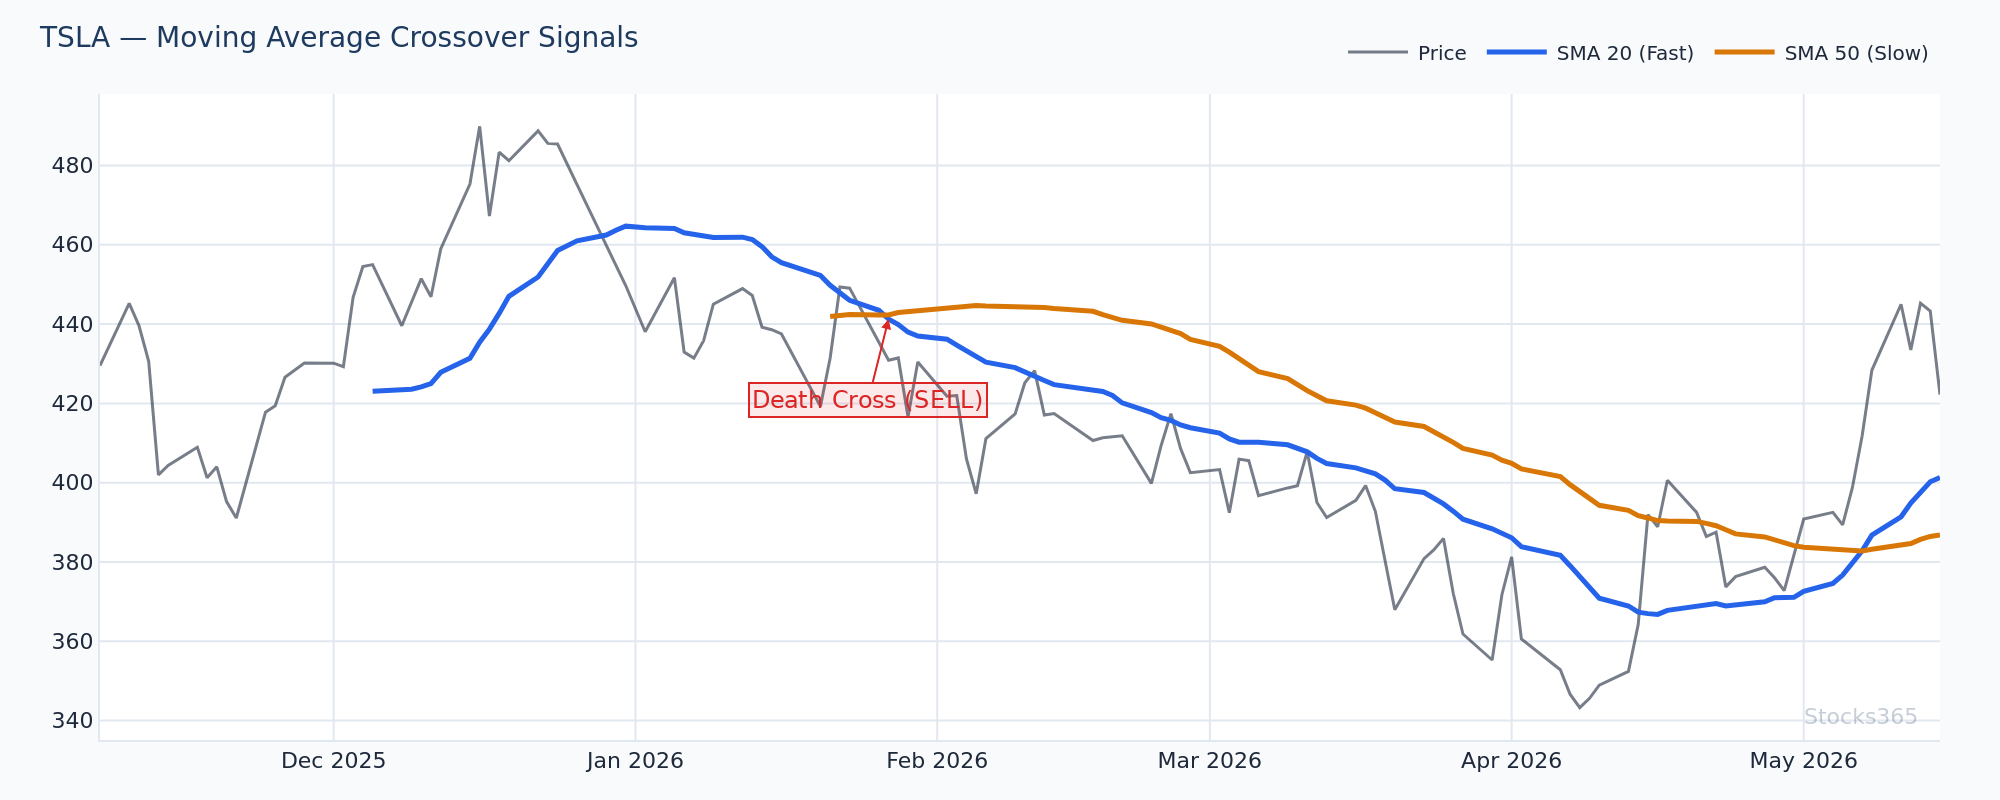
- Short-term MA crossing a long-term MA (the classic golden/death cross)
- Price distance from a moving average (mean reversion setups)
- MA slope change (trend initiation signals)
- MA stacking (20 above 50 above 200, confirming trend alignment)
Each of these triggers a different type of trade. Understanding which trigger matches which market condition is where most traders get it wrong.
The Core Moving Averages Every Screener Should Include
The 20-Period SMA: Momentum and Mean Reversion
The 20-period SMA is the most reactive of the major moving averages. It tracks short-term momentum, making it the go-to filter for swing traders and momentum players. When price rides above the 20-SMA in a clean uptrend, pullbacks to the MA are buying opportunities. When price breaks below it cleanly, the trend has shifted short-term.
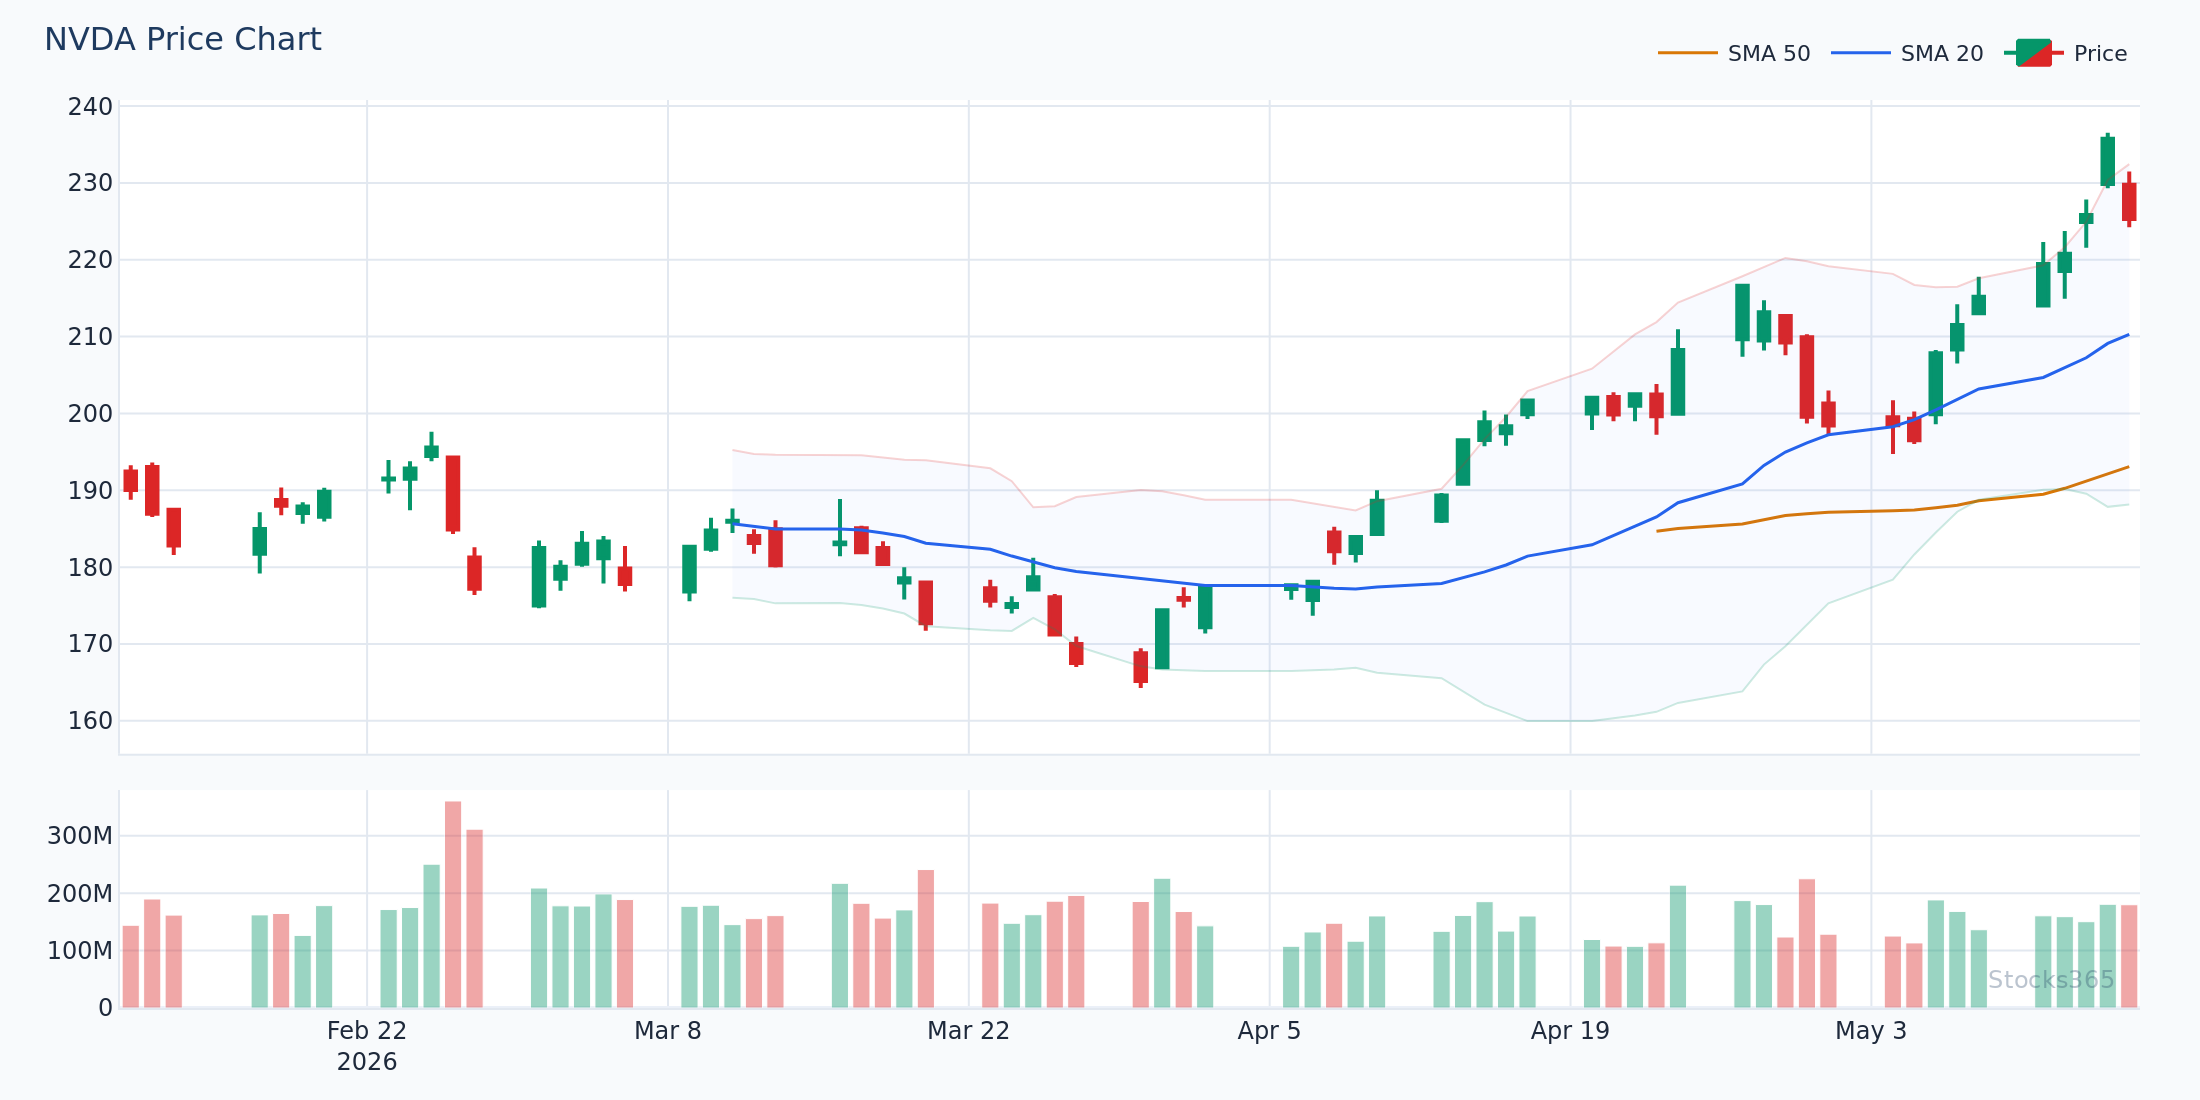
Stocks365 backtested 3,289 signals where price crossed above the SMA 20 and found a 48.3% win rate over a 10-day holding period, with a profit factor of 0.88. That's a below-breakeven result on its own. Here's the lesson: a crossover above the 20-SMA in isolation is not a buy signal. It's a filter. You need confluence.
This chart shows a classic price-crosses-above-20-SMA event. Notice that the crossover alone doesn't tell you much — what matters is whether volume confirms the move and whether the broader trend (50-SMA, 200-SMA) is aligned. Without that confirmation, the signal flips back below the MA frequently. The setup is invalidated if price closes back below the 20-SMA on above-average volume within two sessions.
The 50-Period SMA: The Institutional Benchmark
The 50-SMA is where institutional money pays attention. Large funds use it as a benchmark for trend health. When a stock reclaims its 50-SMA after a correction, that's the setup that often precedes the next leg higher. When it loses the 50-SMA on heavy volume, institutions are frequently reducing exposure.
Screening for stocks where the 50-SMA is beginning to slope upward — after a prolonged flat or declining phase — catches early-stage trend resumptions before they become obvious to the crowd.
The 200-Period SMA: The Trend Dividing Line
Everything above the 200-SMA is bull territory. Everything below is bear territory. It's that simple. Use the 200-SMA in your screener as a regime filter — not as a signal in itself, but as a condition that must be true before other signals fire.
Want only bullish setups? Add "price above 200-SMA" as a hard filter. This one rule eliminates a huge percentage of false signals generated by the shorter-period MAs.
Building a Moving Average Stock Screener: Step-by-Step
Step 1: Define Your Regime Filter
Start with the 200-SMA. Set your screener to return only stocks where price is above the 200-day moving average. This removes downtrending stocks from your bullish scan immediately. For bearish setups, flip it — price below 200-SMA only.
Step 2: Add a Trend Confirmation Layer
Next, confirm the intermediate trend. Filter for stocks where the 50-SMA is sloping upward over the past 10 sessions. This confirms that the medium-term trend supports your trade direction. Stocks meeting both the 200-SMA and 50-SMA slope conditions are already in the top tier of your universe.
For a deeper dive into using multiple moving averages together, the Triple Moving Average Strategy for Trend Confirmation walks through exactly how to stack three MAs for high-confidence trend reads.
Step 3: Trigger with the Short-Term MA
Now add your entry trigger. The most common: price pulls back to the 20-SMA and closes back above it, within an established uptrend. This is the pullback-to-MA setup — arguably the cleanest entry structure in technical trading.
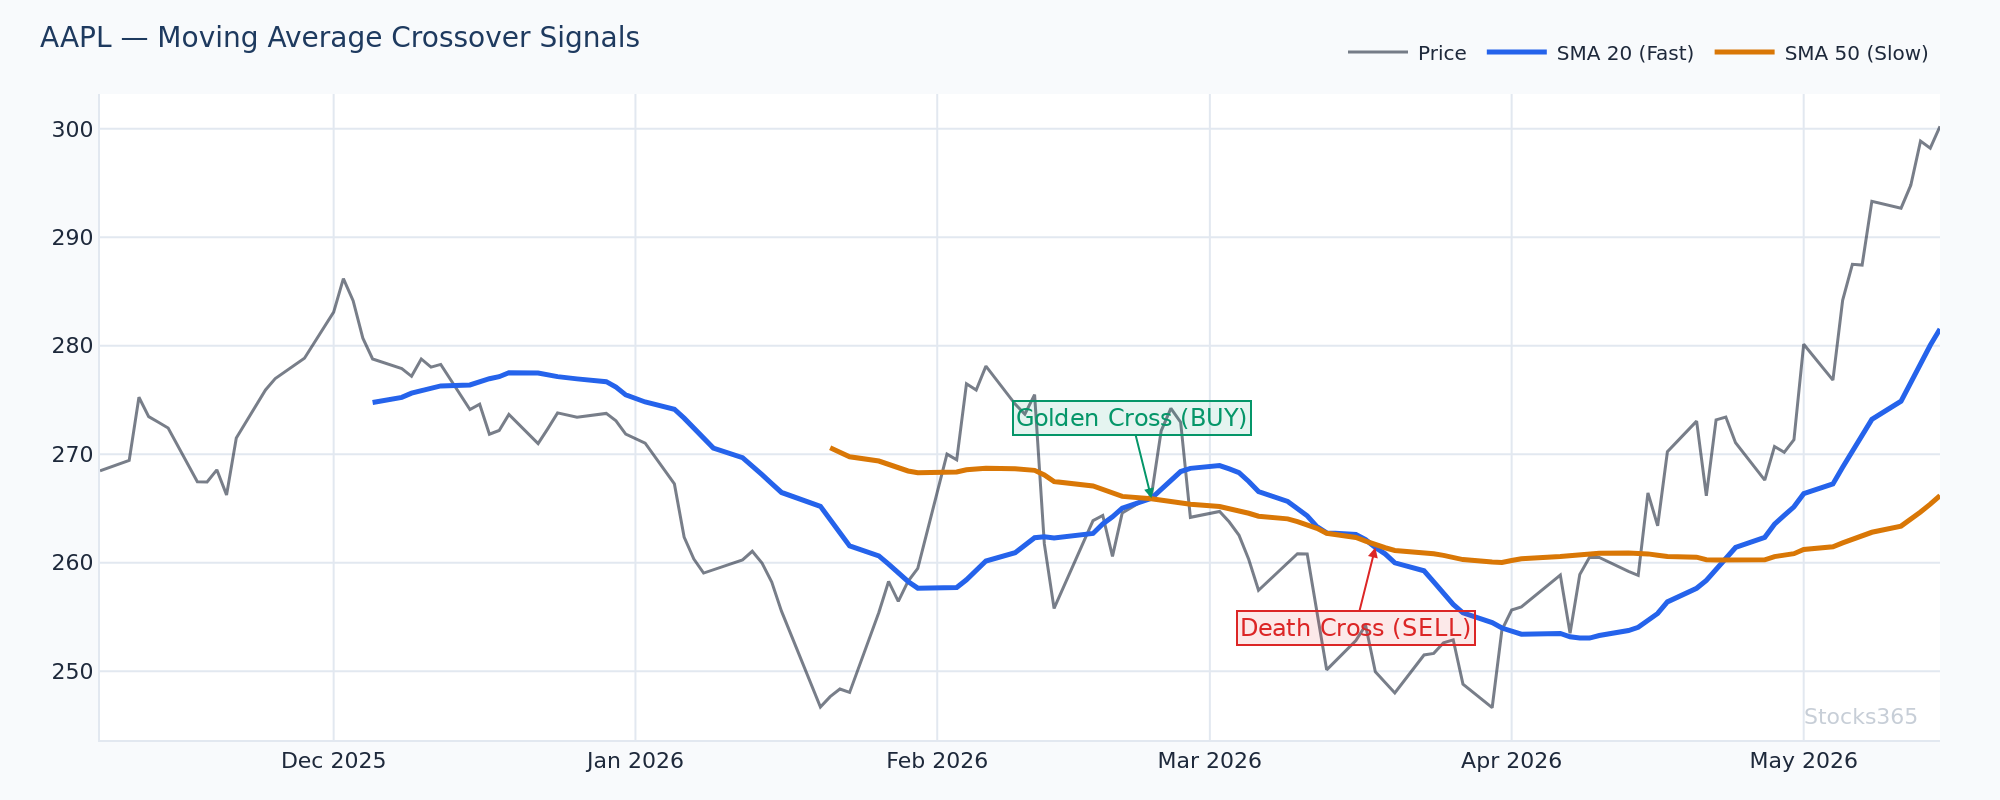
Alternatively, screen for stocks where the 20-EMA has just crossed above the 50-EMA for the first time in 60+ days. That crossover, in the context of price above the 200-SMA, is a meaningful signal. For a complete breakdown of crossover mechanics, the Moving Average Crossover Strategy: Complete Trading Guide covers every variation worth knowing.
This candlestick setup illustrates the ideal pullback-to-MA entry: price tags the 20-SMA after a strong upward leg, holds, and begins recovering. The confirmation comes when the next session closes green on volume above the 20-day average. If price undercuts the 20-SMA and then the 50-SMA without recovery, the trend structure is broken and the setup is off the table.
Step 4: Add a Momentum Filter
Layer in RSI to filter out exhausted moves. Screen for RSI between 45 and 65 on pullbacks within uptrends — this range captures stocks that have pulled back without becoming oversold, which often signals healthy consolidation rather than trend reversal. Avoid chasing stocks where RSI is already above 70 when they cross a moving average.
If you're unfamiliar with RSI mechanics, What Is RSI? The Complete Beginner's Guide covers the foundation. For more advanced applications, RSI Divergence Explained adds another dimension to your screener logic.
When Moving Average Screeners Work — And When They Don't
Here's what most traders get wrong: they treat a moving average crossover as a trade signal rather than a trade filter. The crossover tells you something changed. It does not tell you where the stock is going next. The trade signal comes from what you add on top of it.
Moving average screeners perform best in trending markets with clear directional structure. They struggle in choppy, range-bound conditions where price oscillates through the moving averages repeatedly without follow-through.
The asset class matters enormously. Stocks365 backtested 3,332 signals where price crossed below the SMA 20 and found a 50.9% win rate overall — but that masks a wide range. Crypto led with a 66.8% win rate on the downside cross, while forex lagged badly at just 42.5%. If you're screening for short setups using the 20-SMA break, crypto is a significantly more fertile ground than currency pairs. View the full breakdown in our research dashboard.
For equity traders, the takeaway is nuanced. The best-performing equity setups on moving average screens occur when:
- The broader market (S&P 500) is in an established uptrend
- The sector the stock belongs to is outperforming the index
- Volume confirms the MA interaction (expansion on breakouts, contraction on pullbacks)
- The setup aligns with the weekly chart trend, not just the daily
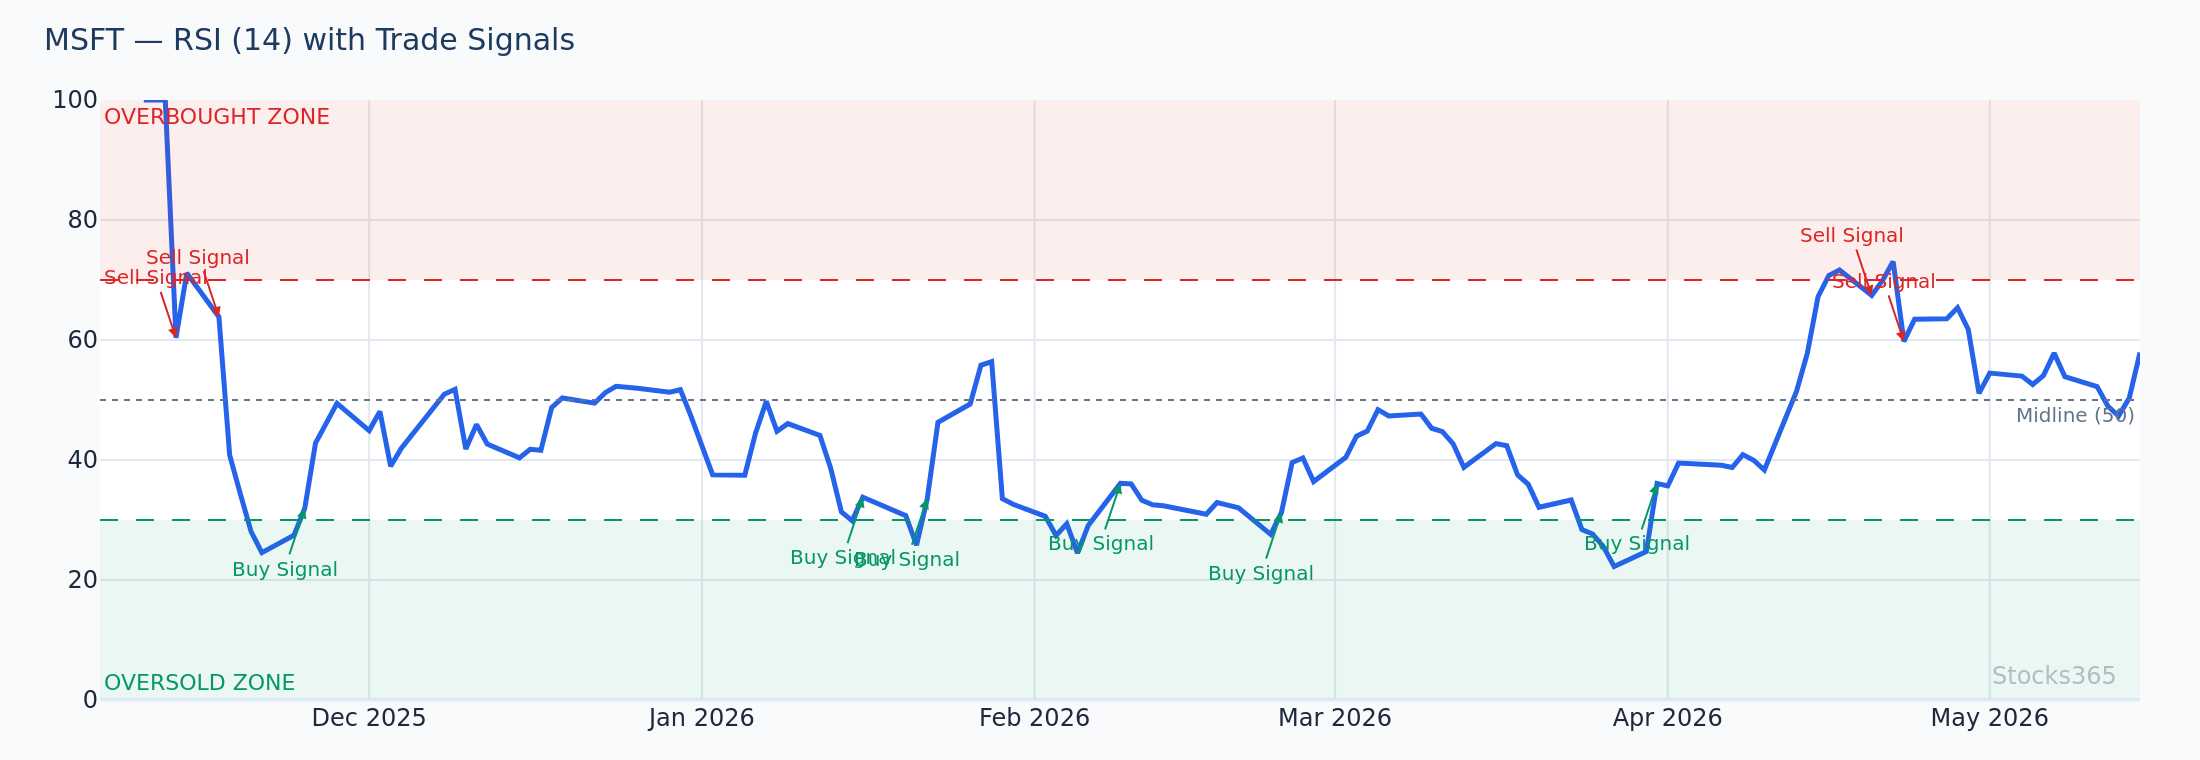
This RSI overlay shows how a moving average crossover combined with RSI in the 45–65 range creates a much cleaner signal than the crossover alone. When RSI is already at 75+ as price crosses the MA, the setup is late and prone to reversal. When RSI is recovering from the 40s, there's room to run. A failure to hold RSI above 40 after the crossover usually signals the move is fading.
Advanced Screener Setups Worth Running in 2026
The MA Stack Confirmation Screen
Screen for stocks where: 20-EMA is above 50-SMA is above 200-SMA, AND all three are sloping upward, AND price closed within 3% of the 20-EMA after a 5-day pullback. This is MA stacking — the structure that defines the most consistent uptrends. Stocks meeting all these criteria simultaneously are rare. When they appear, they deserve close attention.
The 200-SMA Reclaim Screen
Screen for stocks that have closed above the 200-SMA for the first time in 60+ days, on volume at least 1.5x the 20-day average. This is the reestablishment of bull structure after a bearish phase. The first retest of the 200-SMA from above — where price pulls back to the MA and holds — is often the best entry of the entire recovery move.
The Mean Reversion Distance Screen
Screen for stocks trading more than 15% below their 50-SMA in an otherwise bullish sector, with RSI under 35. This is a mean reversion setup. The edge isn't in catching falling knives — it's in identifying stocks that have been excessively punished relative to their peers and are showing early signs of stabilization. Combine with RSI trendline breaks for timing the entry.
Combining Moving Average Screens with Other Signals
Moving averages are trend-following tools. They work best when paired with momentum indicators (RSI, MACD) that confirm the underlying strength of a move, and with volume analysis that validates institutional participation.
MACD is a natural complement to MA-based screens because it's derived from moving averages itself. When your screener flags a 20-over-50 EMA crossover and MACD is simultaneously crossing above its signal line, the two systems are in agreement — and that confluence matters. The MACD strategy guide covers the mechanics in detail, with applications that transfer directly to equity screening.
For traders using the Stocks365 platform, the signals dashboard at Stocks365 Dashboard surfaces stocks that have triggered moving average conditions and shows the trust score context — so you're not acting on a raw screener hit, but on a signal that's been validated across multiple indicator layers.
Individual stock signals, like the AAPL signal page, show real-time moving average positioning alongside momentum and volume readings, giving you the full picture in one view.
This chart demonstrates the MA crossover confirmed by MACD histogram expansion — the two signals pointing in the same direction simultaneously. When the crossover fires but MACD is flat or diverging, treat the signal with caution. Confluence between these two systems has historically produced meaningfully better follow-through than either signal in isolation. The setup breaks down if the MACD histogram rolls over within three sessions of the crossover.
What to Watch For
- MA stack breakdowns in high-beta sectors: When the 20-EMA crosses below the 50-SMA in tech or biotech stocks that have been extended, watch for rapid mean reversion. The distance traveled below the 50-SMA in the first 5 sessions often predicts the severity of the correction.
- 200-SMA reclaims after 60+ day absences: Stocks reclaiming the 200-SMA on heavy volume, especially in sectors with improving relative strength, have historically produced their strongest follow-through in the 10–20 session window after the reclaim. The first successful retest of that MA from above is the cleanest entry.
- Three-MA alignment on weekly charts: When the weekly chart shows 10-week, 20-week, and 40-week MAs all sloping upward with price above all three, short-term pullbacks on daily charts to the 20-EMA tend to recover quickly. Screen for this weekly alignment first, then drop to daily for entries.
- Crypto downside 20-SMA breaks: Based on Stocks365 backtested data, short setups triggered by price crossing below the 20-SMA perform significantly better in crypto than any other asset class. Watch for this signal in major crypto assets during broad market risk-off periods, combined with declining volume on any bounces.
- Hidden RSI divergence at MA support: When price pulls back to a key moving average and RSI makes a higher low while price makes a lower low, that's a hidden bullish divergence at support — a high-probability bounce setup. The hidden RSI divergence signal is one of the most underused filters you can add to an MA screener.
How Stocks365 Uses This
Stocks365 Trust Score Integration
Moving average positioning is one of 12+ indicators that feed into the Stocks365 Trust Score — a composite signal rating system designed to quantify the agreement between different technical layers. Specifically, MA signals contribute to the trend regime component of the score: whether the 20, 50, and 200-period MAs are aligned, diverging, or in conflict.
When a stock's moving averages are fully stacked (short above medium above long, all sloping in the same direction), the trust score trend component scores at maximum agreement. When MAs are crossed or conflicted, the score reflects that uncertainty — reducing confidence in any directional signal fired by other indicators like RSI or MACD.
This means that when you act on a signal in the Stocks365 dashboard, the trust score has already filtered out the setups where moving average structure is working against the trade. You're seeing only signals where the MA regime supports the direction — not fighting it.
Key Takeaways
Summary: Moving Average Stock Screener Essentials
- A moving average stock screener filters for specific MA conditions — use it as a filter, not a signal in isolation.
- The 200-SMA is your regime filter. Price above = bullish context only. Price below = no long setups.
- Crossovers above the 20-SMA have a below-breakeven win rate (48.3% across 3,289 signals) without confluence filters. Add RSI, volume, and trend alignment.
- The 20-SMA downside cross performs best in crypto (66.8% win rate) and worst in forex (42.5%) — know your asset class.
- MA stacking (20 above 50 above 200, all sloping up) is the single most reliable trend confirmation structure available in a screener.
- Combine MA screens with RSI and MACD for confluence — agreement between systems produces meaningfully stronger signals.
- The Stocks365 Trust Score integrates MA alignment as part of trend regime scoring — so high-trust signals already account for MA context.