
Overbought and Oversold: How Stochastic Oscillator Levels Actually Work
Most traders discover the stochastic oscillator and immediately do the same thing: sell every time it crosses 80, buy every time it drops below 20. Then they lose money and blame the indicator.
The indicator isn't broken. The approach is.
Understanding stochastic oscillator overbought oversold levels requires more than reading a number. It requires context, confirmation, and a clear-eyed view of what the data actually says. Our analysis of 8,204 oversold signals across multiple asset classes shows a 54.7% win rate — meaningful, but not a silver bullet. The edge comes from knowing when that 54.7% applies and when you're sitting in the 45.3%.
This guide breaks down exactly how to use stochastic levels intelligently — including the setups that work, the ones that don't, and the confirmation logic that separates consistent traders from gamblers.
What Are Stochastic Oscillator Overbought and Oversold Levels?
The stochastic oscillator measures where the current closing price sits relative to the high-low range over a defined lookback period — typically 14 periods. The result is a value between 0 and 100, plotted alongside a signal line (%D, usually a 3-period moving average of %K).
By convention:
- Above 80 = overbought territory
- Below 20 = oversold territory
- 50 crossovers = momentum shifts worth watching
The logic is straightforward: if price consistently closes near the top of its range, momentum is strong and a reversal may be approaching. If price consistently closes near the bottom, selling pressure is dominant and a bounce may be near. For a deeper breakdown of the math behind this, read our guide on how the stochastic oscillator works and its formula explained.
But here's what that logic misses: markets don't revert on schedule.
This chart shows a classic overbought crossover — %K climbing above 80 before hooking back below. The key detail to watch is whether price simultaneously fails at a prior swing high or a resistance zone. When it does, the signal carries significantly more weight. When price is breaking out to new highs simultaneously, a reading above 80 often means strength, not exhaustion — and fading it becomes a losing trade.
The Raw Numbers: What Backtesting Actually Shows
Here's where traders get humbled by data.
Stocks365 backtested 9,257 overbought stochastic signals across a multi-year dataset and found a 48.8% win rate with a profit factor of just 0.86 over a 10-day holding period. That profit factor below 1.0 means the strategy, used mechanically, loses money over time. The best performance came from crypto (58.9% win rate), while commodities dragged the average down with only 44.6%.
Oversold signals told a different story. Across 8,204 oversold signals, the win rate climbed to 54.7% with a profit factor of 1.24 — actually profitable over the same 10-day window. Forex led all asset classes at 57.0%, while crypto was the weakest performer at 48.9%. You can explore this data further through our research dashboard.
The takeaway? Oversold signals have a statistical edge. Overbought signals, used alone, don't. This asymmetry matters enormously for how you structure trades.
Here's What Most Traders Get Wrong
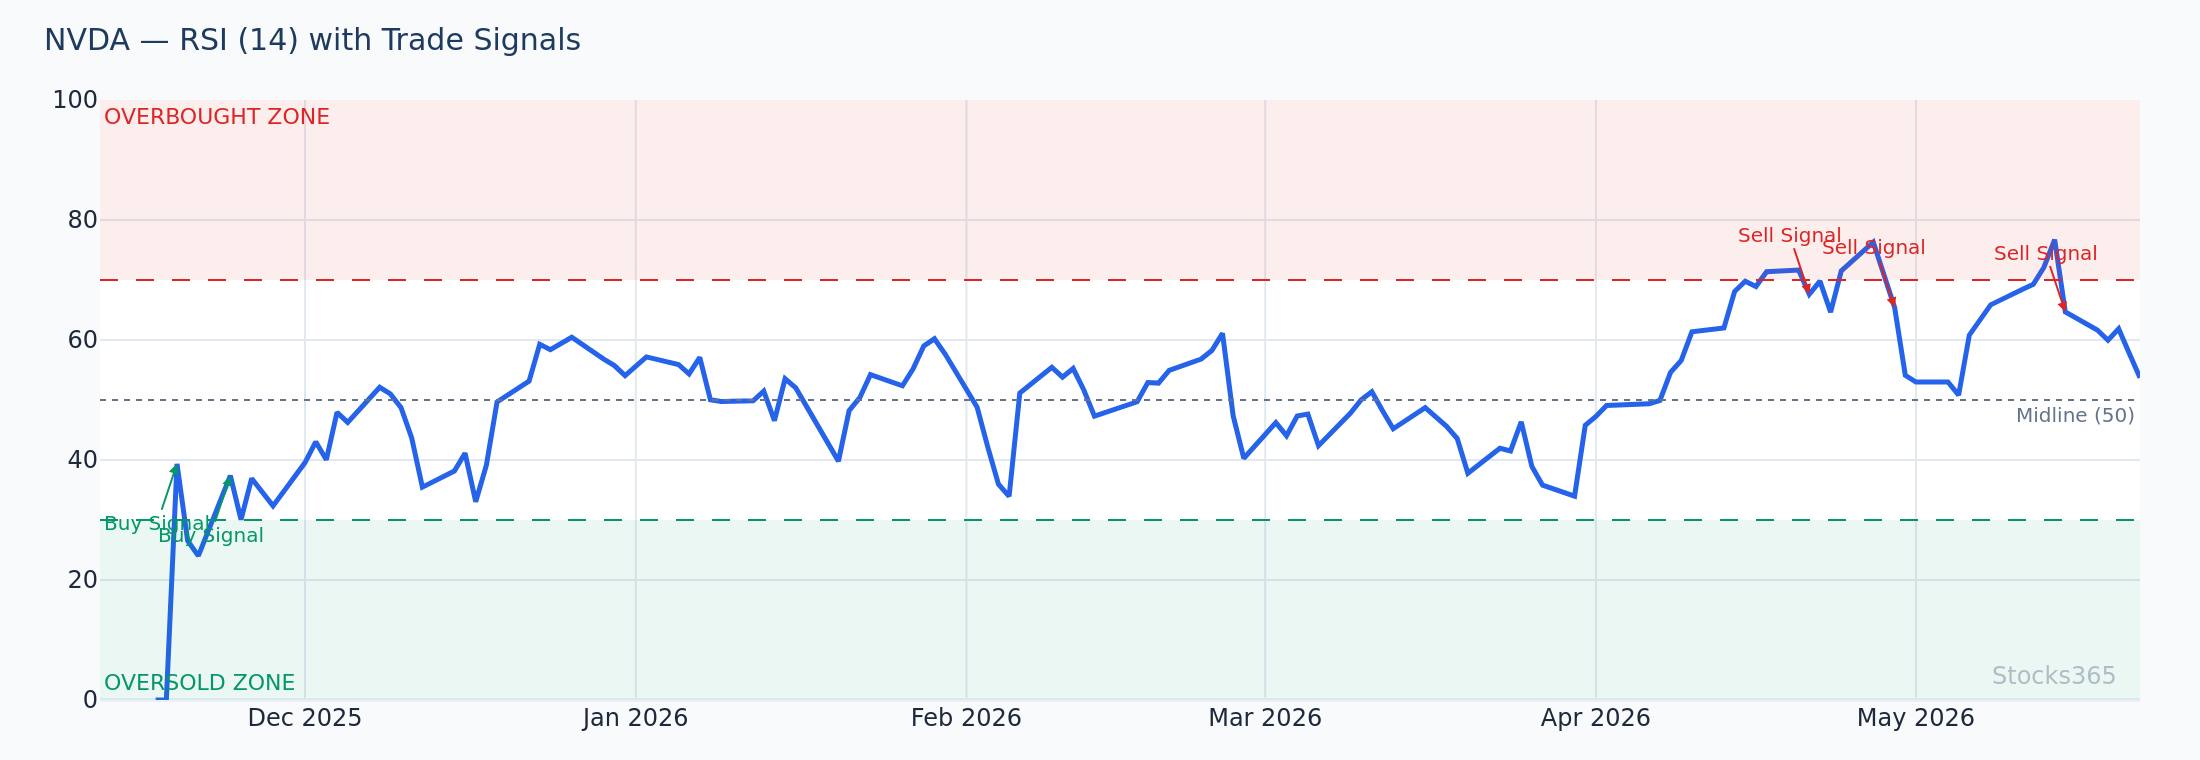
Most traders treat stochastic 80 as an automatic sell signal. In a trending market, the oscillator can stay above 80 for days or weeks while price continues climbing. The real edge isn't entering when stochastic crosses 80 — it's waiting for %K to break back below 80 after a confirmed high, with price confirming the rejection. The cross into overbought is information. The cross back out is the signal. Treating the entry as the moment of crossing above 80 is one of the most common and costly mistakes in technical trading.
How to Read Stochastic Crossovers in Context
The %K and %D Relationship
The two lines tell different stories. %K is fast — reactive, noisy, prone to false signals. %D smooths that noise. When %K crosses above %D while both are below 20, that crossover is a genuine oversold signal with directional confirmation. When %K crosses above %D above 80, that's a divergence or exhaustion warning worth noting.
For a step-by-step walkthrough of reading these lines in real time, see our guide on how to read the stochastic oscillator.
Divergence: The Signal Most Traders Miss
Divergence is where stochastic becomes genuinely powerful. If price makes a new high but the stochastic oscillator makes a lower high, momentum is weakening even as price advances. That's bearish divergence — and it precedes reversals far more reliably than a simple overbought reading alone.
The same logic applies in reverse. Price makes a new low, but stochastic makes a higher low. Selling pressure is exhausting. This bullish divergence setup — particularly when it forms below 20 — is one of the cleaner setups in technical analysis.
This chart illustrates a bearish divergence pattern where stochastic printed a lower high while price reached a new peak. The pattern typically resolves with a pullback once %K rolls over and breaks below %D. Confirmation comes when price breaks below a short-term swing low or the 10-period moving average. If price immediately accelerates higher after the divergence forms, the pattern is invalidated — divergence is a warning, not a guarantee.
Stochastic Overbought Signals: When They Work (and When They Don't)
Strong Trends Invalidate Overbought Readings
In a strong uptrend, the stochastic oscillator spends extended periods above 80. Fading those readings is expensive. The indicator was designed for ranging markets — it excels when price oscillates between support and resistance with no dominant directional bias.
Before acting on an overbought stochastic signal, check the trend context. Is price above its 50-period moving average? Is the ADX reading above 25? If yes, overbought readings are noise. Wait for trend exhaustion signals — topping wicks, volume divergence, or a failed breakout — before treating the stochastic reading as actionable.
Where Overbought Signals Actually Perform
The 58.9% crypto win rate on overbought signals is worth examining. Crypto markets are prone to sharp, aggressive reversals after parabolic moves — a dynamic that makes momentum exhaustion signals more reliable than in, say, a slow-moving commodity market where trends can persist for months. The asset class matters. Apply your stochastic overbought strategy accordingly.
Stochastic Oversold Signals: Building an Edge
Forex Is the Sweet Spot
With a 57.0% win rate in forex, oversold stochastic signals perform best in currency pairs — and the reason makes structural sense. Forex pairs tend to mean-revert more predictably than equities or crypto. Central bank policy, interest rate differentials, and range-bound behavior on major pairs create conditions where oversold bounces are more reliable than in trending assets.
If you trade currency pairs, pairing stochastic oversold signals with MACD confirmation adds a meaningful layer of validation. Read our full breakdown in MACD in Forex Trading: Master Currency Pair Strategies to see how combining these two momentum tools sharpens entries.
The Confirmation Framework
Don't enter on the stochastic signal alone. Layer in at least one of the following:
- %K crosses above %D while both remain below 20 — confirmed bullish momentum shift
- Price breaks above a short-term swing high formed during the oversold period
- Volume surges above the 20-period average on the breakout candle
- Bullish candlestick pattern (engulfing, hammer, morning star) at the low
Any one of these alongside an oversold reading raises conviction. Two or more make it a high-probability setup.
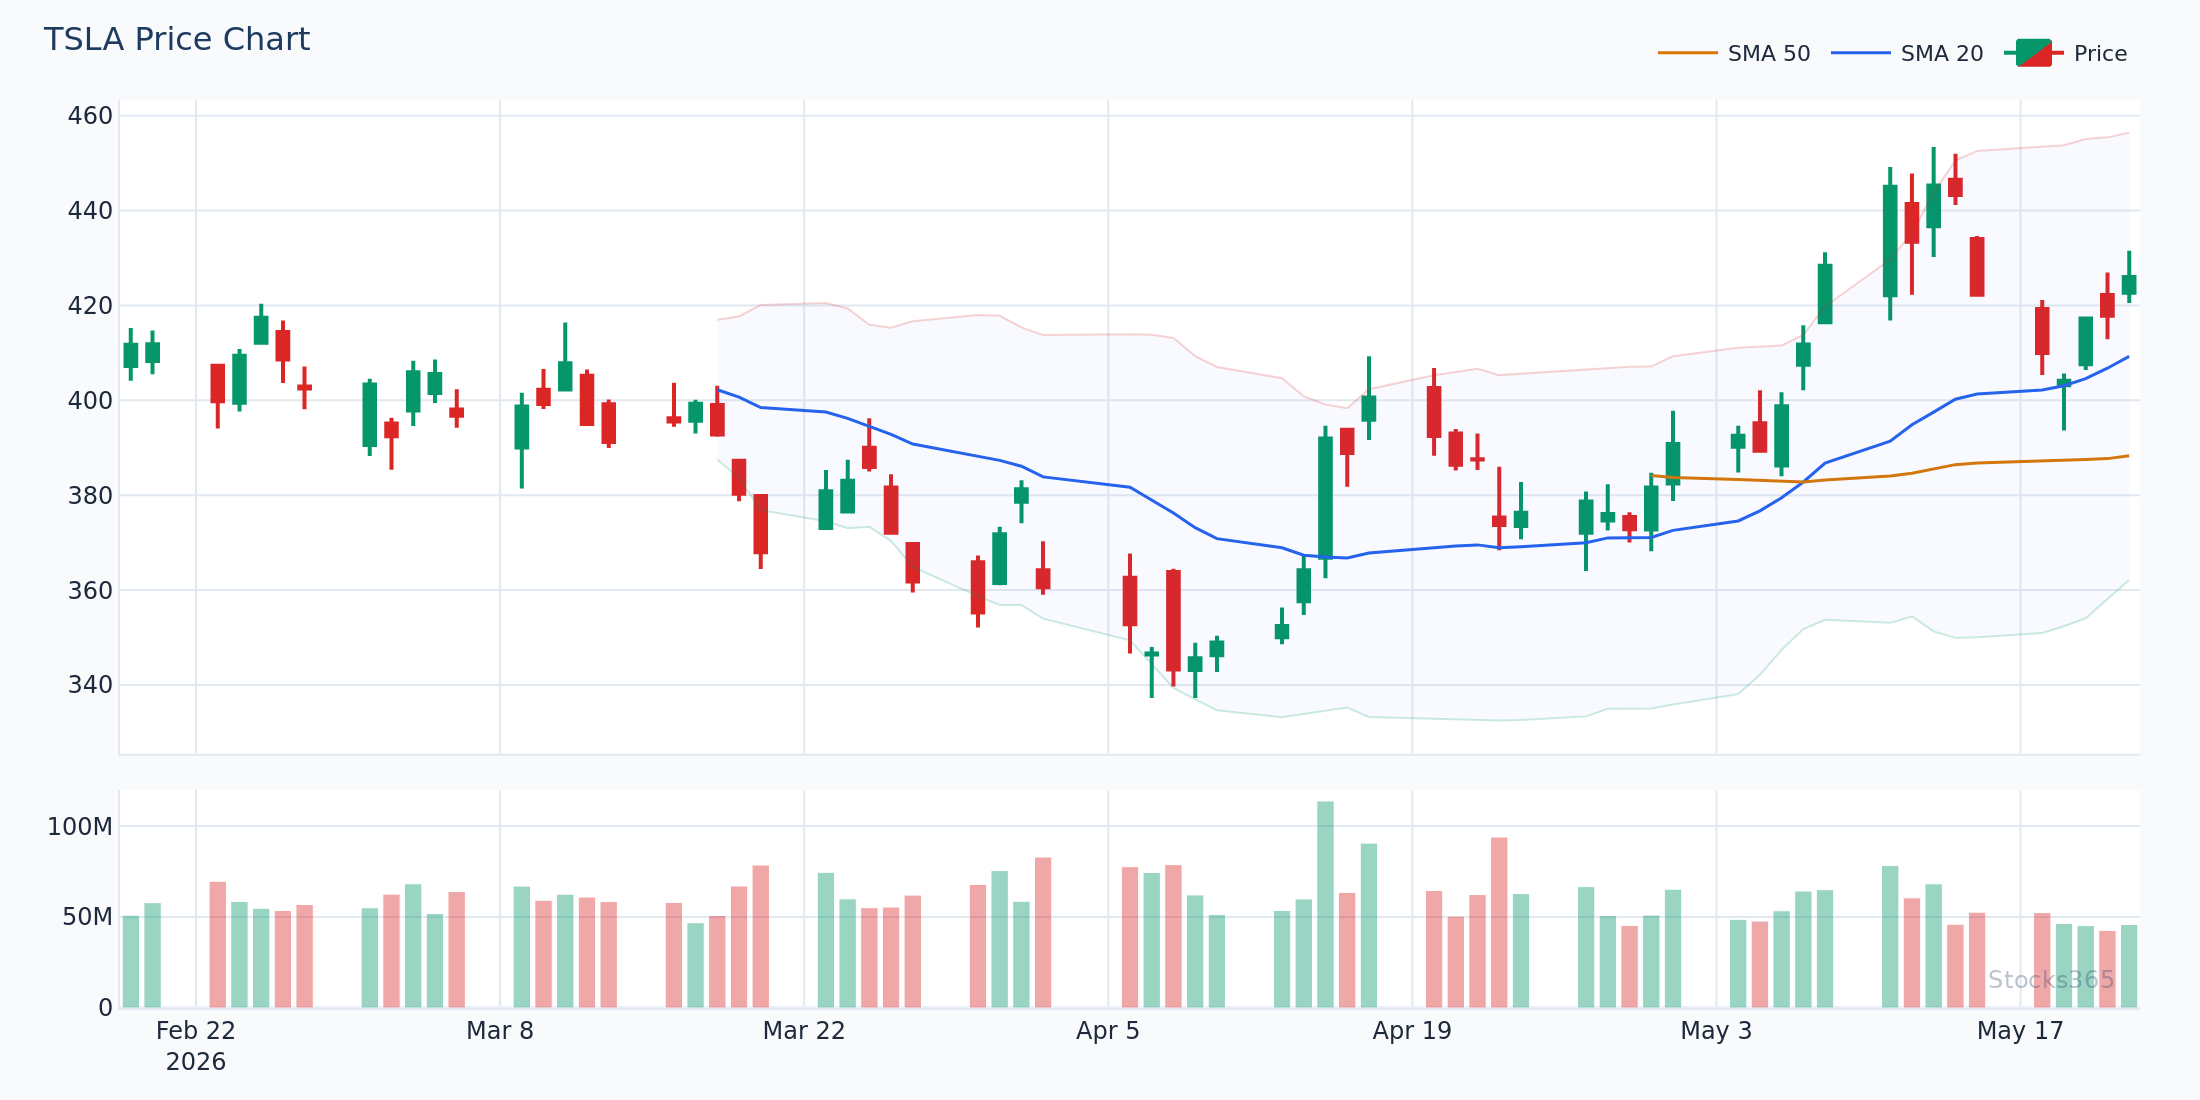
This setup shows a textbook oversold entry: %K crossing above %D while both sit below 20, coinciding with a hammer candle and above-average volume on the recovery day. When this pattern forms, the next several sessions typically print higher lows as price builds a base. The setup is invalidated if price immediately breaks back below the low of the signal candle — that's a sign sellers remain in control and the stochastic reading was premature.
Combining Stochastic With Other Indicators
Bollinger Bands + Stochastic: The Double Oversold Setup
This combination deserves special attention. When price touches or breaches the lower Bollinger Band simultaneously with a stochastic oversold reading, you have a double-confirmed extreme condition. Stocks365 backtested 2,501 of these combined setups and found a 58.9% win rate with a profit factor of 1.61 over 10 days — the strongest result across all the setups we analyzed. Commodities led with 61.1%, and even the weakest asset class (stocks) delivered a 56.9% win rate.
This is the stochastic setup with the clearest statistical edge. For the full strategy including entry rules, stop placement logic, and band-width considerations, read the Moving Average + Bollinger Bands: Complete Strategy Guide.
RSI + Stochastic: Momentum Confirmation
RSI and stochastic measure related but distinct aspects of momentum. RSI tracks the speed and magnitude of price change; stochastic tracks where price closes within its range. When both drop below their oversold thresholds simultaneously, the confirmation is powerful. When they diverge — stochastic oversold but RSI still above 50 — the signal is weaker and deserves scrutiny.
RSI trendline techniques add another dimension to this analysis. See how to draw actionable lines on momentum oscillators in our guide to RSI Trendline Strategy.
Moving Averages as Trend Filters
A simple but effective rule: only take stochastic oversold signals when price is above its 200-period moving average (long-term uptrend context) and only take overbought signals when price is below it (downtrend context). This trend filter eliminates the most dangerous counter-trend trades and keeps you aligned with the dominant market direction.
For a systematic approach to using multiple moving averages as trend filters, the Triple Moving Average Strategy for Trend Confirmation offers a complete framework. And for crossover-based entries that pair naturally with stochastic timing, the Moving Average Crossover Strategy: Complete Trading Guide covers the mechanics in depth.
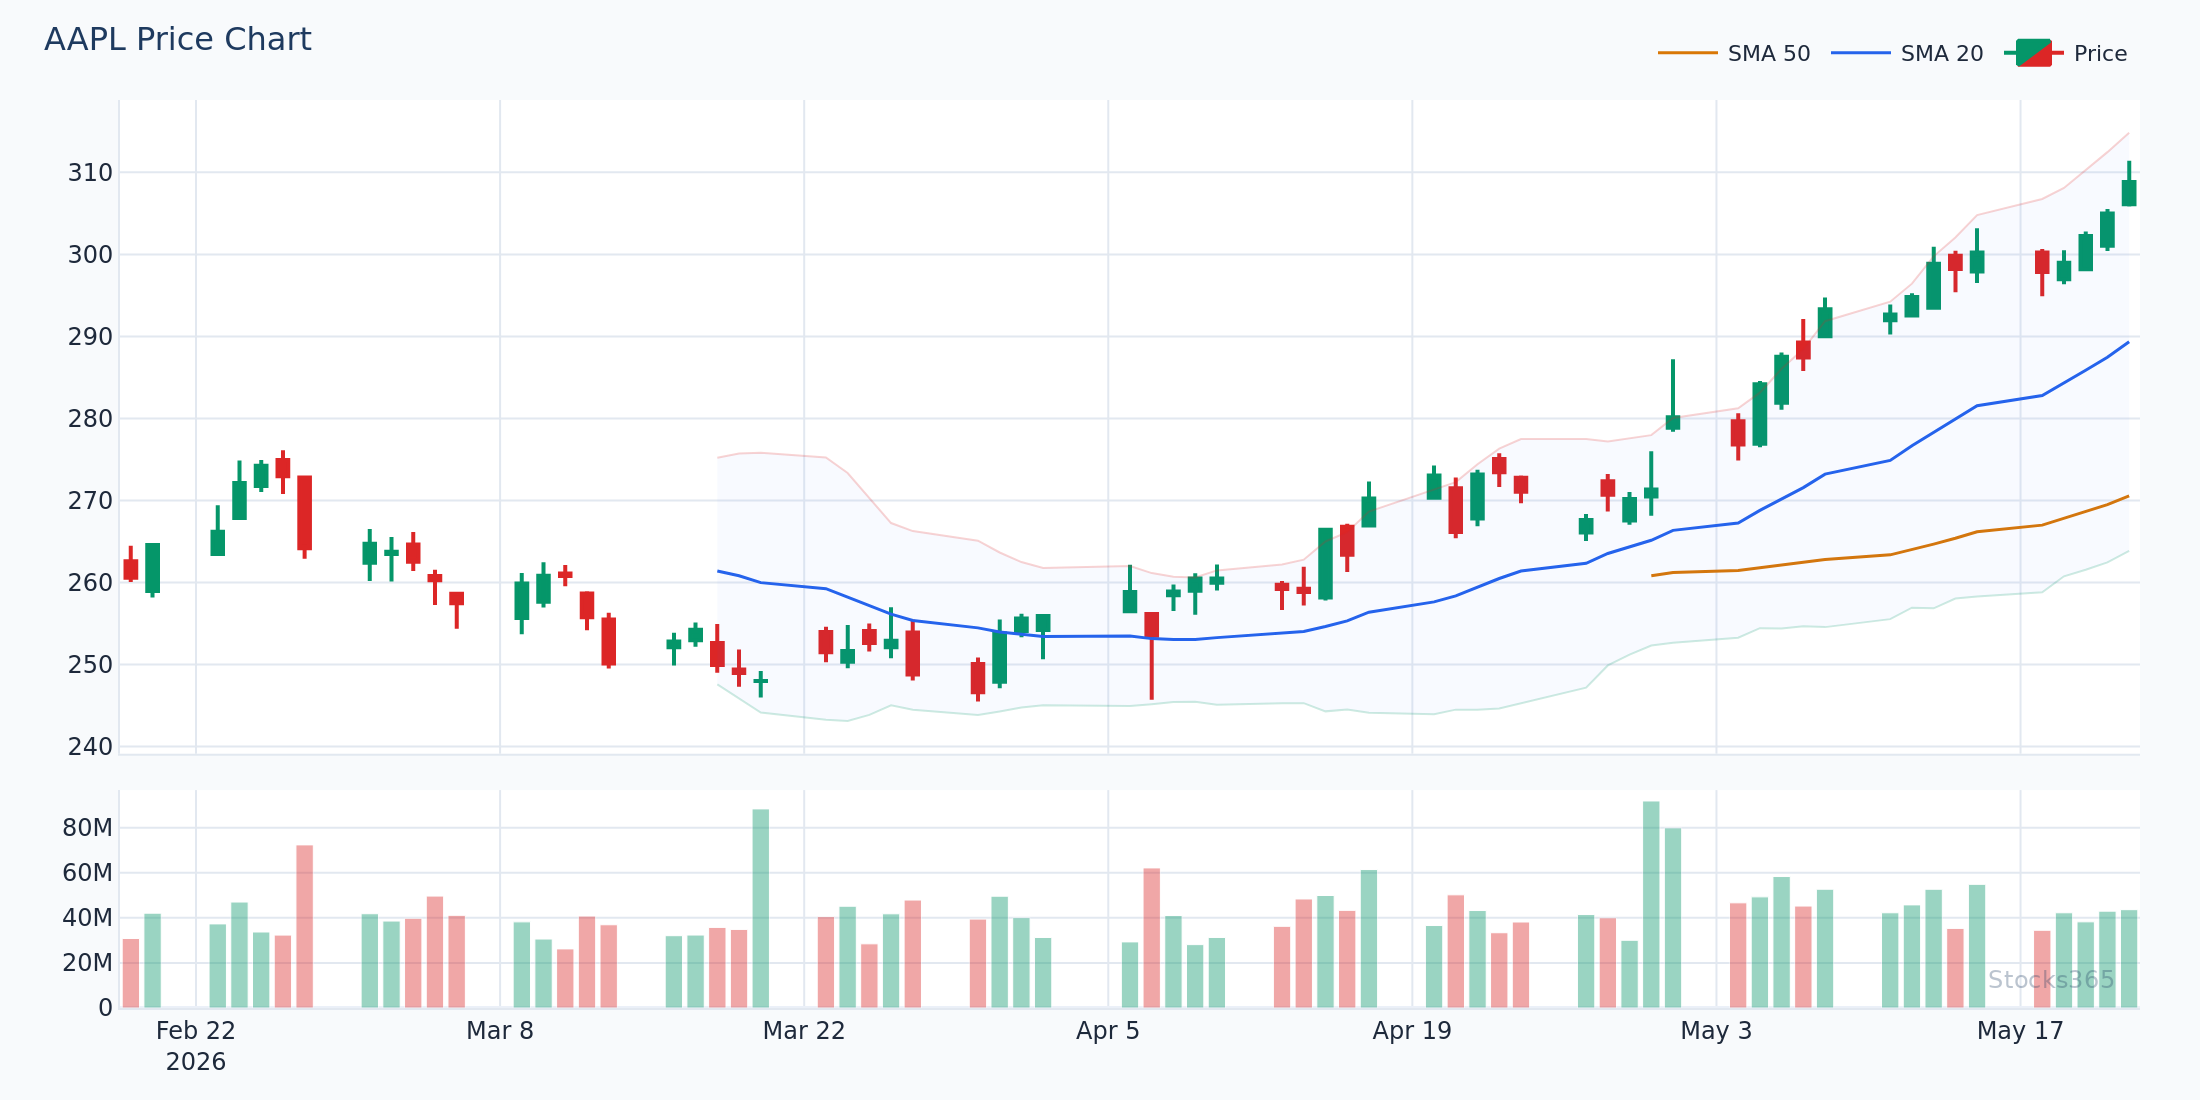
This chart shows price holding above the 200-period SMA while stochastic dips into oversold territory on a routine pullback. In an established uptrend, these dips below 20 represent buying opportunities rather than reversal signals — the trend filter is doing exactly what it should. When price is below the 200-SMA and stochastic reads oversold, the bounce may still occur, but the probability of it developing into a sustained move is significantly lower.
The Stochastic Oscillator Across Timeframes
Timeframe alignment changes everything. A 15-minute stochastic oversold reading in the context of a daily stochastic overbought reading creates conflicting signals. The higher timeframe wins — always start with the daily or weekly to determine the macro bias, then drop to lower timeframes to time entries.
Multi-timeframe stochastic analysis works like this: if the weekly stochastic is oversold and turning up, any daily oversold signal in the same direction carries significantly elevated probability. You're trading with two timeframes aligned rather than fighting the dominant trend.
Practical Stochastic Setups: What the Pattern Looks Like
Setup 1: The Oversold Reversal
- Stochastic %K drops below 20 on the daily chart
- %K forms a higher low while price makes an equal or lower low (bullish divergence)
- %K crosses above %D while both remain below 20
- Price breaks above the most recent short-term swing high
- Volume on the breakout candle exceeds the 20-day average
Setup 2: The Overbought Rollover
- Stochastic %K rises above 80 in a range-bound market (ADX below 20)
- %K forms a lower high while price makes an equal or higher high (bearish divergence)
- %K crosses back below %D and then below 80
- Price fails at a prior resistance level with a topping wick candle
- Volume contracts on the high and expands on the rollover
Setup 3: The Trend Continuation Pullback
- Price is in a confirmed uptrend above its 50 and 200 SMAs
- Stochastic pulls back to below 40 (not necessarily below 20) on a short-term correction
- %K recrosses above %D from below
- Price holds above the most recent higher low
- Enter on the next bullish candle close above the 10-SMA
The third setup is often overlooked. In strong trends, waiting for stochastic to reach 20 means missing the move. A pullback to 30-40 that reverses quickly is frequently the higher-probability trade. Check the AAPL signal page and the broader Stocks365 signals dashboard for real-time examples of these setups forming across multiple assets.
What to Watch For
- Double oversold confirmation on currency pairs: When the daily stochastic drops below 20 while the weekly stochastic is also oversold and beginning to curl upward, forex setups in this alignment have historically produced the strongest follow-through — align entry timing with the %K/%D cross on the daily.
- Bullish divergence after extended downtrends in commodities: After a commodity prints three or more consecutive lower lows, a stochastic higher low combined with a Bollinger Band touch at the lower band is among the highest-probability setups in our backtested data, with win rates above 61%.
- Overbought stochastic during Bollinger Band squeeze breakouts: When band width compresses to multi-month lows and then expands with stochastic crossing above 80, this isn't a reversal signal — it's a momentum confirmation. Don't fade it. Let the move develop.
- Stochastic failure swings in ranging tech stocks: When %K peaks below 80 on a bounce attempt, that failure to reach overbought is a sign of persistent weakness. Combined with a moving average crossover to the downside, this setup often precedes a second leg lower.
- Cross-timeframe oversold alignment on major indices: When weekly and daily stochastic are simultaneously oversold on broad market ETFs, historically the odds of a multi-week recovery bounce increase substantially — particularly when paired with above-average volume on the reversal day.
How Stocks365 Uses This
Stochastic Levels Inside the Stocks365 Trust Score System
Stocks365 integrates stochastic oscillator readings as one of 12+ technical indicators that feed into the Trust Score assigned to every signal on the platform. Specifically, stochastic contributes to the momentum agreement layer — which measures how consistently multiple oscillators are pointing in the same direction at the time of signal generation.
When stochastic aligns with RSI, MACD direction, and a volume confirmation, the Trust Score rises. When stochastic is oversold but RSI disagrees or price is in a confirmed downtrend below key moving averages, the Trust Score reflects that conflict — and the signal is flagged with lower confidence.
This matters because raw stochastic signals, as our backtesting shows, have meaningful variance depending on asset class and market regime. The Trust Score framework contextualizes that variance in real time, so you see not just a stochastic reading but how much the full indicator stack agrees with it. Visit the Stocks365 signals dashboard to see Trust Scores in action across live setups.
Key Takeaways
- Oversold signals outperform overbought signals statistically — 54.7% win rate vs. 48.8%, based on Stocks365 backtesting of over 17,000 combined signals.
- Asset class matters enormously: Oversold stochastic works best in forex (57.0%); overbought works best in crypto (58.9%). Don't apply one-size-fits-all rules.
- The double oversold setup (BB + Stochastic) has the strongest edge — 58.9% win rate and 1.61 profit factor across 2,501 signals.
- Trend context determines signal validity: In strong trends, overbought readings are noise. In ranging markets, they're actionable.
- Confirmation is mandatory: %K/%D crossovers, volume surges, candlestick patterns, and price structure breaks all strengthen the signal.
- Divergence is the highest-quality setup — price and stochastic moving in opposite directions signals momentum exhaustion before price confirms it.
- Multi-timeframe alignment multiplies edge — weekly and daily stochastic pointing the same direction dramatically improves setup quality.
| # | Strategy | Type | Win Rate | Sharpe | PF | N | Status |
|---|---|---|---|---|---|---|---|
| #1 | VWAP Mean Reversion Long | mean_reversion | 53.6% | 0.72 | 1.57 | 7,147 | EDGE |
| #2 | RSI Oversold Bounce | mean_reversion | 56.9% | 0.68 | 1.61 | 2,153 | EDGE |
| #3 | Bollinger Lower Band Touch | mean_reversion | 58.1% | 0.65 | 1.55 | 2,798 | EDGE |
| #4 | Williams %R Oversold | mean_reversion | 54.0% | 0.32 | 1.24 | 11,744 | TEST |
| #5 | Stochastic Oversold | mean_reversion | 54.7% | 0.32 | 1.24 | 8,204 | TEST |