
How to Read Bollinger Bands: A Complete Step-by-Step Guide
Bollinger Bands are one of the most widely used technical indicators in trading — and one of the most widely misunderstood. Developed by John Bollinger in the 1980s, they adapt dynamically to market volatility, expanding during turbulent periods and contracting during calm ones. That adaptability is exactly what makes them powerful. But reading them correctly takes more than glancing at whether price is near the upper or lower band.
This guide breaks it all down. Step by step. No fluff.
Stocks365 backtested 14,266 Bollinger Squeeze Breakout setups across equities, crypto, forex, and commodities and found a profit factor of 1.03 — the only Bollinger Band configuration in our sweep that cleared a profit factor above 1.0. That number matters. It means the squeeze breakout is the one setup where the math actually tilts in your favor, at least modestly. Everything else requires additional confirmation. We'll show you exactly why — and how to use it — on our research dashboard.
What Are Bollinger Bands? The Foundation
Bollinger Bands consist of three lines plotted on a price chart:
- Middle Band: A 20-period Simple Moving Average (SMA) of closing prices
- Upper Band: Middle Band + 2 standard deviations
- Lower Band: Middle Band − 2 standard deviations
The standard deviation component is the key. It's what makes Bollinger Bands self-adjusting. When volatility increases, the bands widen. When volatility drops, the bands squeeze inward. This isn't a lagging indicator giving you yesterday's news — it's a real-time volatility envelope wrapped around price action.
Statistically, approximately 95% of price action occurs within the bands when using 2 standard deviations. That means price touching or breaking the outer bands is genuinely unusual — but unusual doesn't always mean tradeable. Context is everything.
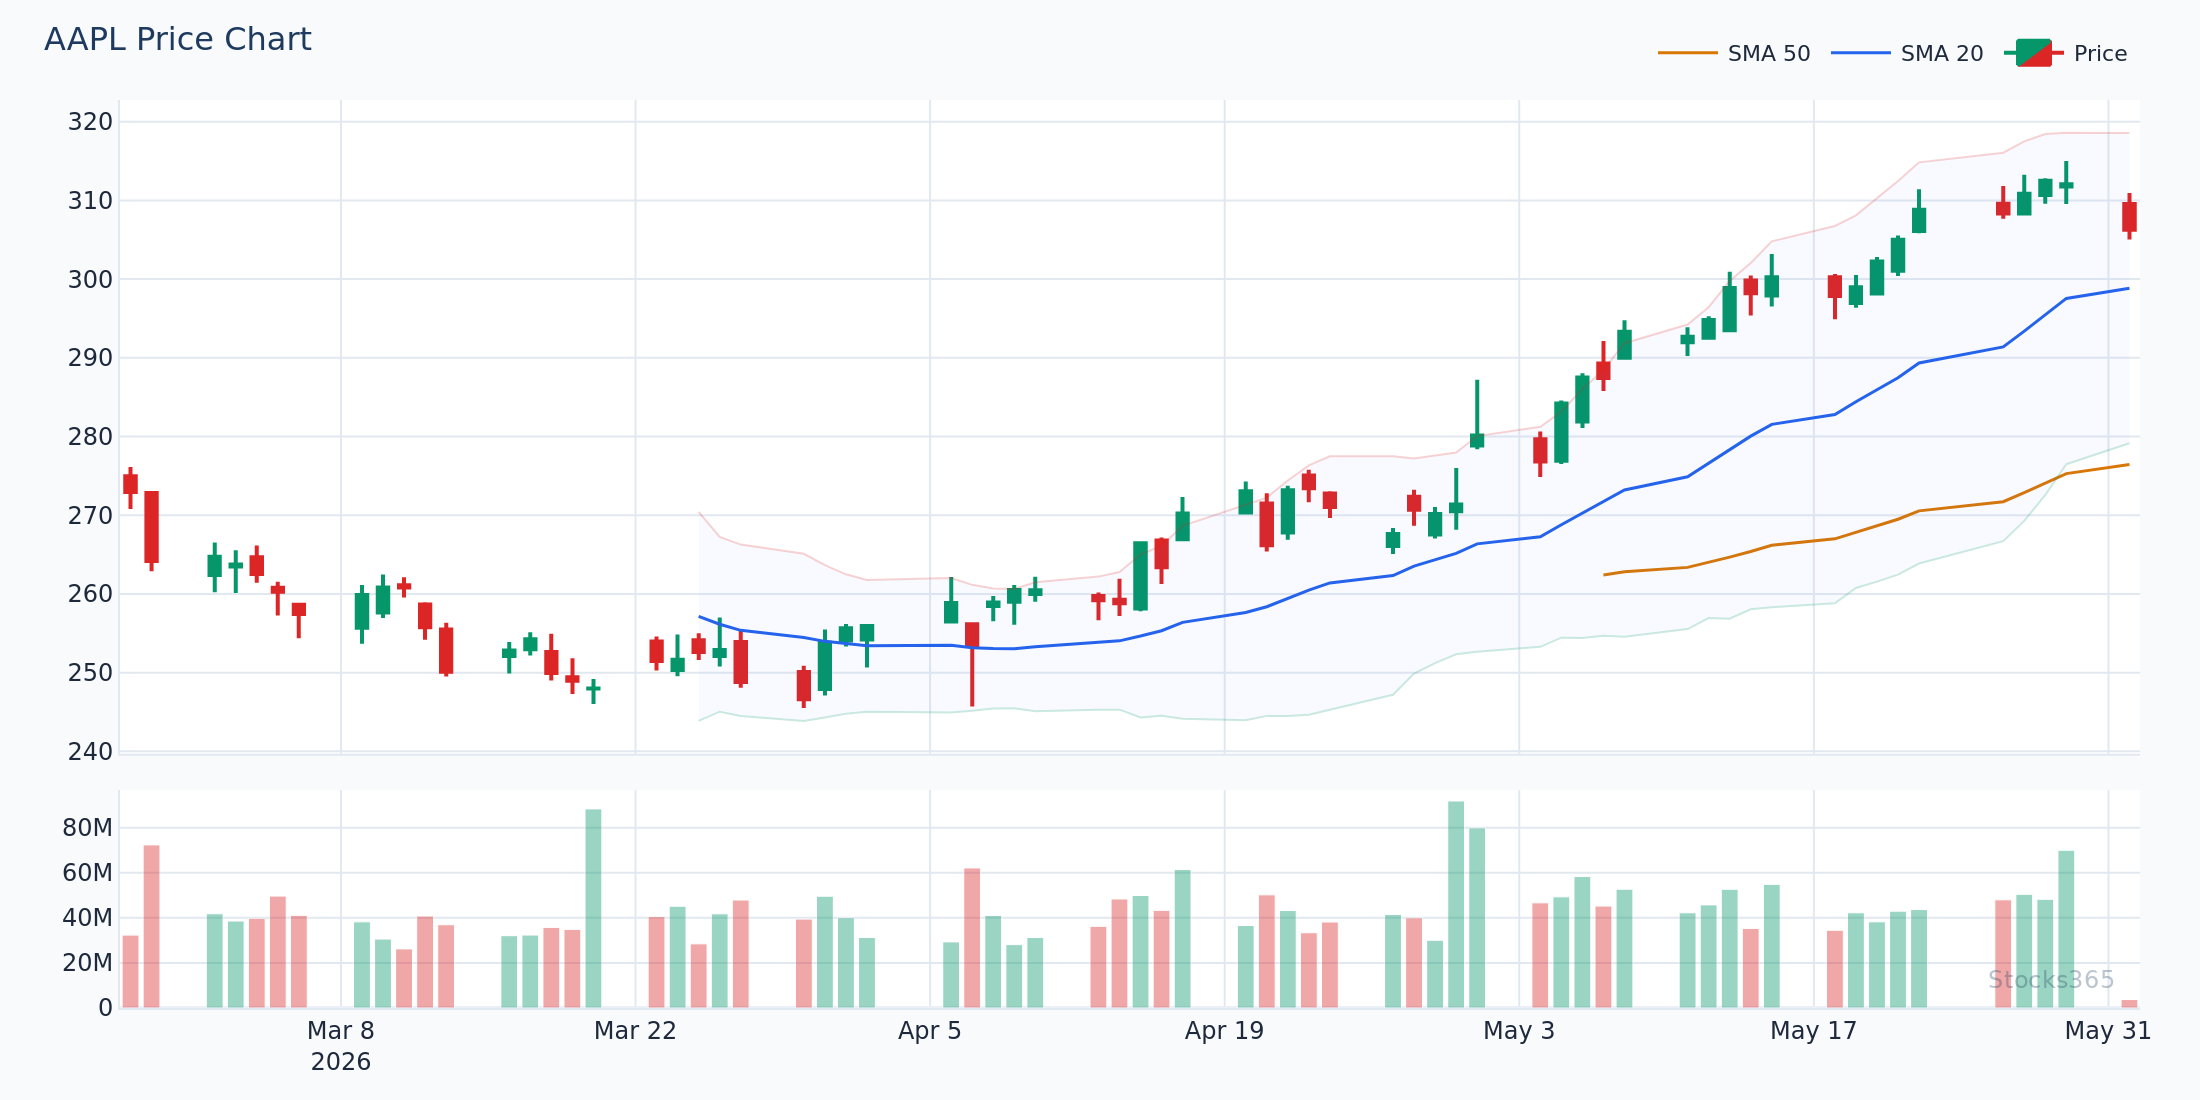
This chart shows price approaching the upper Bollinger Band after a sustained move higher, with the middle SMA still trending upward. When the bands are still expanding and price touches the upper band, the setup often signals continuation rather than reversal — band touches in trending markets frequently resolve with a pullback to the middle band before the next leg higher. A close back inside the band after a multi-day touch, combined with declining volume, is what typically confirms exhaustion. A failed breakdown that quickly reclaims the upper band invalidates the bearish read entirely.
Step 1 — Read the Band Width First, Not the Price Position
Most beginners look at where price is relative to the bands. That's the second thing to check, not the first.
Start with band width. The distance between the upper and lower bands tells you the current volatility regime. Narrow bands mean the market is coiling. Wide bands mean volatility has already expanded. The trade opportunities are completely different in each scenario.
Bollinger Band Width formula: (Upper Band − Lower Band) ÷ Middle Band
When band width drops to multi-month lows, a squeeze is forming. Squeezes precede big moves — in either direction. The bands don't tell you which way. That's your job.
Identifying a Bollinger Squeeze
A squeeze occurs when the bands are tighter than they've been over a defined lookback period — typically 125 trading days (six months). Some platforms display a separate Bollinger Bandwidth indicator, or use the %B Squeeze indicator created by John Bollinger himself. Either way, the signal is the same: low volatility is always temporary. The market is loading up for a move.
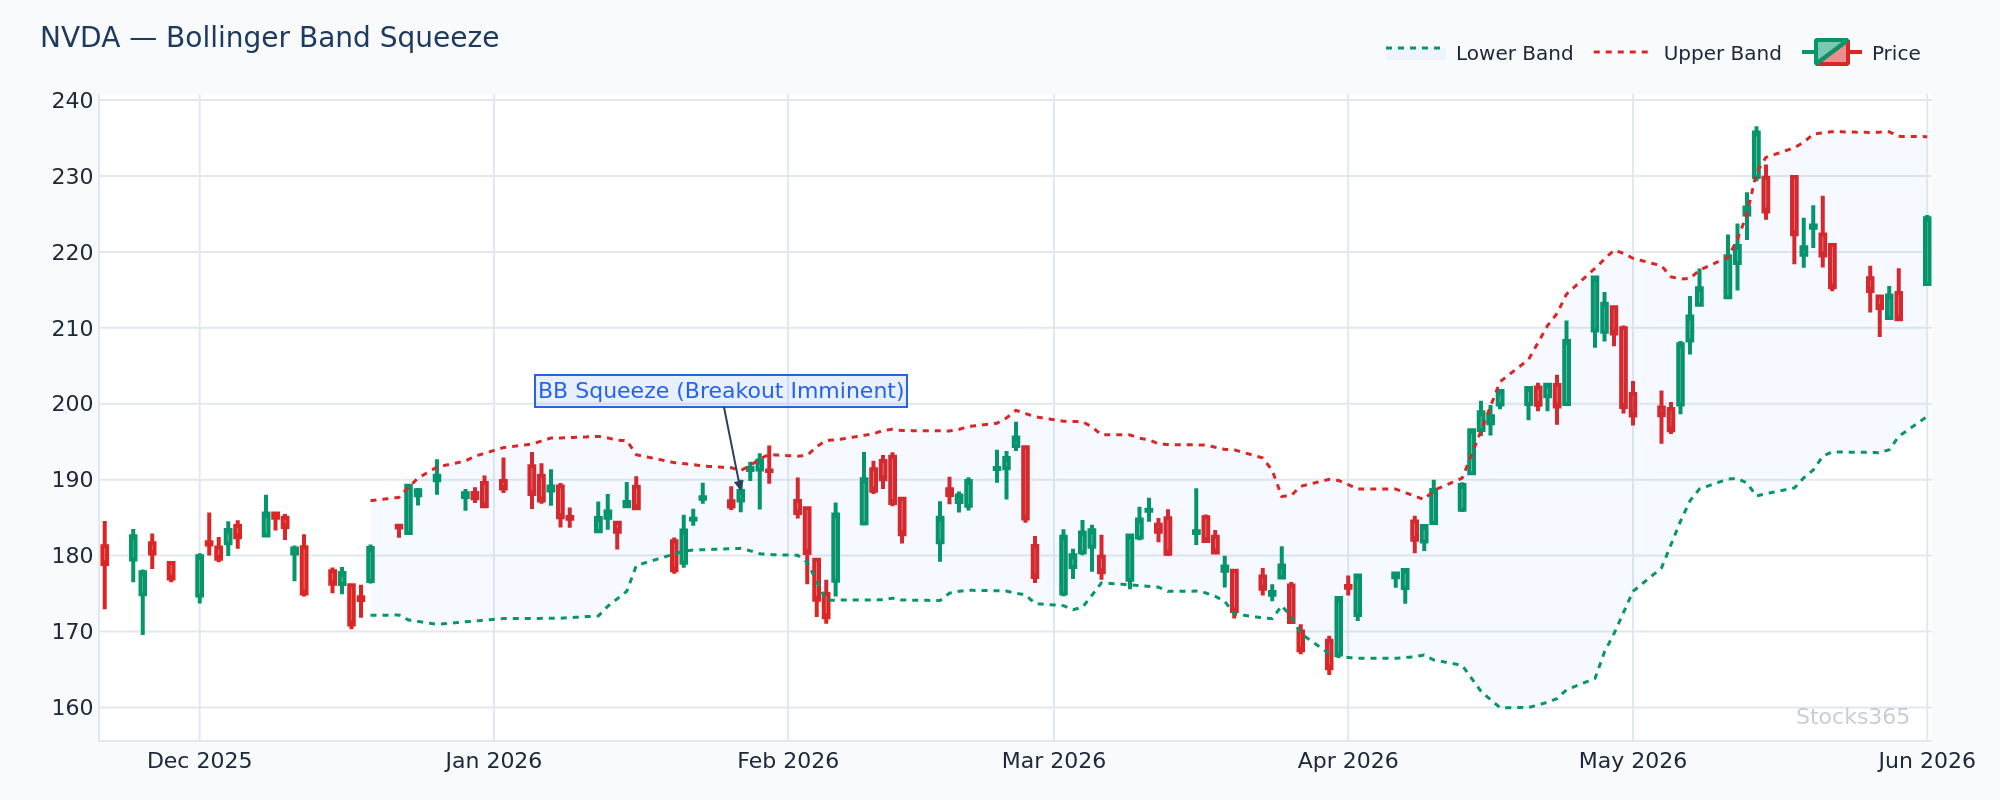
This chart shows NVDA in a classic pre-breakout squeeze: the upper and lower bands are converging, band width has fallen below the 20th percentile of its six-month range, and price is consolidating inside a tight range near the middle SMA. When breakouts emerge from setups like this, the initial move frequently covers 2–3 ATR within the first ten sessions. What confirms the breakout is a close outside the band on above-average volume — at least 1.5x the 20-day average volume. What invalidates it is a quick reversal back inside the band within one or two candles, known as a false breakout or "Bollinger Band snap-back."
Step 2 — Understand What Upper and Lower Band Touches Really Mean
Here's what most traders get wrong: they treat the upper Bollinger Band as automatic resistance and the lower band as automatic support. That framing causes real damage to trading accounts.
In a strong uptrend, price can walk the upper band for days or even weeks. Each candle touches or closes above the upper band, but the trend never reverses. Traders who short every upper band touch in trending conditions get destroyed. The upper band is not a sell signal. In a trending market, it's a confirmation of momentum.
The correct read: band touches are context-dependent. In range-bound, low-volatility environments, upper band touches often do produce mean-reversion trades back toward the middle band. In trending environments, they signal continuation. You must identify the regime before you act on the touch.
Our analysis of 3,255 Bollinger Upper Band Touch signals shows a 49.6% win rate over a 10-day holding period, with a profit factor of just 0.88. Taken in isolation, upper band touches are a losing strategy. The edge disappears when you ignore regime context — and the worst results come from commodities, where this setup wins only 41.5% of the time.
The %B Indicator: Quantifying Band Position
%B tells you exactly where price sits within the bands, expressed as a value from 0 to 1 (with 0 = lower band, 1 = upper band, 0.5 = middle band). Values above 1 mean price has broken above the upper band. Values below 0 mean price is below the lower band.
This is more precise than eyeballing the chart. A %B reading of 0.95 is different from 1.15 — the latter represents a genuine band breach, which carries different statistical implications.
Step 3 — Combine Bollinger Bands With Volume for Confirmation
Volume is the missing piece most traders ignore.
A band breakout on low volume is suspect. The same breakout on 2x average volume is a completely different story. Volume tells you whether real money is backing the move — or whether price is drifting to the edge of the bands without conviction.
For a deeper understanding of volume-based confirmation tools, the Volume-Weighted Moving Average (VWMA) guide walks through how VWMA diverges from standard SMA during high-conviction breakouts. That divergence is one of the cleanest volume signals available.
Volume Rules for Bollinger Band Setups
- Squeeze Breakout: Require at least 1.5x average volume on the breakout candle. Below that, wait for the next candle to confirm.
- Upper/Lower Band Touch Mean Reversion: Volume should be declining into the touch. Rising volume into a band touch often signals continuation, not reversal.
- Band Walking (Trending): Volume should remain above average on days when price closes near or above the upper band. Fading volume during band walking signals the trend is tiring.
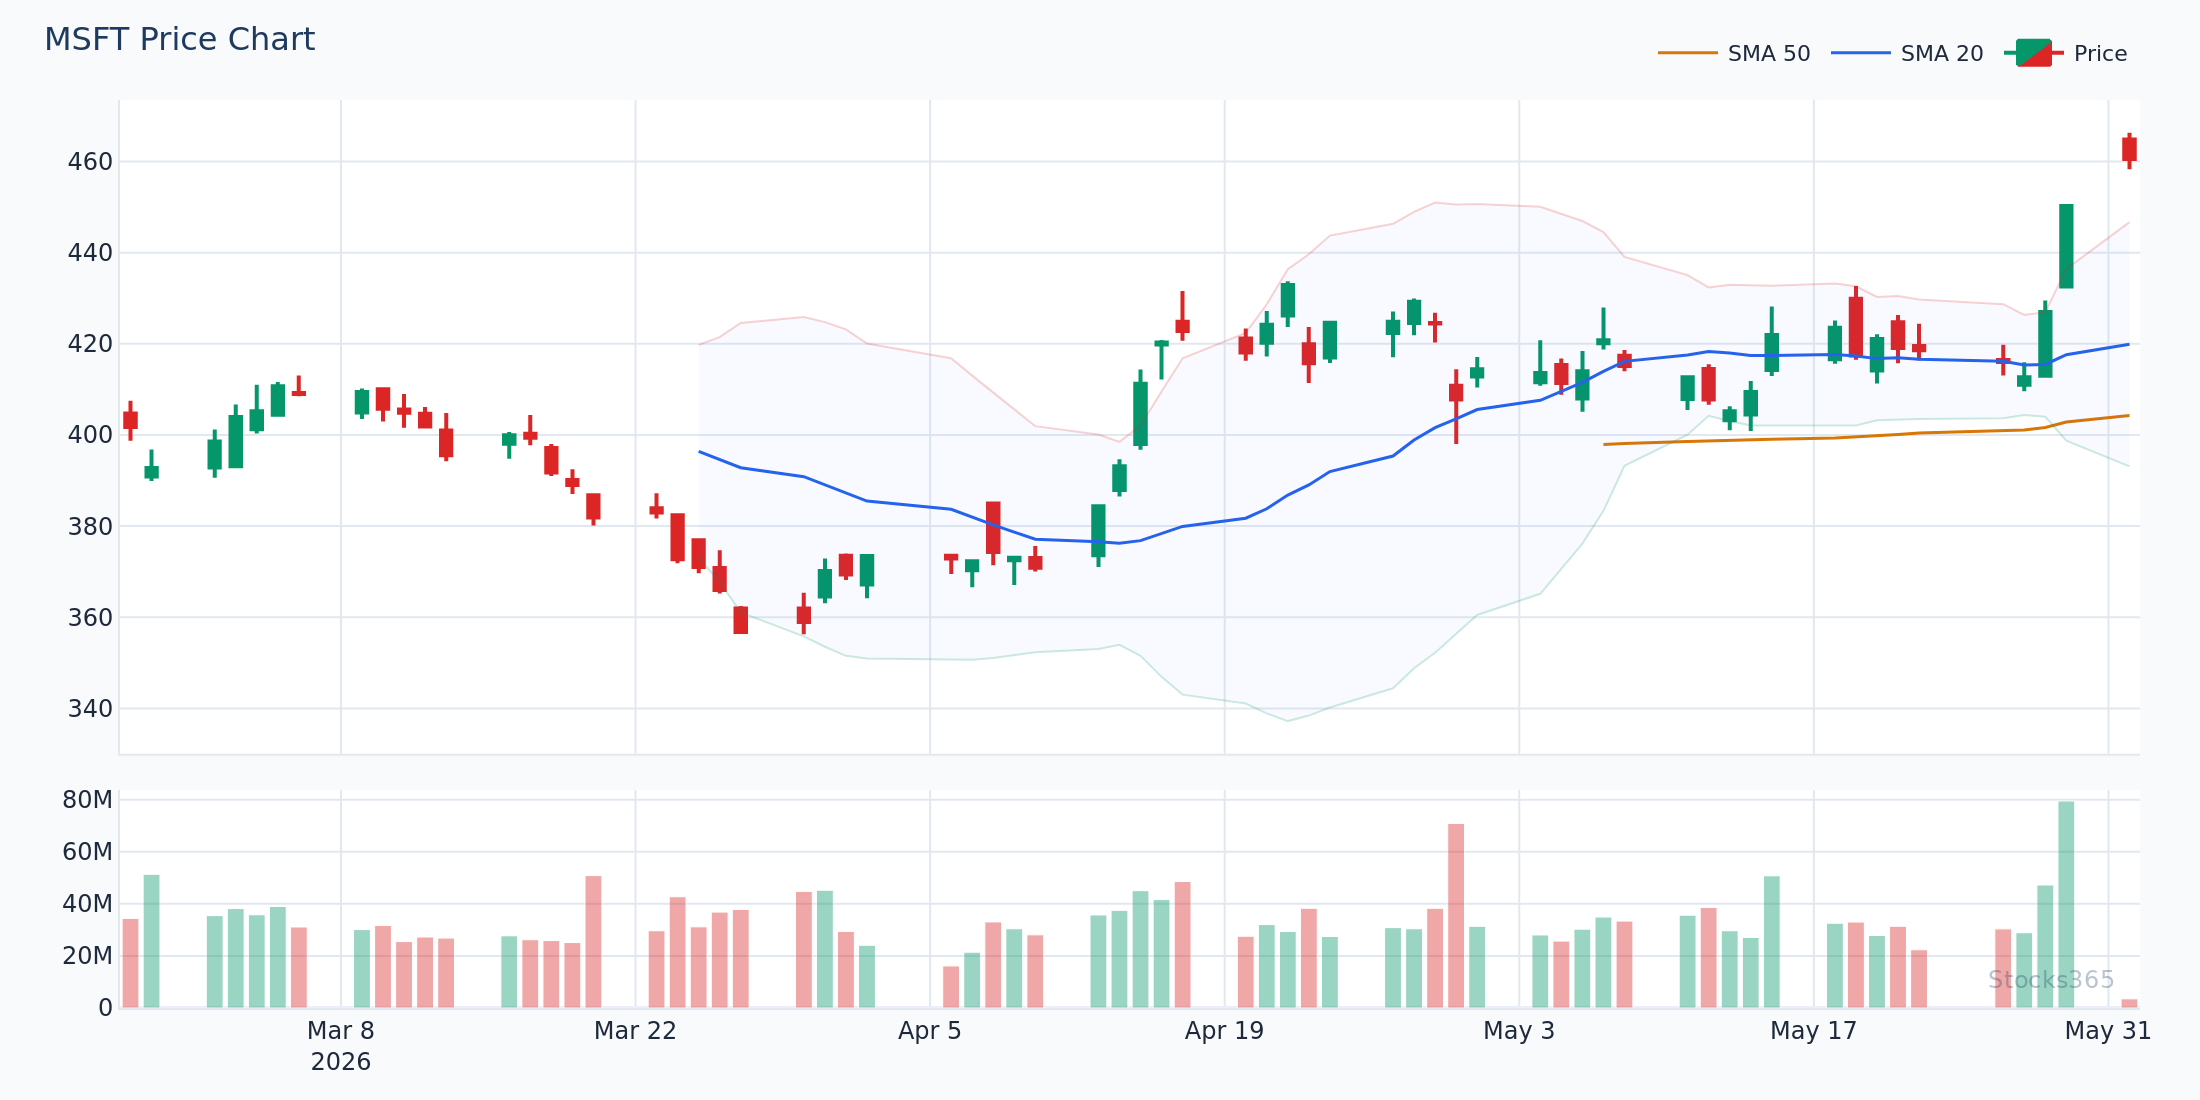
This chart highlights a breakout candle on MSFT where volume surged significantly above the 20-day average at the exact moment price closed above the upper Bollinger Band. Following a multi-week squeeze, this volume-confirmed breakout is the setup with the cleanest edge. The pattern typically resolves with a sustained move in the breakout direction over the following 5–10 sessions. The setup becomes invalid if the next session opens strongly and then closes back inside the band — that gap-and-fail pattern is a reliable warning to exit quickly.
Step 4 — Use Oscillators to Filter Band Signals
Bollinger Bands show volatility and relative price position. They don't measure momentum directly. That's where oscillators become essential partners.
The two most useful filters for Bollinger Band signals are RSI and the Stochastic Oscillator.
RSI as a Bollinger Band Filter
When price touches the lower Bollinger Band while RSI drops below 30, the setup has more structure than either signal alone. Both indicators are agreeing that price is stretched. But — and this is critical — RSI below 30 in a downtrend is normal. The reversal signal comes when RSI breaks back above 30 while price is still near the lower band. That divergence between recovering momentum and still-depressed price is where the real edge lives.
The RSI Trendline Strategy guide covers exactly this type of divergence-based signal, including how to draw trendlines directly on the RSI indicator for earlier entries. Worth reading before you start combining RSI with Bollinger Bands.
Stochastic + Bollinger Bands: The Double Overbought Setup
When price touches the upper Bollinger Band while the Stochastic Oscillator crosses above 80, some traders treat this as a high-probability short setup — the "double overbought" condition. The logic is intuitive. Both indicators agree price is stretched.
The data tells a more complicated story. Stocks365 analyzed 3,026 BB + Stochastic Double Overbought signals and found a 49.9% win rate with a profit factor of 0.91. Across all assets, this is a marginally losing strategy. The best results appear in crypto, where the win rate climbs to 58.0%. The worst results are in commodities, where the win rate collapses to 40.7%. Asset class selection matters enormously with this setup.
For more on reading the Stochastic Oscillator in detail, the step-by-step Stochastic guide covers the %K and %D crossover mechanics that matter most when combining with Bollinger Bands.
Step 5 — Identify the Market Regime Before Trading Any Signal
This is the step that separates profitable traders from the rest. Bollinger Band signals perform completely differently depending on whether the market is trending or ranging.
Trending regime: Use Bollinger Bands for continuation signals. Band walks, pullbacks to the middle SMA, and squeeze breakouts that align with the existing trend all have better odds.
Ranging regime: Use Bollinger Bands for mean reversion. Upper band touches and lower band touches have more relevance when price is oscillating within a defined range.
How do you identify the regime? Three approaches work well in combination:
- Check whether price is above or below the 20-SMA and 50-SMA — both sloping in the same direction signals a trend
- Look at ADX — readings above 25 suggest a trending environment, below 20 suggests range
- Review the longer-term Bollinger Band width trend — if band width has been expanding for weeks, the trend is active
The Golden Cross vs Death Cross guide provides an excellent framework for understanding when moving average relationships confirm a trend regime — directly complementing Bollinger Band analysis. And for multi-timeframe trend confirmation, the Triple Moving Average Strategy adds another layer of regime identification that pairs naturally with Bollinger Band setups.
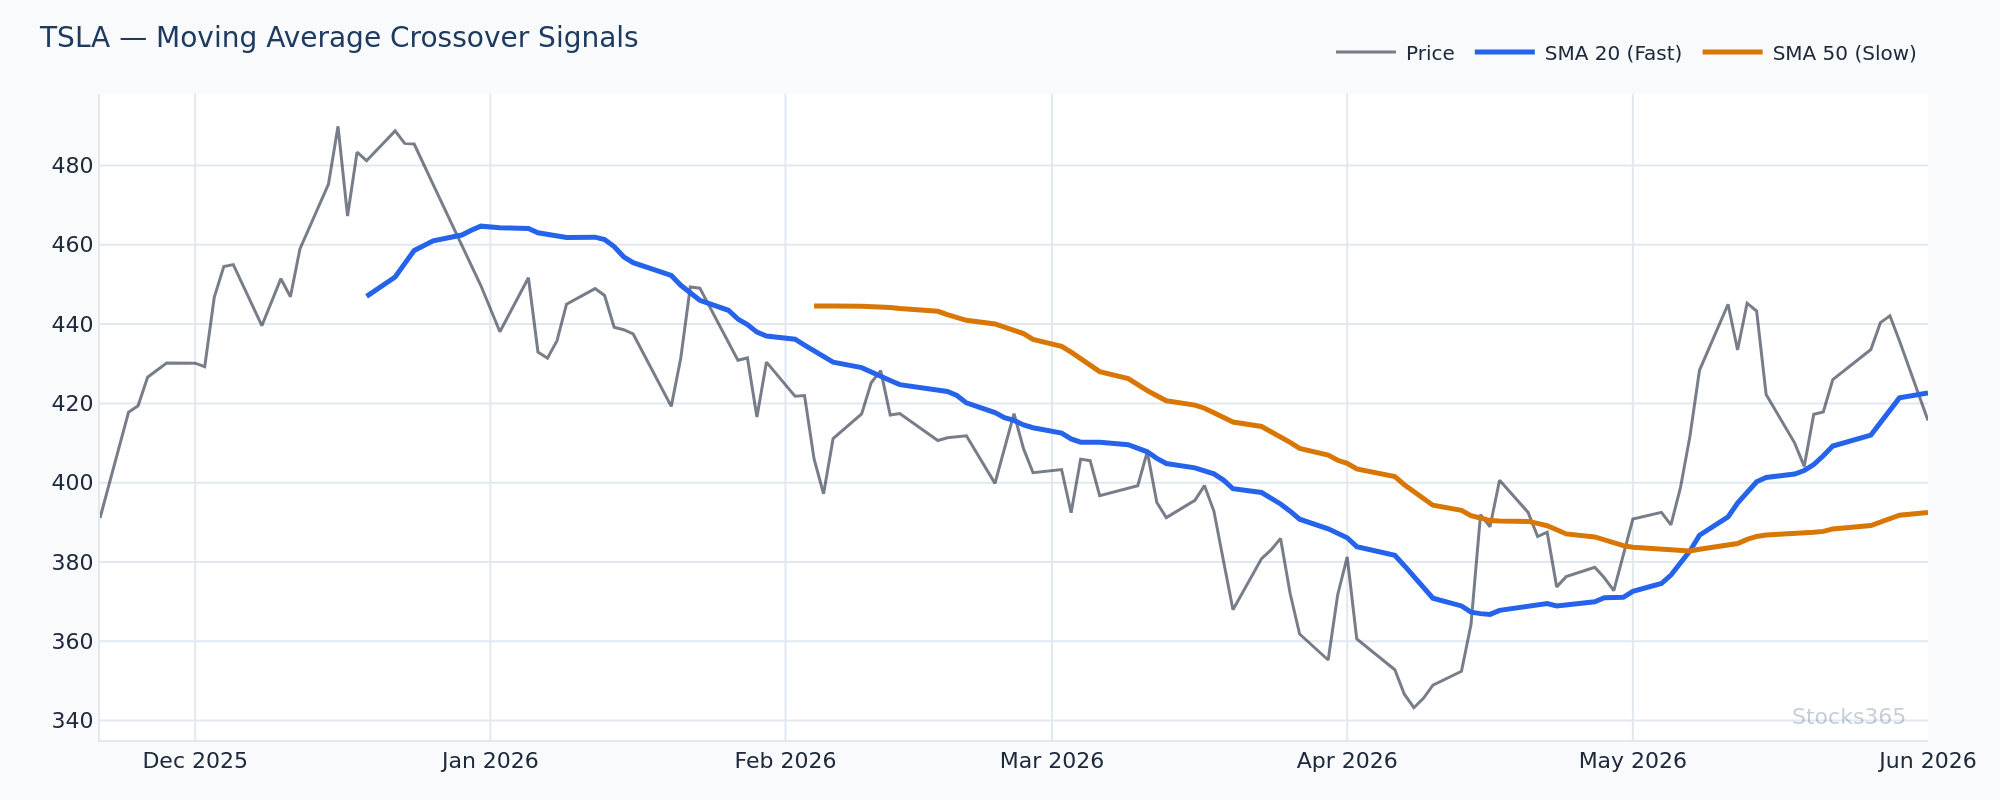
This chart shows TSLA with Bollinger Bands overlaid on price, with both the 20-SMA and 50-SMA visible. When both moving averages slope upward and price consistently holds above the middle Bollinger Band, the trending regime is confirmed. In this regime, lower band touches become pullback-buying opportunities rather than warning signs. The setup becomes invalid for trend continuation trades when price closes below the 50-SMA on above-average volume — that's the regime change signal that shifts the bias from bullish continuation to neutral or bearish.
Step 6 — Apply Bollinger Bands Across Different Asset Classes
The settings that work well for equities don't always translate to forex or crypto. Volatility profiles differ significantly across asset classes, and Bollinger Band parameters should reflect that.
Equities
The standard 20-period, 2 standard deviation setting works well for most large-cap stocks. For more volatile small-caps or high-beta growth stocks, some traders widen to 2.5 standard deviations to reduce false band touches.
Forex
Currency pairs trend strongly and mean-revert less frequently than stocks. Band touches in forex more often signal continuation, especially on the major pairs during high-liquidity sessions. The MACD in Forex guide shows how momentum confirmation tools layer onto this dynamic effectively.
Crypto
Crypto exhibits the widest volatility swings of any asset class. Standard settings produce frequent band touches that carry less meaning. Many experienced crypto traders use 2.5 or even 3 standard deviations, or focus exclusively on squeeze breakouts — the setup with the most consistent edge in crypto across our backtesting.
Bollinger Bands in Practice: Real Trade Setups
Theory means nothing without application. Here are four concrete setups, pattern-based and price-agnostic.
Setup 1: The Squeeze Breakout
Band width falls to a multi-month low. Price compresses inside a tight range. Volume dries up. Then: price breaks above the upper band (or below the lower band) on volume at least 1.5x average. Enter in the direction of the break. Target the first significant swing high or low beyond the breakout range. Stop below (or above) the middle SMA.
Setup 2: The Middle Band Pullback (Trending Market)
Price is trending higher, walking the upper band. A pullback brings price back to the middle SMA (20-period). RSI pulls back to the 40–50 zone. Volume contracts during the pullback. Price then closes back above the 20-SMA on rising volume. Enter long. This is the textbook "buy the dip in an uptrend" setup using Bollinger Bands as the framework.
Setup 3: The Double Bottom With Lower Band Tag
Price makes a low that tags or breaks the lower Bollinger Band. A rally follows. Price retests the prior low but the second low does NOT break the lower band (higher low on the band). RSI shows a higher low on the second touch (positive divergence). This is the W-bottom pattern described by John Bollinger himself — one of the highest-conviction mean-reversion setups the indicator produces.
For a real-world example of how these setups have played out historically, the Bollinger Bands Case Study on Apple Stock walks through multiple setups with detailed annotations — essential reading for seeing these patterns in a real market context.
Setup 4: The M-Top Reversal
Price makes a high that closes outside the upper Bollinger Band. A pullback follows. Price rallies again but the second high does NOT exceed the first high and does NOT close outside the upper band (lower high). Volume is lower on the second peak. RSI shows a lower high (negative divergence). This is the M-top — Bollinger's counterpart to the W-bottom, and a reliable warning of distribution and potential trend reversal.
View live signals built around these exact patterns on the Stocks365 signals dashboard, or check setup-specific analysis for individual names like AAPL signals.
What to Watch For
- Bollinger Squeeze on tech stocks: When band width drops below the 20th percentile of its six-month range on a large-cap tech name, the subsequent breakout frequently covers 2–3 ATR within 10 sessions. The direction of the first close outside the band — with volume confirmation — is your entry signal.
- Lower band touches in crypto after a 20%+ drawdown: When price tags the lower Bollinger Band following a significant drawdown and RSI simultaneously shows a higher low on a retest, the W-bottom setup has historically preceded sharp bounces in major cryptocurrencies. Watch for the %B to cross back above 0.20 as the trigger.
- Middle band rejections in a confirmed downtrend: When price rallies to tag the 20-SMA (middle Bollinger Band) from below in a downtrend and then closes back below it on above-average volume, the failed rally often initiates the next leg lower within 3–5 sessions.
- Band width expanding after a squeeze in forex majors: When a squeeze resolves in a major forex pair during a high-liquidity session (London or New York open), the initial move is frequently amplified by institutional order flow. First-hour breakouts aligned with the daily trend bias carry the cleanest follow-through.
- Double overbought setups in crypto specifically: When price closes above the upper Bollinger Band while the Stochastic Oscillator crosses above 80, the setup has shown a 58.0% win rate in crypto in Stocks365 backtesting — meaningfully higher than the same setup in other asset classes. Limit this setup to crypto, and confirm with declining volume on a second upper-band tag.
How Stocks365 Uses Bollinger Bands
Bollinger Bands are one of 12+ technical indicators integrated into the Stocks365 Trust Score system. Within that framework, Bollinger Band signals contribute specifically to volatility regime scoring and indicator agreement weighting.
When the Bollinger Band signal (squeeze breakout, band touch, or band walk) aligns directionally with signals from momentum indicators like RSI and MACD, the Trust Score for that signal increases — reflecting higher indicator agreement. When Bollinger Bands conflict with momentum (e.g., price at upper band but RSI showing divergence), the Trust Score adjusts downward, flagging lower-conviction setups.
The volatility regime component uses real-time band width percentile rank to classify each signal as emerging from a low-volatility (squeeze) or high-volatility (expansion) environment. Squeeze breakout signals receive additional regime context weighting, reflecting their superior profit factor in our backtesting. View live Trust Score signals on the Stocks365 dashboard.
Key Takeaways
- Read band width first. Narrow bands signal a coiling market ready to move. Wide bands signal volatility already in play. The regime drives the strategy.
- Band touches are not automatic signals. In trending markets, upper band touches often signal continuation. In ranging markets, they often signal mean reversion. Context is everything.
- The squeeze breakout is the most data-supported setup. Across 14,266 signals in Stocks365 backtesting, it's the only Bollinger Band configuration with a profit factor above 1.0.
- Volume confirms everything. A breakout without volume is a hypothesis. A breakout with 1.5x+ average volume is a signal.
- Oscillator confirmation reduces false signals. RSI and Stochastic add momentum context that Bollinger Bands alone cannot provide.
- Asset class matters. The same Bollinger Band setup produces materially different results across equities, crypto, forex, and commodities. Adjust expectations — and parameters — accordingly.
- W-bottoms and M-tops are the highest-conviction reversal patterns within the Bollinger Band framework. Learn to identify them before chasing band touches.
Frequently Asked Questions
What is the best setting for Bollinger Bands?
The standard setting — 20-period SMA with 2 standard deviations — works well for most equity and index trading on daily charts. For crypto, many traders use 2.5 standard deviations to account for higher inherent volatility and reduce false band touches. For shorter-term intraday trading, some use a 10-period or 15-period SMA. The key principle: if you're seeing price touch the bands every few candles, widen the standard deviations. If price rarely reaches the bands, tighten them.
Do Bollinger Bands work in all market conditions?
Different Bollinger Band strategies work in different conditions — not all of them work everywhere. Squeeze breakout setups perform best in consolidating, low-volatility environments before a major move. Mean-reversion band touch strategies work best in ranging, choppy markets. Band walking and middle-band pullback strategies work best in clear trending conditions. The critical first step is always identifying the current market regime before selecting which Bollinger Band strategy to apply.
What is a Bollinger Band squeeze and how do I trade it?
A Bollinger Band squeeze occurs when the distance between the upper and lower bands narrows to historically low levels — typically measured as band width falling below the 20th percentile of the past six months. It signals that volatility has compressed and a significant move is approaching. To trade it: wait for the squeeze to resolve with a close outside the band on above-average volume (at least 1.5x the 20-day average), then enter in the direction of the breakout. Place your stop below the middle SMA for long entries, above it for short entries. Stocks365 backtesting of 14,266 squeeze breakout signals found a profit factor of 1.03 — the strongest result among all Bollinger Band setups analyzed.
Can Bollinger Bands be used alone, without other indicators?
Technically yes, but the results are weaker. Bollinger Bands measure volatility and relative price position — they don't directly measure momentum or trend direction. Without an oscillator like RSI or Stochastic to confirm momentum, and without volume analysis to confirm breakout conviction, band signals produce too many false positives. The data supports this: upper band touches alone carry a profit factor of 0.88 in Stocks365 backtesting. Add RSI divergence or volume confirmation and the statistical picture improves materially.
What is the difference between the %B indicator and Bollinger Band width?
%B measures where price is positioned within the bands — a value of 1.0 means price is at the upper band, 0.0 means price is at the lower band, and 0.5 means price is at the middle SMA. Values above 1.0 or below 0.0 mean price has broken outside the bands. Bollinger Band Width, by contrast, measures how wide the bands are — it's a volatility measure, not a price position measure. Use %B to identify band touches and breakouts precisely. Use Band Width to identify squeezes and expanding volatility regimes. Both are more precise than visually reading the bands on a chart.