
RSI Indicator: What It Is and Why Every Trader Needs to Understand It
The RSI indicator — Relative Strength Index — is one of the most widely used momentum oscillators in technical analysis. Developed by J. Welles Wilder Jr. in 1978, it measures the speed and magnitude of recent price changes to evaluate whether an asset is overbought or oversold. It plots a single line that oscillates between 0 and 100. Simple in theory. Endlessly nuanced in practice.
Most traders know it. Few use it correctly.
This guide covers everything: how RSI works, the best TradingView settings, strategy setups that are actually backed by data, common mistakes, and how Stocks365 integrates RSI into its signal intelligence system.
How the RSI Indicator Works: The Formula Explained
RSI measures the ratio of average gains to average losses over a defined lookback period — typically 14 periods. The formula:
RSI = 100 – [100 / (1 + RS)]
Where RS = Average Gain over N periods ÷ Average Loss over N periods
When average gains dominate, RSI climbs toward 100. When losses dominate, it falls toward 0. The standard interpretation places the overbought threshold at 70 and the oversold threshold at 30. Cross above 70 and the asset is considered extended to the upside. Drop below 30 and it's considered beaten down.
But thresholds alone are a beginner's game. The real edge lies in how RSI moves relative to price.
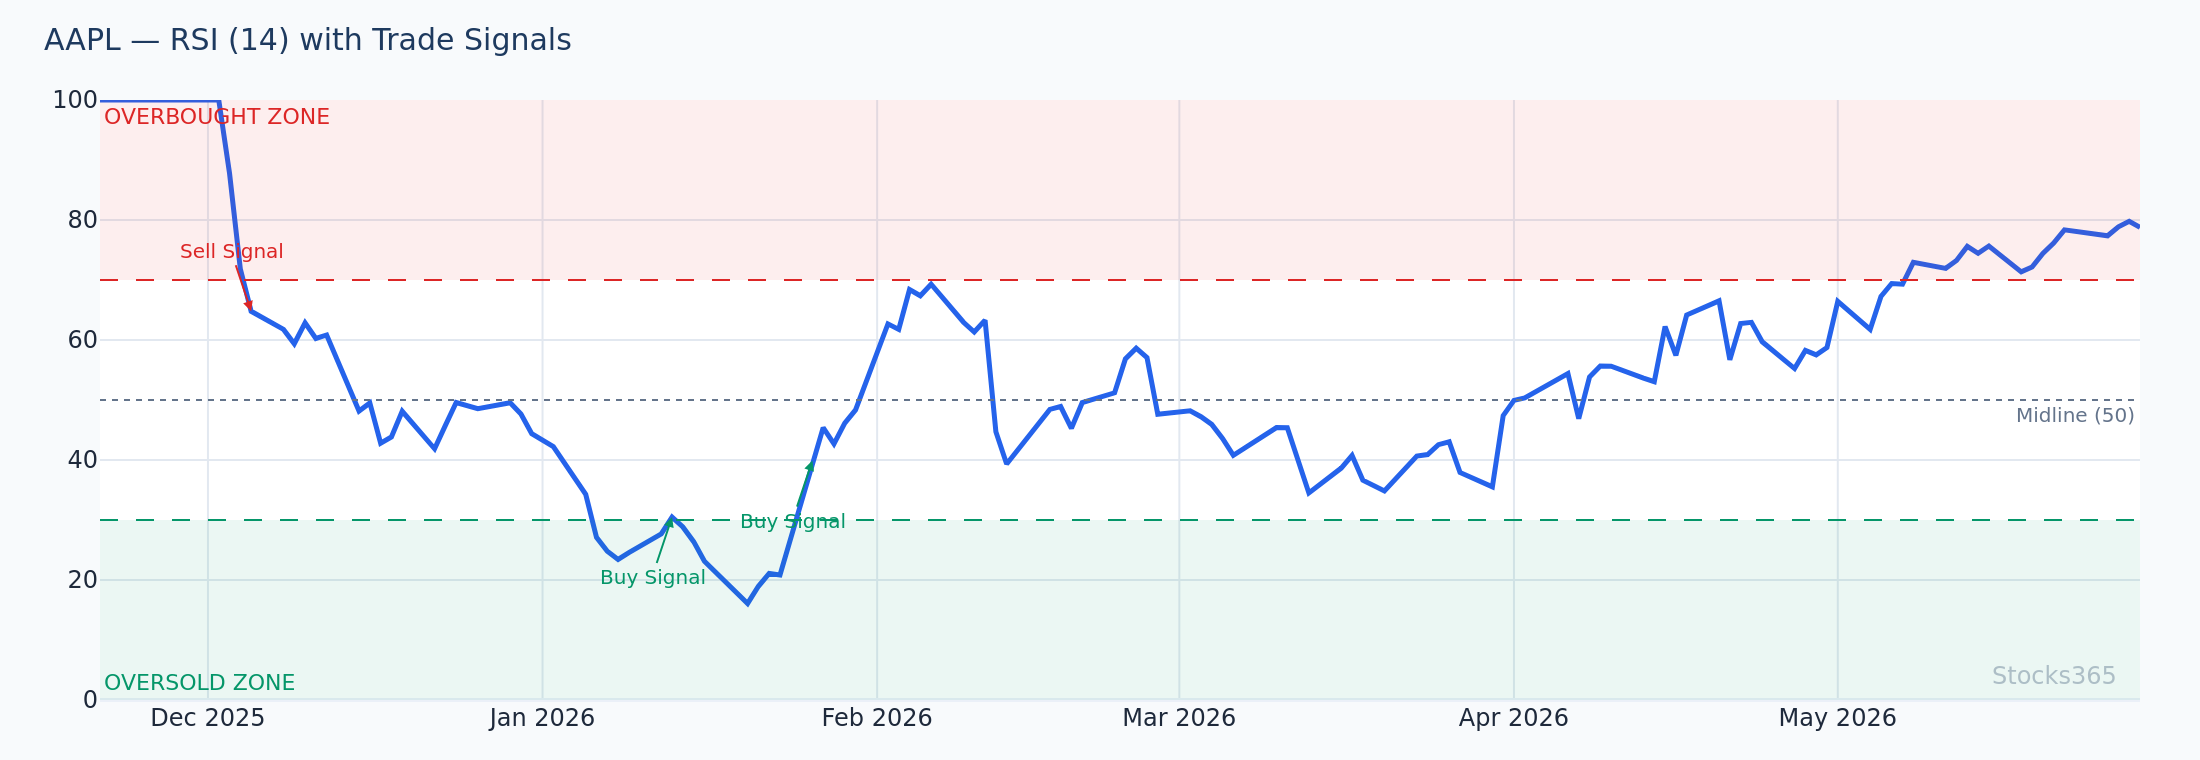
This chart shows RSI oscillating across multiple market conditions on AAPL. Notice how RSI can hover above 70 for extended periods during strong uptrends, and how a confirmed cross back below 70 — not the initial touch — tends to mark the more reliable turning point. An RSI bounce from the 30 zone that holds above that level on the next test is a classic setup worth monitoring closely.
RSI Indicator on TradingView: Settings, Setup, and How to Use It
How to Add RSI on TradingView (Free)
TradingView is the platform most traders use to access the RSI indicator — and it's available on the free tier. Here's how to set it up:
- Open any chart on TradingView
- Click the Indicators button at the top of the chart
- Search for "RSI" — select "Relative Strength Index" by TradingView
- The indicator loads in a separate pane below your price chart
No paid subscription required. The built-in RSI on TradingView is fully functional and supports all the customizations serious traders need.
Best RSI Indicator TradingView Settings
The default 14-period RSI is the industry standard for a reason — it balances sensitivity with reliability. But the right settings depend on your timeframe and trading style.
- RSI Length 14 (default): Best for swing traders and position traders on daily charts. Smooth, reliable, fewer false signals.
- RSI Length 9: More sensitive. Better for short-term traders on 1H–4H charts. Generates more signals, more noise.
- RSI Length 21–25: Slower. Used by longer-term traders who want to filter out minor fluctuations. Fewer signals, higher conviction.
- Overbought/Oversold Levels: For trending markets, adjust to 80/20 instead of 70/30. This reduces false signals in strong trends.
- Source: Default is "close." Keep it unless you have a specific reason to change.
On TradingView, you can also add a moving average directly to the RSI pane — a 9-period EMA of the RSI line acts as a signal line, similar to MACD. This is a powerful addition for spotting momentum shifts early.
RSI on Trading 212
Trading 212 includes RSI as a built-in indicator on its charting interface. The setup process mirrors TradingView: navigate to the indicators panel, search for RSI, and apply it to your chart. The default settings are 14-period with 70/30 levels. For traders using Trading 212's CFD or invest accounts, RSI works the same way across timeframes — the interpretation doesn't change based on the platform.
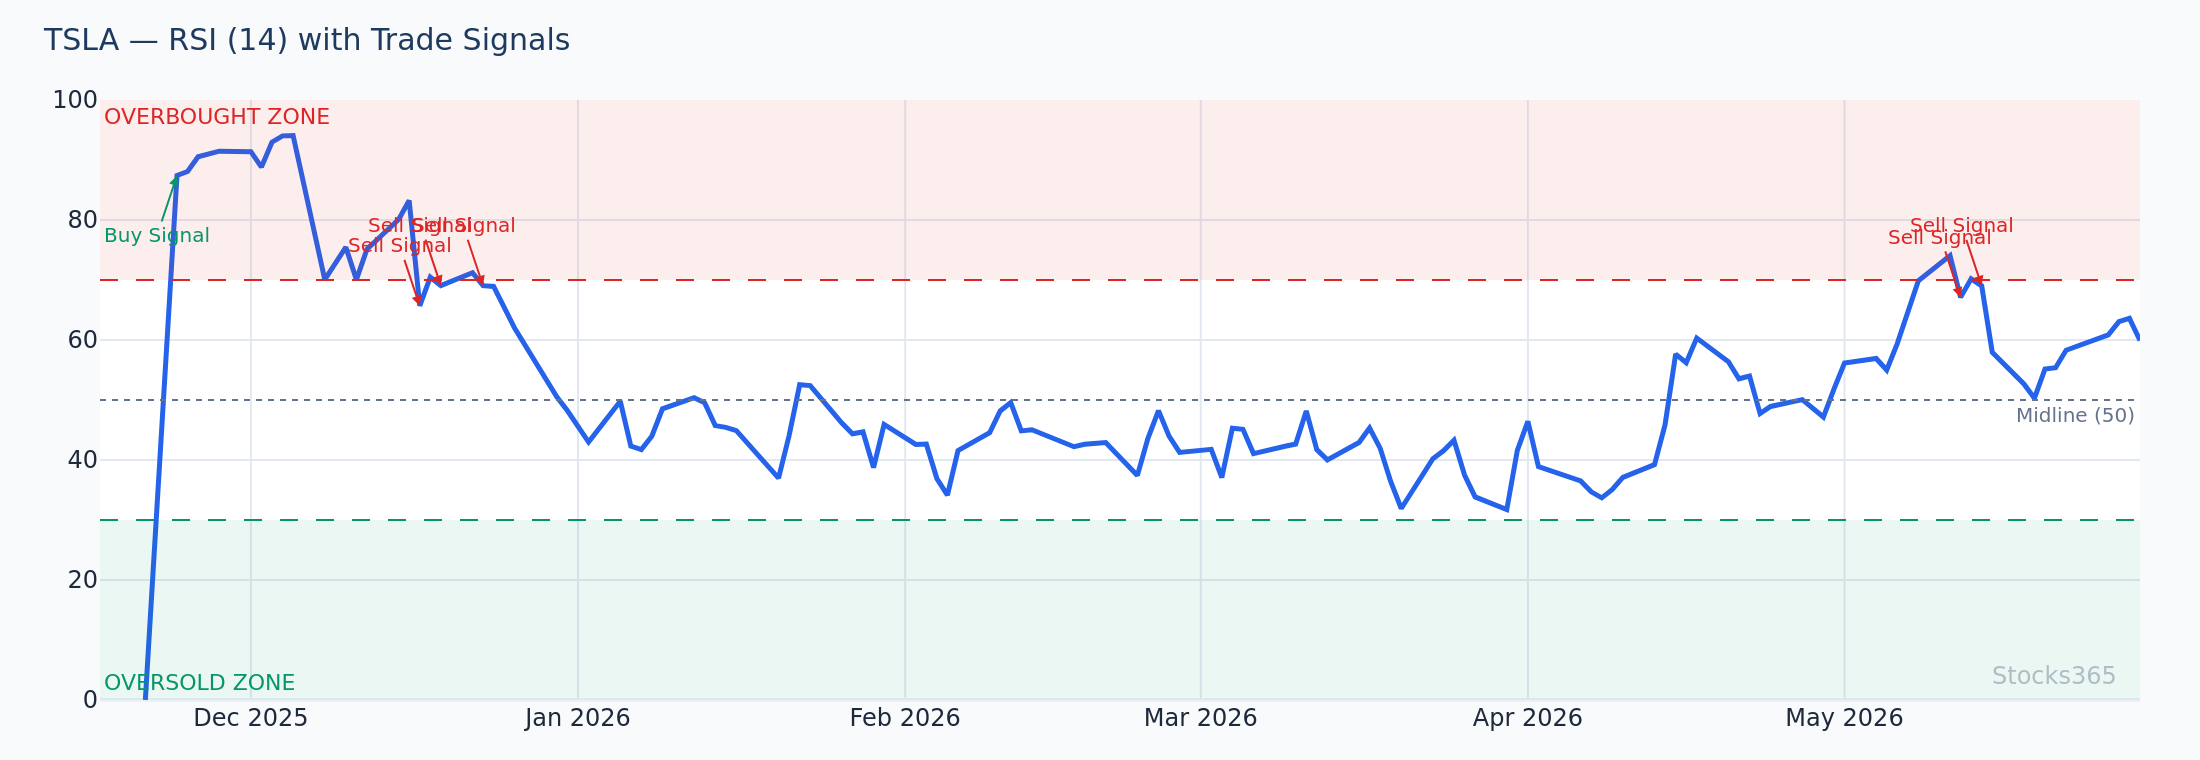
On this TSLA chart, watch for moments where price makes a new high but RSI prints a lower high — classic bearish divergence. That divergence doesn't guarantee reversal, but it signals weakening momentum and puts the setup on alert. Confirmation comes when RSI breaks below its own recent swing low, not before.
The Best RSI Trading Strategies That Actually Work
1. RSI Oversold Bounce Strategy
This is the highest-conviction RSI setup in our data. Stocks365 backtested 2,153 RSI Oversold Bounce signals and found a 56.9% win rate with a profit factor of 1.61 over a 10-day holding period. Broken down by asset class, stocks outperformed significantly at 62.9%, while commodities lagged at 43.5%. If you trade this setup, stocks are the right arena.
The setup:
- RSI(14) drops below 30 on a daily chart
- Price shows a bullish candle pattern — a hammer, engulfing candle, or pin bar — while RSI is in the sub-30 zone
- RSI crosses back above 30 on the following session
- Entry on the close of the session that recrosses 30, or on a pullback that holds above 30
- Invalidated if RSI drops back below 30 after the entry signal
The cross back above 30 is the trigger. Not the initial dip below it.
2. RSI Overbought Reversal Strategy
This is where most traders get burned. Our analysis of 3,679 RSI Overbought Reversal signals across all asset classes produced only a 47.0% win rate with a profit factor of 0.85 — meaning it loses money on average when traded blindly. The notable exception: crypto, where this setup hit 65.2%. Commodities were the worst at 40.7%.
The lesson: don't short every RSI 70 touch. That's a losing strategy. Instead, wait for RSI to break back below 70 from an overbought state, with price showing a corresponding rejection candle or bearish structure break. The cross back below 70 is the signal — not the approach toward it.
3. RSI Divergence Strategy
Divergence is where RSI reveals what price hides. Bullish divergence: price makes a lower low, RSI makes a higher low. Bearish divergence: price makes a higher high, RSI makes a lower high. Both signal momentum exhaustion before price confirms it.
For a deep dive into drawing accurate divergence lines directly on the RSI pane, see our guide on the RSI Trendline Strategy — it covers the exact technique for identifying valid divergence setups and filtering false ones.
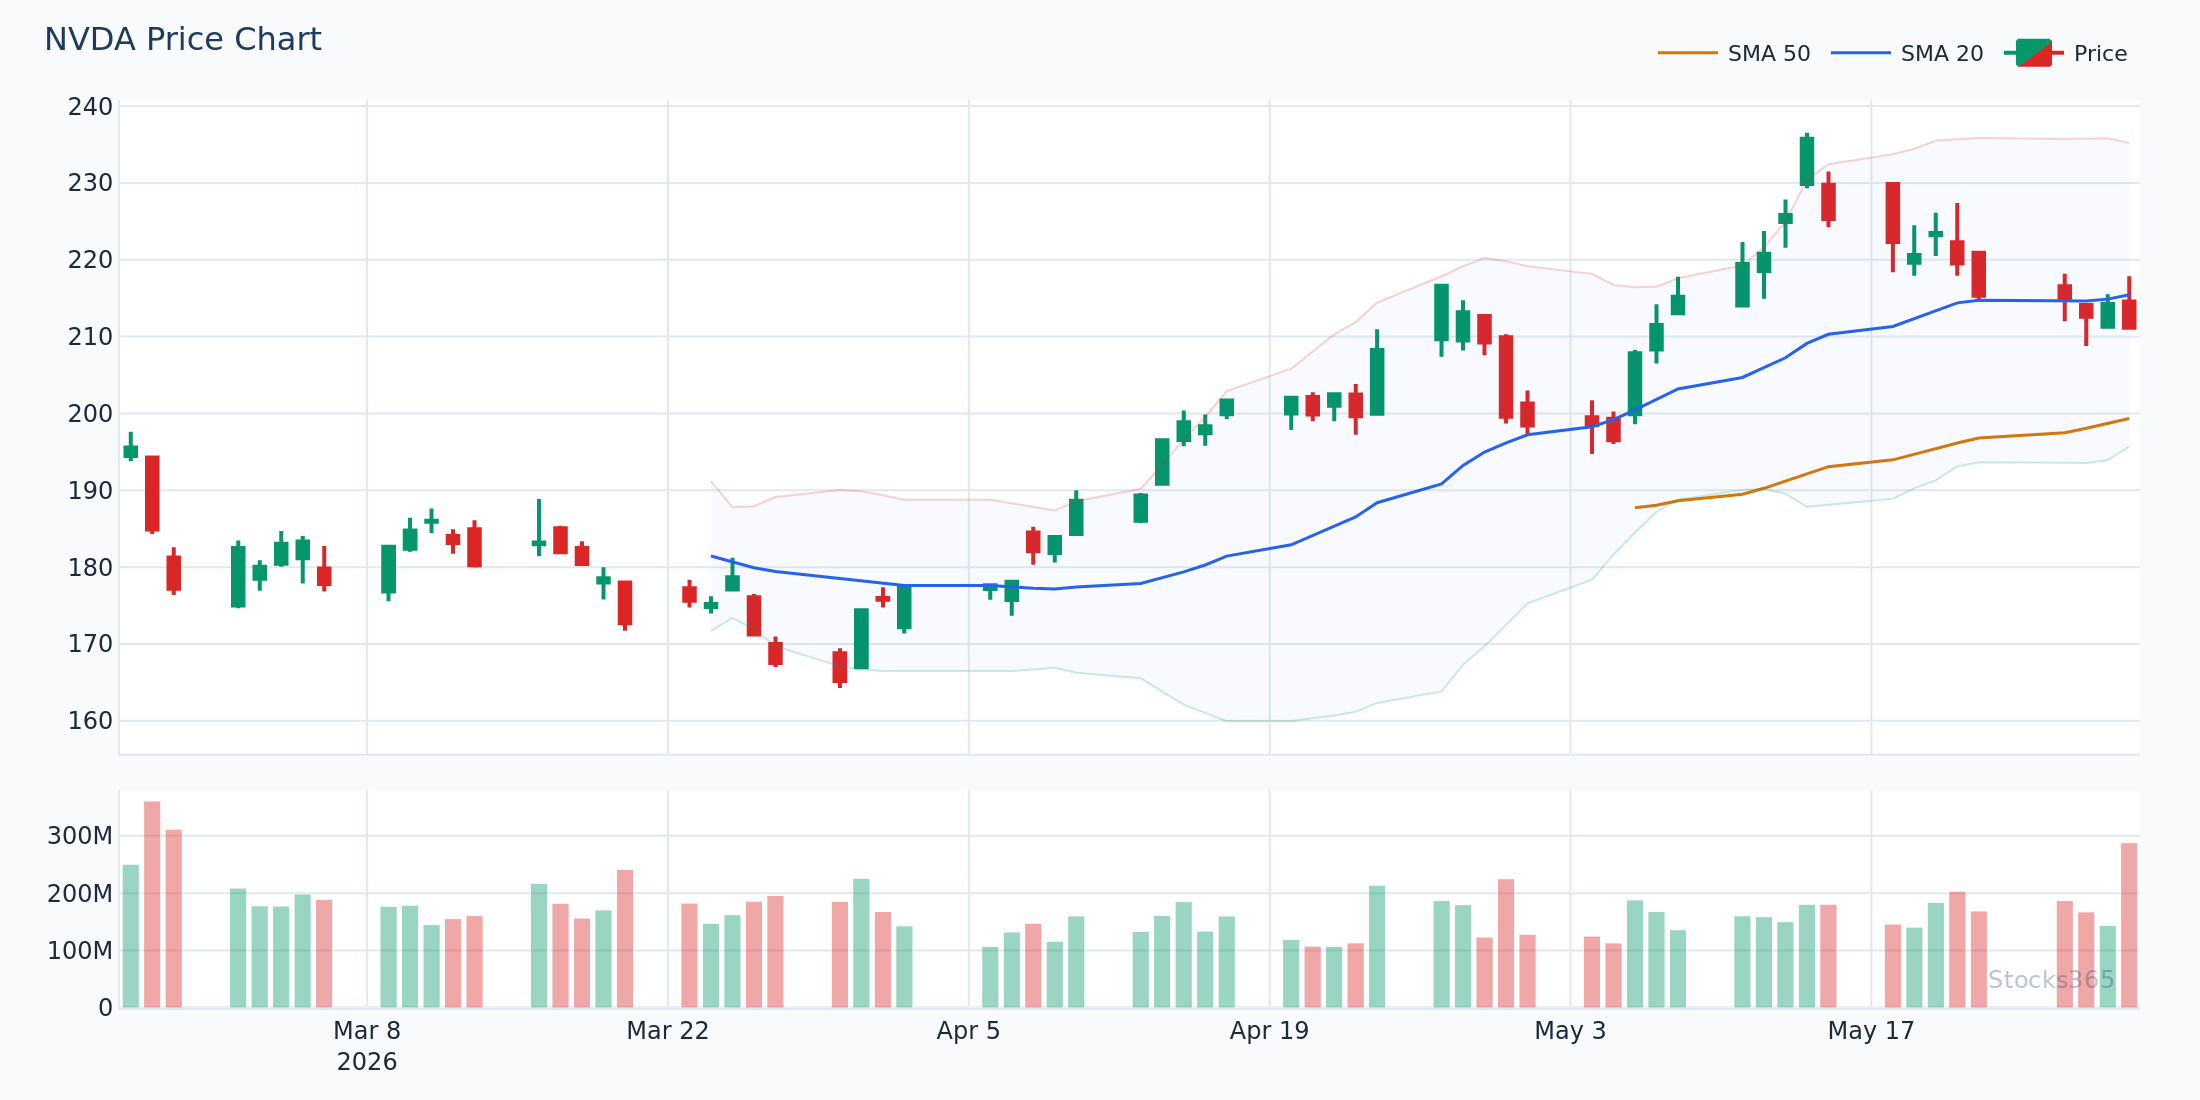
On NVDA, look for sequences where the price chart shows higher highs into resistance while the RSI pane simultaneously prints lower highs. That gap between price action and momentum is the signal. The pattern completes — and becomes tradeable — only when price closes below the most recent swing low, confirming the divergence rather than leaving it theoretical.
4. RSI Mid-Line Cross (50 Level) Strategy
The 50 level doesn't get enough attention. RSI crossing above 50 signals that average gains are now outpacing average losses — a momentum shift to the bullish side. Crossing below 50 flips that narrative. Used in combination with a moving average crossover, the 50-level RSI cross acts as a momentum confirmation filter that dramatically cuts down on false entries.
The rule: only take long setups where RSI is above 50. Only take short setups where RSI is below 50. This single filter improves the quality of almost every other strategy you layer on top.
Here's What Most Traders Get Wrong About the RSI Indicator
Most traders treat RSI 70 as an automatic sell signal. In a trending market, RSI stays above 70 for days, weeks — sometimes longer. Selling the moment RSI touches 70 means selling into the strongest part of a trend. The edge isn't at 70 on the way up. The edge is watching RSI break back below 70 after an extended overbought period. That break, combined with a bearish price structure, is the actual signal. The touch is just context.
The same logic applies in reverse. RSI below 30 doesn't mean buy immediately. It means an asset is oversold — which in a genuine downtrend can persist much longer than expected. The buy signal is the recovery above 30, not the initial breach below it.
Stop reacting to levels. Start reacting to crosses.
RSI Combined With Other Indicators: More Powerful Setups
RSI + Moving Averages
RSI alone is good. RSI with a trend filter is better. When price is trading above its 50-day or 200-day moving average, RSI oversold signals carry significantly more weight — you're buying dips in an uptrend rather than catching falling knives. The Triple Moving Average Strategy is an excellent complement here, using three MAs to confirm trend direction before acting on RSI signals.
RSI + MACD
Both RSI and MACD are momentum-based, but they measure different things. RSI measures speed; MACD measures the relationship between two moving averages. When RSI crosses above 50 and MACD simultaneously crosses above its signal line, the confluence is powerful. For traders applying this to currency pairs, the MACD in Forex Trading guide covers exactly how to stack these signals for higher-probability entries.
RSI + Bollinger Bands
When Bollinger Bands compress into a squeeze and RSI simultaneously sits near 50, the stage is set for a high-momentum breakout. The RSI direction at the point of breakout — above or below 50 — helps confirm which direction the expansion is more likely to travel. The Moving Average + Bollinger Bands strategy guide covers this squeeze-and-break setup in full detail.
RSI vs. Stochastic Oscillator
RSI and the Stochastic Oscillator are frequently compared because both are momentum oscillators with overbought/oversold zones. The key difference: Stochastic is more sensitive and reacts faster to short-term price swings, while RSI provides smoother, more reliable signals over slightly longer horizons. For traders who want to understand both tools deeply, the Stochastic Oscillator formula guide and the step-by-step reading guide are worth pairing with this article.
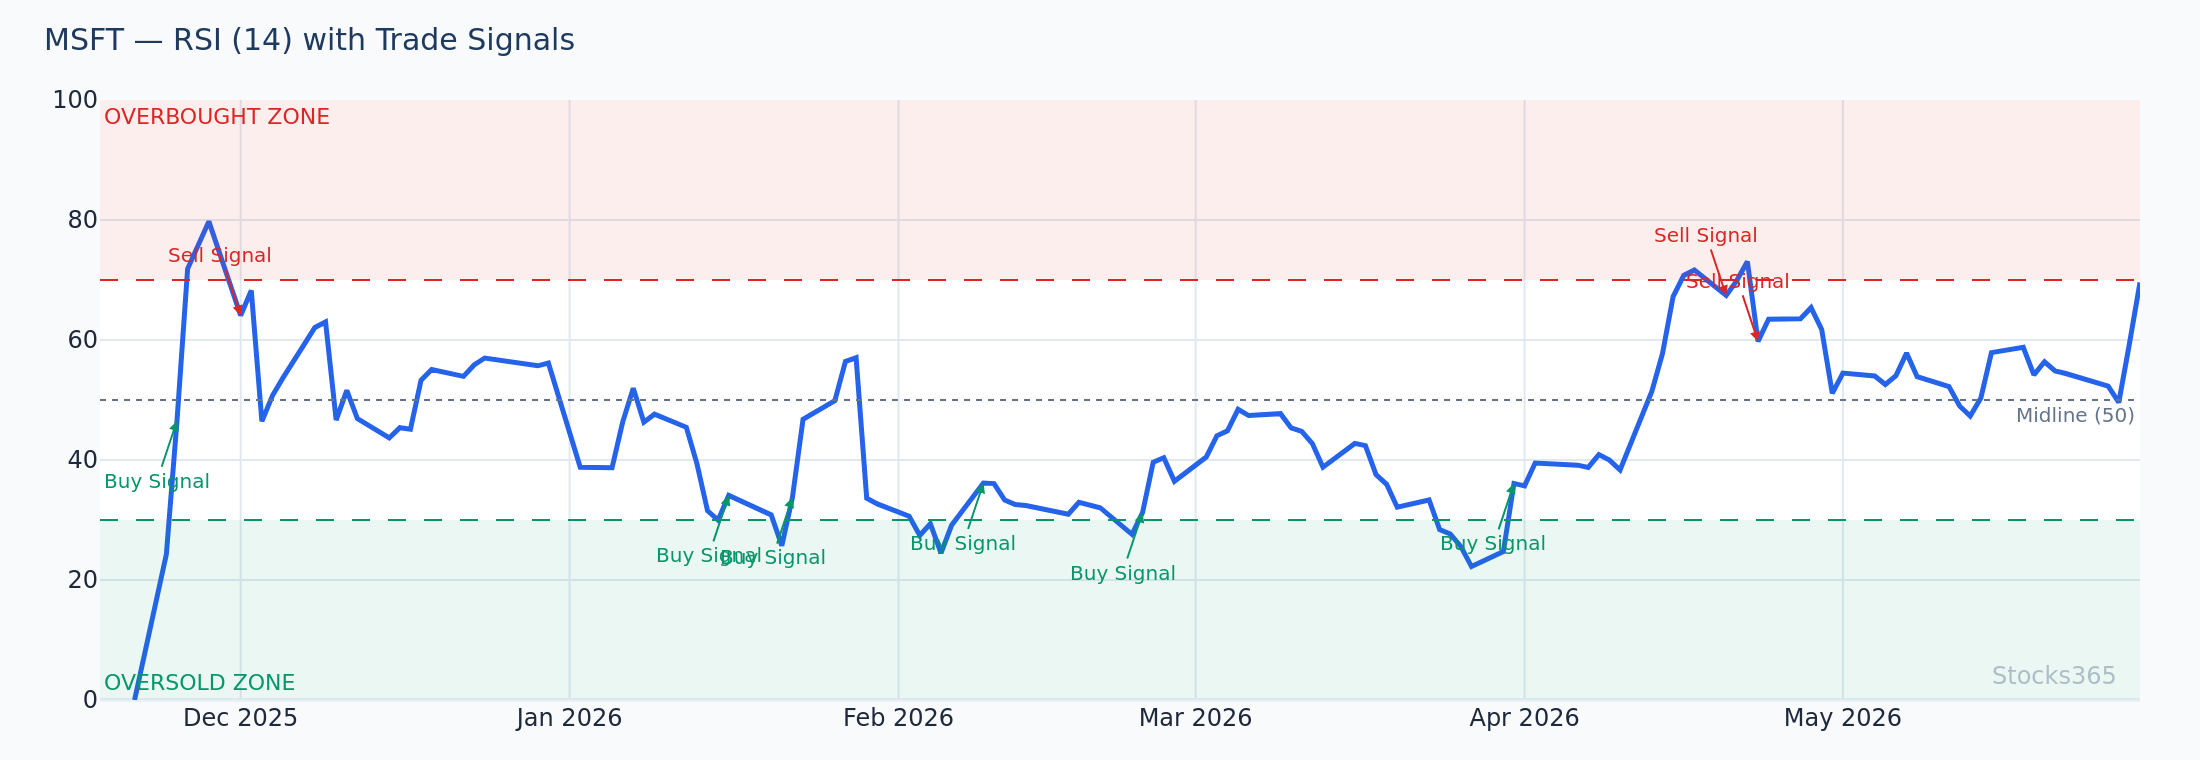
This MSFT chart illustrates the 50-level RSI dynamic clearly. During sustained uptrends, RSI bounces off the 50 zone rather than breaking below it — each hold above 50 is a continuation signal. A decisive break below 50, especially when accompanied by a bearish close on the price chart, shifts the momentum narrative and puts the uptrend in question. Bullish re-entries only resume when RSI recovers and holds above 50 again.
Is RSI a Reliable Indicator? The Honest Answer
RSI is reliable when used correctly and unreliable when misused. That's the honest answer. No single indicator predicts the future. What RSI does well: it quantifies momentum, identifies potential exhaustion points, and reveals divergences between price action and underlying strength. What it does poorly: it generates false signals in ranging markets, it can remain overbought or oversold far longer than expected in trending environments, and it tells you nothing about volume or market structure on its own.
The traders who dismiss RSI as unreliable are usually the ones who used it in isolation with no trend context, no confirmation filter, and no understanding of which setups have positive expectancy vs. negative.
Context is everything. RSI is a lens, not a crystal ball.
For reference, our research dashboard breaks down RSI signal performance across asset classes, timeframes, and market regimes — so you can see exactly where it earns its edge and where it doesn't.
What Is a Good RSI Reading?
There's no universally "good" RSI reading — it depends entirely on what you're looking for and which market you're trading.
- RSI above 50 in an uptrend: Bullish momentum is intact. Dips to the 40–50 zone are potential buy zones.
- RSI below 30: Oversold. Not a buy signal by itself, but a zone to watch for reversal setups.
- RSI above 70: Overbought. In trending markets, this is normal. In ranging markets, it signals potential reversal.
- RSI at 50 following a downtrend: This is the critical test. If RSI stalls and reverses at 50 after a recovery, the downtrend is reasserting itself. If it breaks above 50 cleanly, momentum has shifted.
The best RSI reading to trade isn't a number — it's a pattern. Cross above 30. Break below 70. Divergence on a new high. 50-level hold in a trend. Those are the reads worth acting on.
What to Watch For
- RSI oversold bounces on large-cap stocks: When RSI(14) dips below 30 on a daily chart and then crosses back above it within 1–3 sessions, look for a confirming bullish candle. This setup has the strongest historical edge in equities — particularly in blue-chip names where mean reversion tendencies are well established.
- Bearish divergence after parabolic moves: When an asset has rallied 30%+ in a short window and RSI starts printing lower highs while price continues higher, the divergence is a momentum warning. Watch for price to close below the most recent swing low as confirmation — that's when the pattern activates.
- RSI 50-level rejections in downtrends: In established downtrends, RSI relief rallies that stall and reverse at the 50 zone — without ever reaching overbought territory — are high-probability continuation setups. The failure to reach 70 signals that buying pressure never fully recovered.
- RSI squeeze setup pre-breakout: When RSI consolidates tightly between 45 and 55 for 5+ sessions while price also compresses, the next directional move often comes with RSI breaking cleanly above 60 or below 40. The RSI break often precedes the price breakout by 1–2 candles.
- Crypto RSI overbought reversals post-extended rally: Our data shows crypto produces the strongest overbought reversal signals (65.2% win rate) — notably higher than other asset classes. After a sustained crypto rally where RSI has been above 70 for an extended period, the cross back below 70 deserves serious attention as a potential short or de-risk trigger.
How Stocks365 Uses the RSI Indicator
RSI is one of 12+ indicators integrated into the Stocks365 Trust Score system. Within the framework, RSI contributes to two scoring dimensions: momentum agreement and regime classification.
On the momentum side, RSI readings are cross-referenced against price structure and volume to determine whether a signal has momentum confirmation or is fading. An oversold RSI reading with rising volume carries more weight than one accompanied by declining volume — the system weights accordingly.
On the regime side, RSI's position relative to the 50 level helps the system classify whether a given asset is in a bullish, bearish, or neutral momentum regime. This classification directly influences how aggressively the Trust Score weights other bullish or bearish signals stacked on top of it.
When you check a signal on the Stocks365 dashboard — for example, the AAPL signal page — the RSI component is visible within the indicator breakdown, alongside its contribution to the overall Trust Score. This gives traders full transparency into what's driving each signal, not just the headline recommendation.
Key Takeaways
- RSI measures momentum — not price direction. It shows how fast an asset is moving, not where it's going.
- The standard 14-period RSI with 70/30 levels is the best starting point for daily chart traders. Adjust length for your timeframe.
- RSI crosses matter more than levels. The cross back above 30 or below 70 is the tradeable event — not the touch itself.
- RSI Oversold Bounce is the highest-conviction setup in our backtested data: 56.9% win rate, profit factor 1.61, strongest in stocks at 62.9%.
- RSI Overbought Reversal trades blindly lose money on average (47.0% win rate, 0.85 profit factor). Use confirmation filters or focus on crypto where the edge is clearest.
- RSI divergence is a leading signal — it warns of exhaustion before price confirms it. Always wait for price confirmation before entering.
- The RSI 50 level acts as a trend filter. Above 50 = bullish momentum. Below 50 = bearish. Use it to filter every other setup you trade.
- Combine RSI with moving averages, MACD, or Bollinger Bands for higher-probability confluence entries.