
RSI Trading Strategy: Build a Complete Swing Trading System
The RSI trading strategy remains one of the most reliable and widely-used approaches in modern technical analysis — and for good reason. When applied correctly, the Relative Strength Index gives swing traders a repeatable, rules-based framework for identifying high-probability entries, managing risk, and timing exits with precision.
But here's the problem most traders face: they learn the basics of RSI, slap it on a chart, and start buying every time it dips below 30. That approach fails. Consistently profitable RSI trading requires a complete system — one that combines signal confirmation, trend alignment, risk management, and intelligent position sizing.
This guide builds that system from the ground up. Whether you're new to momentum indicators or looking to sharpen an existing strategy, you'll walk away with a fully operational RSI swing trading framework ready for real-market application in 2026.
New to RSI? Start with our Complete Beginner's Guide to RSI before diving into strategy-level content.
Why RSI Is the Foundation of Swing Trading Strategies
Swing trading operates in the space between short-term noise and long-term trend following — typically holding positions for two to ten days. In that window, momentum is king. You need to know when a move is exhausted and when fresh momentum is building. RSI measures both.
Developed by J. Welles Wilder Jr., the RSI oscillates between 0 and 100, reflecting the ratio of recent gains to recent losses over a defined lookback period. For a full breakdown of the math, see our article on How RSI Is Calculated: Formula Explained Step by Step.
What makes RSI uniquely suited to swing trading is its dual utility:
- Momentum confirmation: RSI above 50 confirms bullish momentum; below 50 confirms bearish pressure.
- Overbought/oversold detection: Extreme readings (above 70 or below 30) flag potential reversals.
- Divergence signals: Price-RSI divergences often precede significant trend changes before they're visible on the price chart alone.
Setting Up Your RSI for Swing Trading
Choosing the Right RSI Period
The default 14-period RSI is a solid starting point for most swing traders, but it's not universal. The right setting depends on your timeframe and the volatility profile of your instruments.
- 9-period RSI: More sensitive, generates more signals — suitable for active swing traders on the daily chart.
- 14-period RSI: Balanced signal frequency and reliability — the standard for most strategies.
- 21-period RSI: Smoother, fewer false signals — better for higher-conviction, lower-frequency setups.
For a complete breakdown of how different period settings perform across market conditions, read our guide on RSI Settings: Master the Best Period for Your Strategy.
Timeframe Selection for Swing Traders
Most professional swing traders use a multi-timeframe approach:
- Weekly chart: Define the macro trend. Is the weekly RSI above or below 50?
- Daily chart: Primary signal timeframe. This is where most entries are triggered.
- 4-hour chart: Fine-tune entry timing and reduce slippage on the entry point.
The rule is simple: only take RSI buy signals on the daily chart when the weekly RSI is above 50 (bullish macro context). Only take short signals when the weekly RSI is below 50.
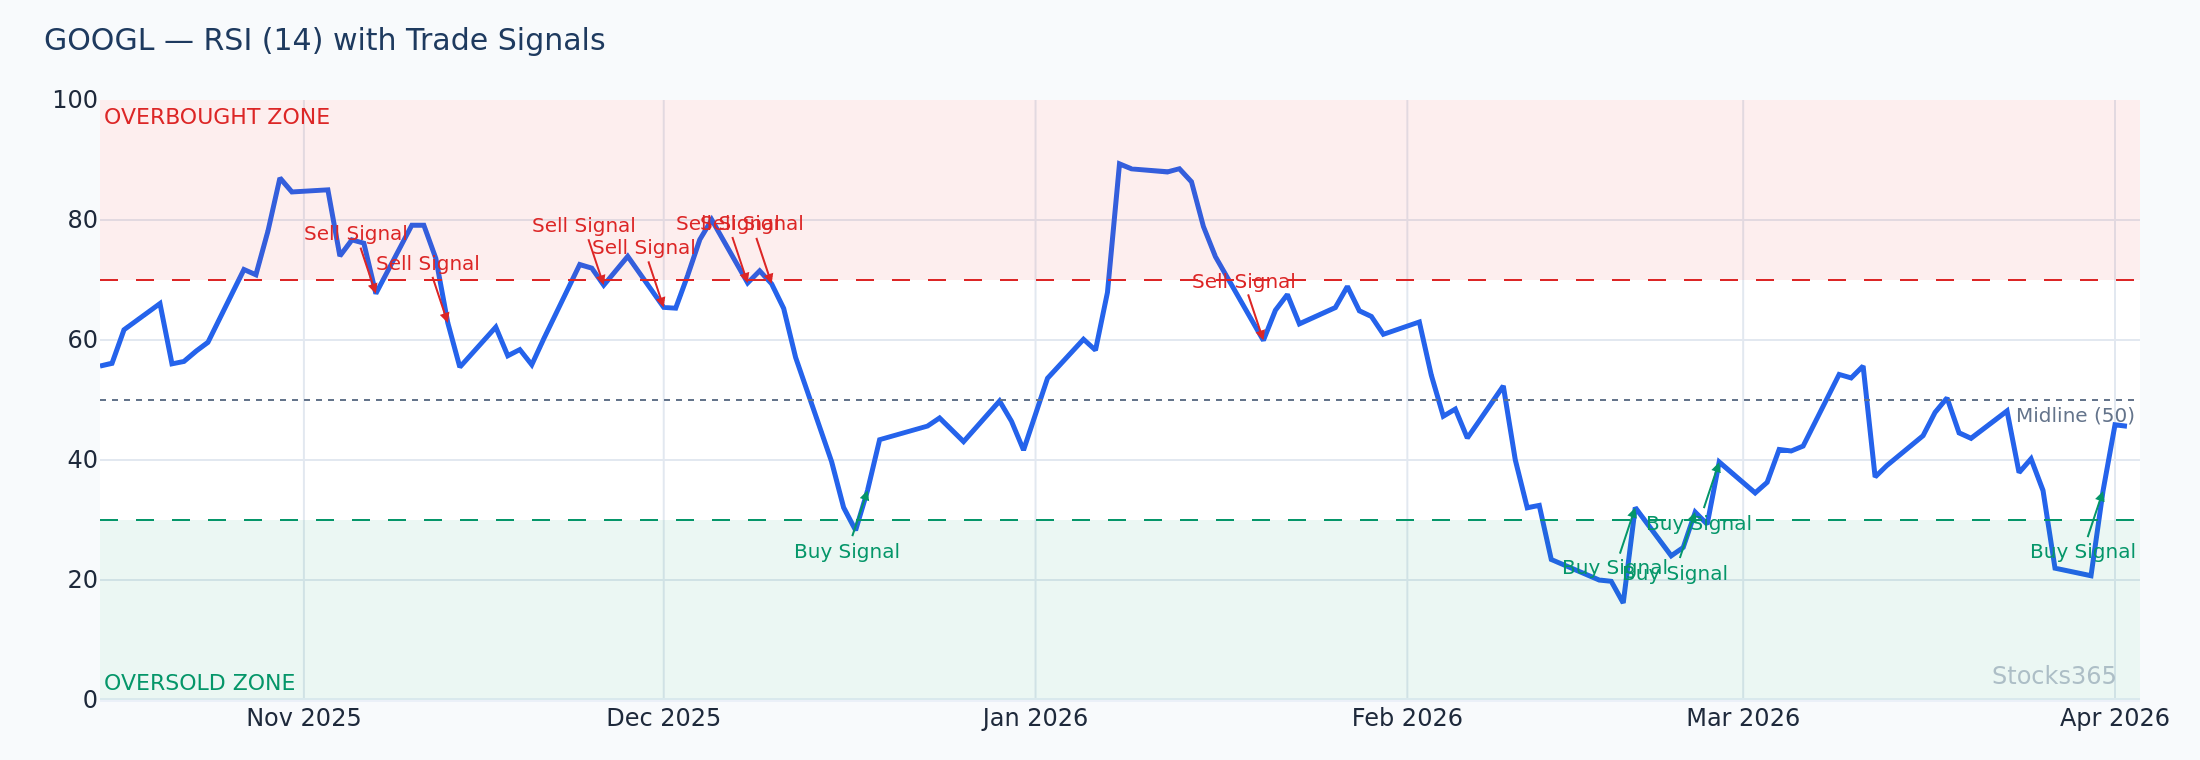
The Core RSI Trading Strategy: Overbought and Oversold Reversals
The most foundational RSI trading strategy is the overbought/oversold reversal. Despite being widely known, it's frequently misapplied. Here's how to execute it correctly.
The RSI Reversal Setup — Step by Step
Bullish Setup (Long Trade):
- Identify a stock in a broader uptrend (price above the 50-day and 200-day moving averages).
- Wait for RSI to drop into oversold territory — below 30 on the 14-period daily RSI.
- Look for RSI to cross back above 30 (the re-entry signal, not the extreme reading itself).
- Confirm with a bullish candlestick pattern — an engulfing candle, hammer, or morning star.
- Enter on the close of the confirmation candle or the open of the next candle.
- Place a stop-loss below the recent swing low.
- Target the next resistance level or exit when RSI reaches 70.
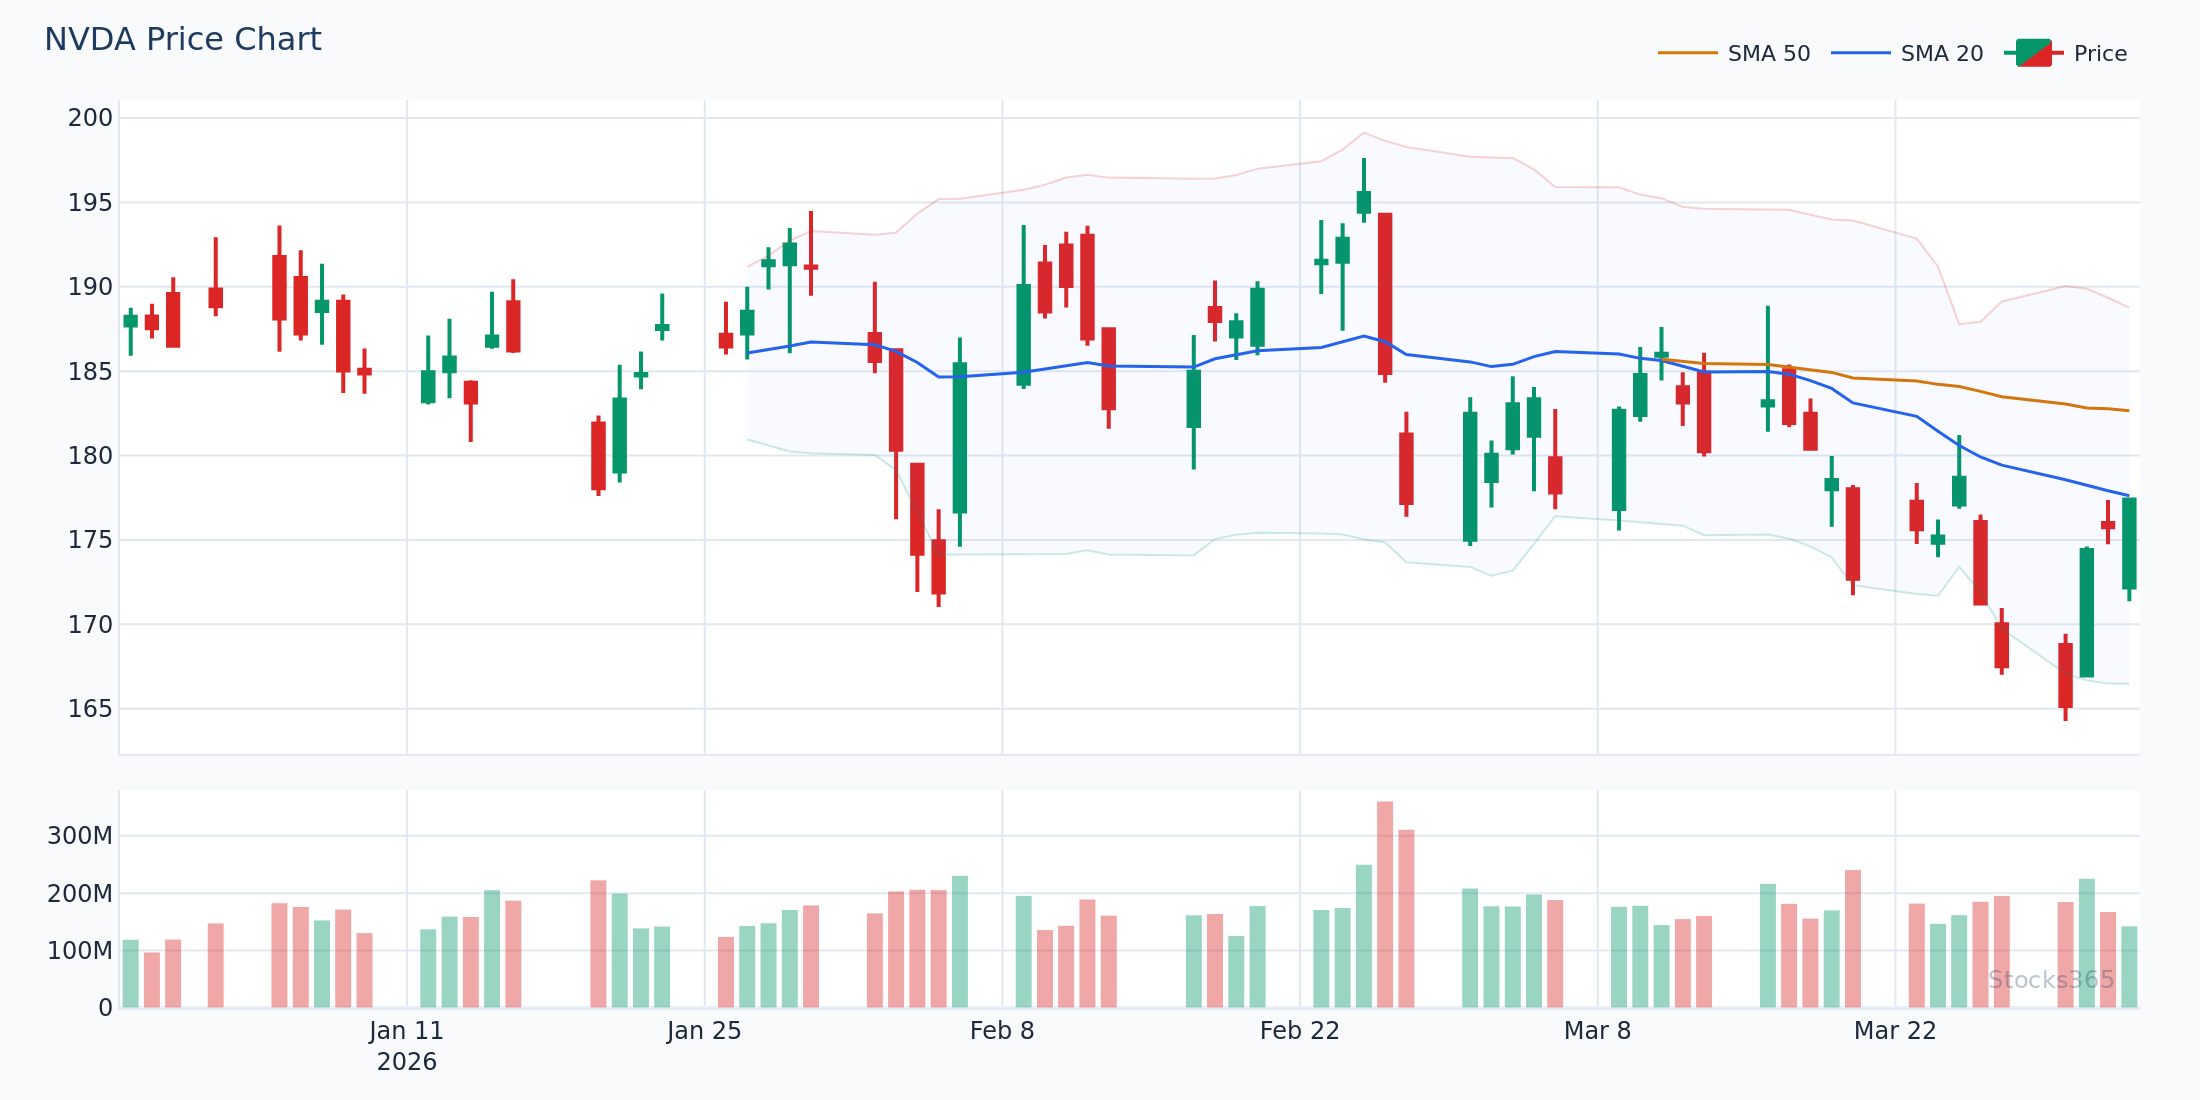
Practical Example — NVDA in Q1 2026:
Imagine NVIDIA (NVDA) is trading at $142 in a clear uptrend. The 14-period daily RSI drops to 27 during a brief pullback, then crosses back above 30 with a bullish engulfing candle. A swing trader enters at $143.50, places a stop at $138.20 (below the swing low), and targets $158 — the next resistance zone. RSI eventually reaches 68 five sessions later, triggering the exit at $157.80. That's a clean 9.9% swing on a well-structured trade.
For a deeper understanding of how these levels function, visit our comprehensive resource on RSI Overbought and Oversold Levels: Master the Signals.
Bearish Setup (Short Trade)
The mirror image applies for short trades:
- Identify a stock in a downtrend (price below the 50-day MA).
- Wait for RSI to reach overbought territory — above 70.
- Wait for RSI to cross back below 70 as the trigger signal.
- Confirm with a bearish candlestick (bearish engulfing, shooting star, or evening star).
- Enter short on confirmation. Place a stop above the recent swing high.
- Cover when RSI drops to 30 or reaches a defined support level.
Advanced RSI Strategy: Trading Divergences
If overbought/oversold signals are the bread and butter of RSI trading, divergence signals are the high-octane fuel that separates average traders from consistently profitable ones.
Bearish RSI Divergence
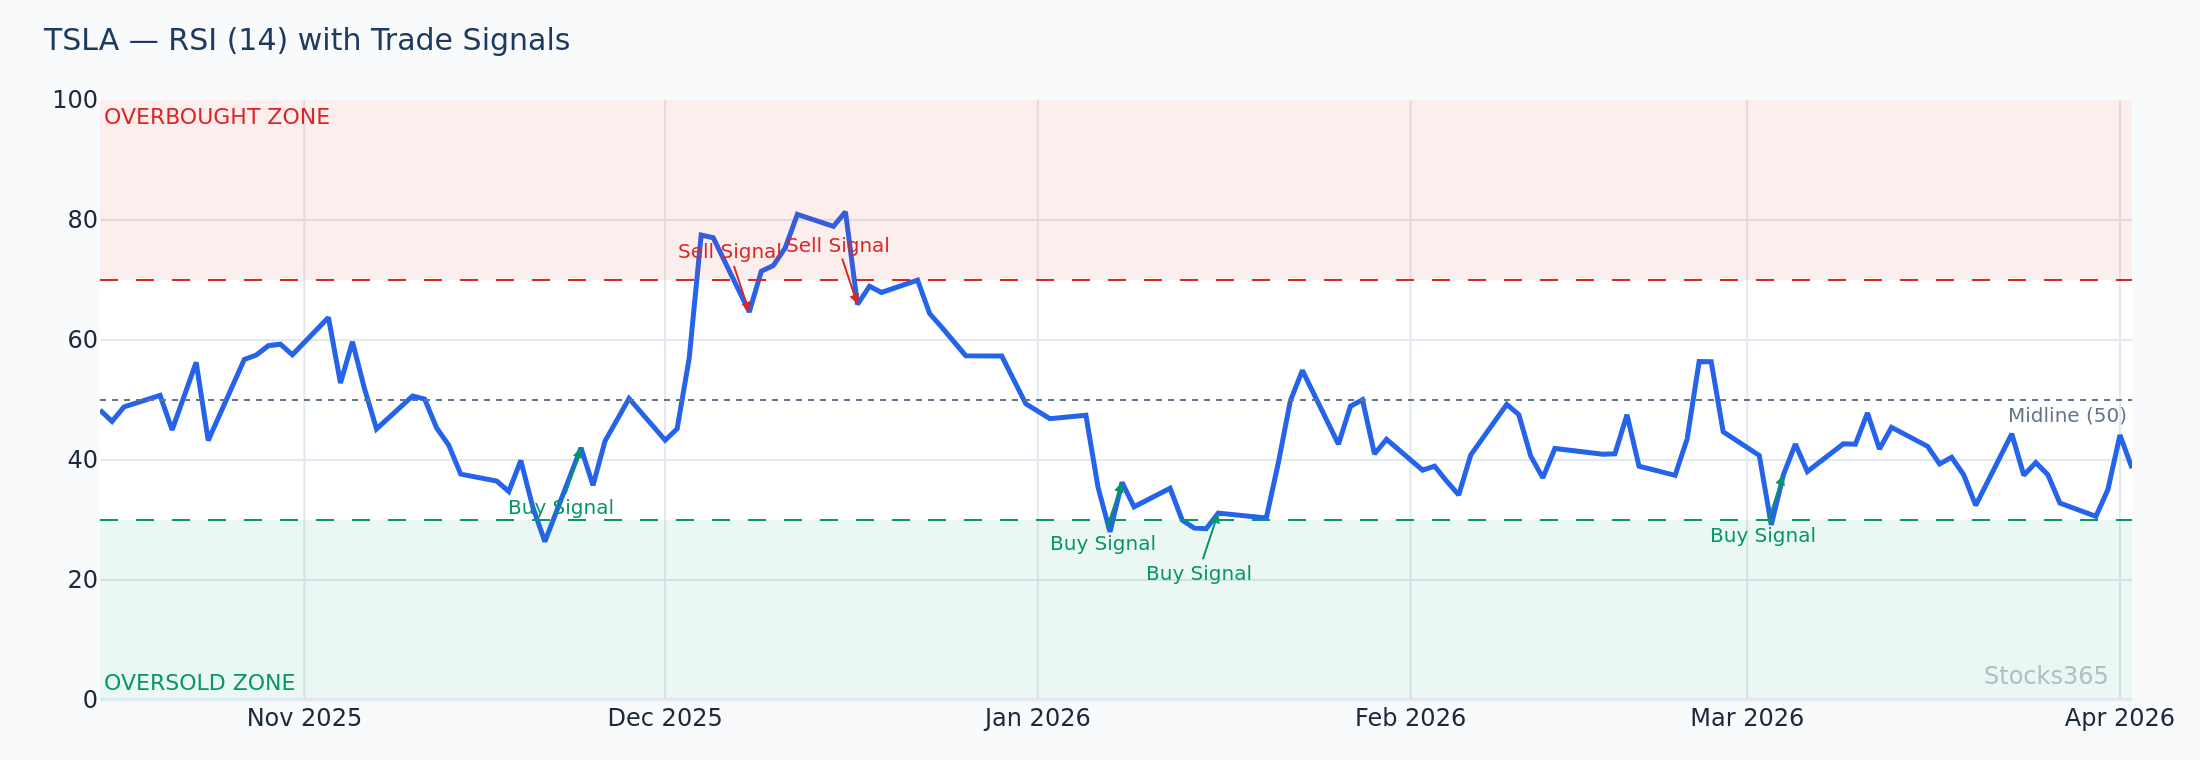
Bearish divergence occurs when price makes a higher high while RSI prints a lower high. This signals fading bullish momentum — even though price appears strong on the surface. It's one of the most reliable leading indicators of an upcoming reversal.
Example: TSLA pushes from $280 to $310 (a higher high), but RSI moves from 72 to 65 (a lower high). The divergence warns that the rally is losing steam. A swing trader anticipating a reversal would wait for price to break below a short-term support or for RSI to cross below 60 as a trigger.
Bullish RSI Divergence
Bullish divergence occurs when price makes a lower low while RSI makes a higher low. This is a powerful signal that selling pressure is weakening and a bounce or reversal may be imminent.
Mastering divergence is a significant step up in RSI sophistication. Our dedicated guide — RSI Divergence Explained: Master Bullish & Bearish Signals — walks through every variation with real-chart examples.
Hidden Divergence for Trend Continuation
Most traders focus on regular divergence (reversal signals), but hidden divergence is equally powerful — and largely overlooked. Hidden bullish divergence (price higher low, RSI lower low) signals trend continuation in an uptrend. It's particularly effective for entering pullbacks within a strong trending move.
If this is new territory, our article on Hidden RSI Divergence: The Advanced Signal Most Traders Miss is essential reading.
The RSI-50 Line Strategy: A Trend Filter Most Traders Ignore
One of the most underrated elements of any RSI trading strategy is the RSI 50 midline. Rather than waiting for extreme readings, the 50 level acts as a dynamic trend filter.
- RSI crossing above 50 → Bullish momentum confirmed. Look for long opportunities.
- RSI crossing below 50 → Bearish momentum confirmed. Avoid longs; look for shorts.
In practice, the RSI-50 crossover strategy is used as a secondary filter rather than a standalone entry signal. Combine it with your overbought/oversold system like this:
- Only take oversold (below 30) long signals when the 50-day RSI trend is bullish (i.e., RSI recently crossed above 50).
- Only take overbought (above 70) short signals when RSI has crossed below 50.
This simple filter dramatically reduces false signals, particularly during choppy, sideways markets where overbought/oversold extremes are less meaningful.
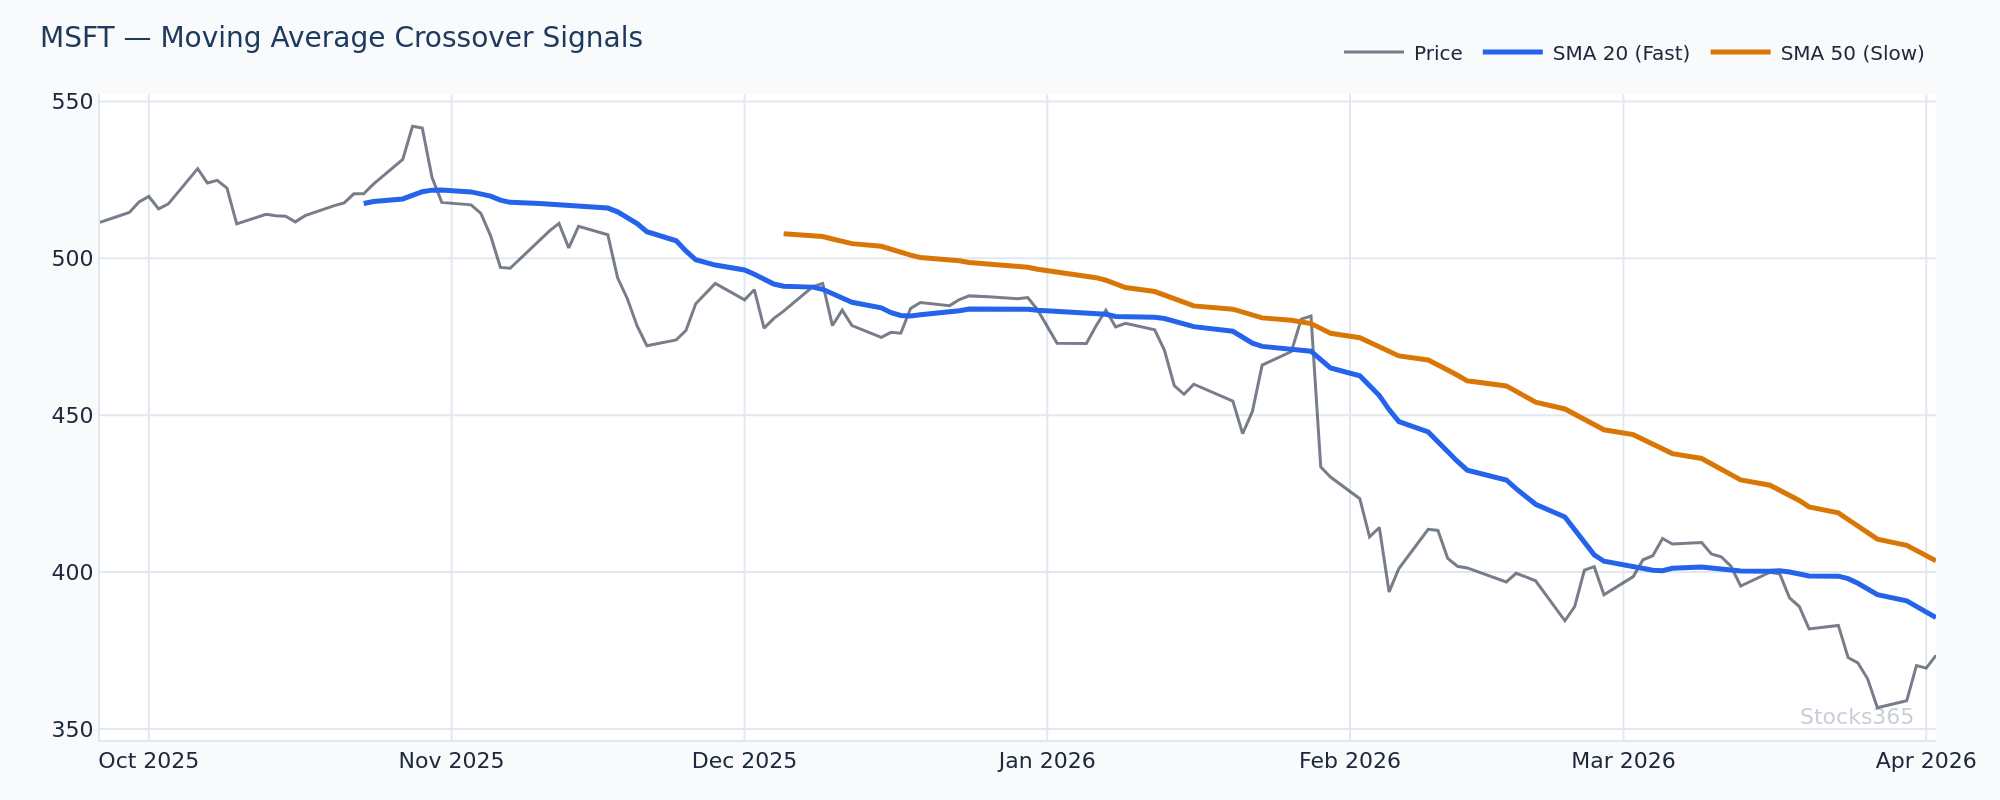
Combining RSI With Moving Averages: The Confirmation Layer
No RSI trading strategy should operate in isolation. Pairing RSI with a simple moving average (SMA) system adds a critical confirmation layer.
The RSI + 50/200 SMA System
Here's a concrete combination strategy:
- The stock must be above its 200-day SMA (macro uptrend confirmed).
- Price must be above the 50-day SMA (intermediate trend intact).
- RSI pulls back to the 40–50 zone (healthy pullback, not extreme oversold).
- RSI bounces back above 50 as price holds the 50-day SMA.
- Enter long; stop below the 50-day SMA.
This is a trend-following approach rather than a counter-trend reversal strategy. It catches mid-trend pullbacks and typically offers better risk/reward than trying to catch exact bottoms.
For a thorough walkthrough of how to execute RSI-based trades across different scenarios, see our guide on How to Use RSI in Trading: The Ultimate Step-by-Step Guide.
Risk Management Rules for RSI Swing Traders
Even the best RSI signals fail without disciplined risk management. Here are the non-negotiable rules every RSI swing trader should follow in 2026:
Position Sizing
- Risk no more than 1–2% of total capital per trade.
- Calculate position size based on the distance between your entry and stop-loss, not on gut feel.
- Formula: Position Size = (Account Risk ÷ Trade Risk) where Trade Risk = (Entry Price − Stop Price).
Stop-Loss Placement
- For reversal trades: stop below the most recent swing low (long) or above the swing high (short).
- For trend-continuation trades: stop below the key moving average you're using as support.
- Never place stops at round numbers (e.g., $100.00) — market makers are aware of these clusters.
Take-Profit Targets
- Minimum 2:1 reward-to-risk ratio. If your stop is $3 away, your target should be at least $6 away.
- Scale out: take 50% off at the first target, move stop to breakeven, let the remainder run.
- Use RSI reaching 70 (for longs) or 30 (for shorts) as a dynamic exit signal.
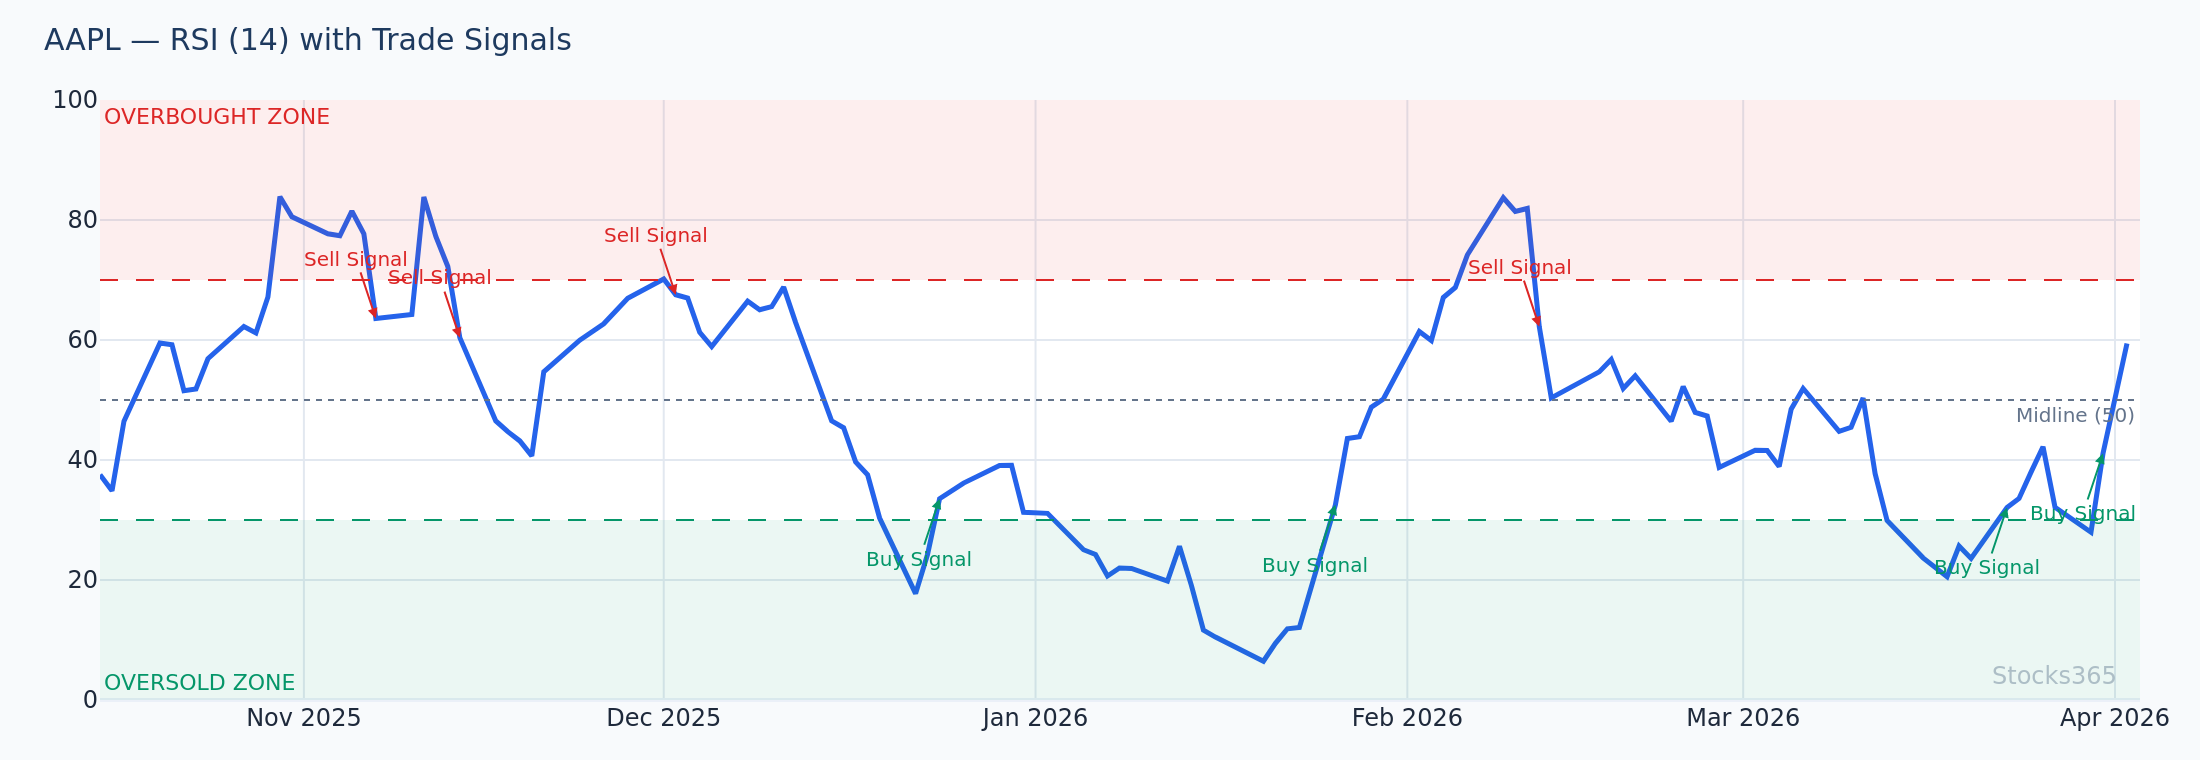
Using Stocks365 Trust Scores to Validate RSI Signals
One challenge with any technical strategy is filtering out low-quality setups. The Stocks365 Trust Score system provides an additional layer of validation by analyzing a range of technical and fundamental factors to score the quality of any given signal.
When an RSI reversal or divergence signal aligns with a high Trust Score on the Stocks365 Signals Dashboard, traders have additional confidence that the setup is supported by broader technical strength — not just a single indicator reading.
For example, if AAPL shows a bullish RSI divergence on the daily chart and carries a high Trust Score on the platform, that convergence of signals significantly increases the probability of a successful trade. Check the AAPL signal page directly to see current RSI readings alongside the full technical analysis dashboard.
Common RSI Strategy Mistakes to Avoid
After studying thousands of RSI-based trades, the same errors appear repeatedly. Avoid these to protect your capital:
- Trading RSI in isolation: RSI alone is not a complete trading system. Always confirm with price action and trend context.
- Buying oversold in downtrends: In a strong downtrend, RSI can stay below 30 for extended periods. Never fight the trend.
- Ignoring the bigger picture: A daily RSI signal that contradicts the weekly trend is a red flag, not an opportunity.
- Chasing signals: If RSI already crossed back above 30 five candles ago and the stock has rallied 8%, the opportunity has passed. Wait for the next setup.
- Using the same settings everywhere: A 14-period RSI on a 5-minute chart behaves very differently from the same setting on a daily chart. Calibrate your settings per timeframe.
Putting It All Together: The Complete RSI Swing Trading Checklist
Before entering any RSI-based swing trade, run through this checklist:
- ☑ Trend alignment: Is the weekly RSI supportive of the trade direction?
- ☑ Price structure: Is price above key moving averages (for longs) or below them (for shorts)?
- ☑ RSI signal: Oversold/overbought reversal, 50-line cross, or divergence confirmed?
- ☑ Candlestick confirmation: Is there a confirming candle pattern at the signal zone?
- ☑ Risk/reward: Does the trade offer at least 2:1 reward-to-risk?
- ☑ Position size: Have you sized the position to risk no more than 2% of capital?
- ☑ Trust Score check: Does the Stocks365 Trust Score support the setup?
When all seven boxes are checked, you have a high-quality, high-confidence RSI swing trade setup.
📌 Key Takeaways
- The RSI trading strategy is most effective when combined with trend analysis, moving averages, and candlestick confirmation — not used in isolation.
- The standard 14-period RSI on the daily chart is a reliable baseline for swing traders; adjust period settings based on your strategy's signal frequency needs.
- RSI overbought/oversold reversals work best with the prevailing trend — avoid counter-trend signals in strong trending markets.
- RSI divergence (regular and hidden) provides early warning of reversals and continuations before they're evident in price alone.
- The RSI 50 midline is a powerful but overlooked trend filter that improves signal quality significantly.
- Disciplined risk management — 1-2% risk per trade, 2:1 minimum reward-to-risk — is non-negotiable for long-term success.
- Platforms like Stocks365 integrate RSI signals with Trust Score validation for more confident trade selection.
Frequently Asked Questions
What is the best RSI setting for swing trading?
The 14-period RSI on the daily chart is the most widely validated setting for swing traders. It offers a balanced blend of sensitivity and reliability. If you prefer more frequent signals, consider the 9-period setting. For higher-conviction, lower-frequency setups, the 21-period RSI reduces noise effectively. Always backtest your chosen setting on the specific asset and timeframe you trade.
Can RSI be used as a standalone trading strategy?
RSI is a powerful tool, but relying on it exclusively leads to excessive false signals — especially in strongly trending markets where overbought/oversold conditions can persist for weeks. A complete RSI trading strategy always incorporates trend filters (moving averages, weekly chart context), price action confirmation (candlestick patterns), and disciplined risk management rules.
What is the difference between RSI divergence and overbought/oversold signals?
Overbought/oversold signals are based on RSI reaching absolute extremes (above 70 or below 30) and are primarily reversal indicators. Divergence signals occur when RSI and price move in opposite directions — a more nuanced and often earlier warning of momentum shifts. Divergence can occur at any RSI level, not just at extremes, making it a distinct and complementary tool in your RSI strategy toolkit.
How accurate is the RSI trading strategy?
No trading strategy guarantees a specific accuracy rate — market conditions, asset class, and execution quality all influence outcomes. However, when an RSI strategy is applied with proper trend alignment, confirmation signals, and strict risk management, win rates of 55–65% with 2:1+ reward-to-risk ratios are achievable for disciplined swing traders. The key is consistency in applying the rules, not chasing perfection on individual trades.
What markets work best with an RSI trading strategy?
RSI performs well across equities, ETFs, forex, and cryptocurrency markets. It is particularly effective in markets with clear trending behavior interspersed with regular pullbacks — a characteristic profile of many large-cap U.S. stocks and major forex pairs. It is less effective in extremely low-volatility, range-bound instruments where extremes become the norm rather than the exception.