
RSI vs MACD: Which Momentum Indicator Should You Use?
Every serious trader eventually faces this question: when it comes to RSI vs MACD, which momentum indicator actually gives you the edge? Both tools appear on millions of charts every day, both generate buy and sell signals, and both have loyal followings among professional and retail traders alike. But they work very differently — and understanding those differences could be the key to dramatically improving your trading results.
In this comprehensive guide, we break down exactly how RSI and MACD function, where each one excels, where each one fails, and — most importantly — how to combine them intelligently within a modern trading workflow like the one powering the Stocks365 signals dashboard.
Key insight: RSI and MACD are not competitors — they are complementary tools. But knowing when to lean on each one is what separates consistent traders from frustrated ones.
What Is RSI? A Quick Recap
The Relative Strength Index (RSI) is a momentum oscillator developed by J. Welles Wilder Jr. It measures the speed and magnitude of price changes over a defined lookback period — typically 14 periods — and plots a value between 0 and 100. Readings above 70 traditionally signal overbought conditions; readings below 30 signal oversold conditions.
If you're new to the concept, our Complete Beginner's Guide to RSI is the perfect starting point. For a deeper look at the math behind it, see How RSI Is Calculated: Formula Explained Step by Step.
RSI's core strengths include:
- Identifying overbought and oversold conditions quickly and visually
- Spotting divergences between price action and momentum
- Working cleanly in range-bound markets where price oscillates between support and resistance
- Generating early reversal signals before price confirms a turn
What Is MACD? A Quick Recap
The Moving Average Convergence Divergence (MACD) was created by Gerald Appel in the late 1970s. It is a trend-following momentum indicator built from the relationship between two exponential moving averages — typically the 12-period EMA and the 26-period EMA. The difference between these two EMAs forms the MACD line. A 9-period EMA of the MACD line creates the signal line. A histogram visualizes the gap between these two lines.
MACD's core strengths include:
- Identifying trend direction and momentum across medium to long timeframes
- Generating crossover signals that many traders use as entry and exit triggers
- Visualizing momentum shifts through the expanding and contracting histogram
- Confirming trend continuations in strongly directional markets
RSI vs MACD: Core Differences Explained
Understanding the structural differences between RSI and MACD is essential before deciding which to prioritize in any given market condition.
1. Type of Indicator
RSI is a bounded oscillator — its value always falls between 0 and 100. This makes it ideal for identifying extreme conditions and potential reversals. MACD is an unbounded trend-following indicator — its values can expand indefinitely as momentum builds. This makes it far better suited for capturing sustained directional moves.
2. What They Actually Measure
RSI measures the relative strength of recent gains versus recent losses — essentially asking, "How hard is the market pushing in one direction right now?" MACD measures the relationship between two moving averages — essentially asking, "Is short-term momentum accelerating or decelerating relative to the longer-term trend?"
3. Signal Types
- RSI signals: Overbought/oversold levels, centerline crossovers (50 level), bullish and bearish divergences, hidden divergences for trend continuation
- MACD signals: MACD/signal line crossovers, zero-line crossovers, histogram expansion and contraction, bullish and bearish divergences
4. Lag and Responsiveness
RSI, particularly on shorter lookback periods, is more responsive to price changes. It can flag potential reversals early — sometimes too early. MACD, being derived from moving averages, carries more inherent lag. This lag reduces false signals in trending markets but can cause you to enter trends late.
5. Market Condition Suitability
- RSI excels in: Sideways, range-bound markets where price bounces between defined levels
- MACD excels in: Trending markets with sustained directional momentum
A common mistake among newer traders is applying RSI overbought signals to aggressively trending stocks like NVDA during a bull run — and getting stopped out repeatedly as the RSI stays "overbought" for weeks. Understanding RSI overbought and oversold dynamics in context is essential.
Practical Trading Examples: RSI vs MACD in Action
Example 1: Range-Bound Market — RSI Wins
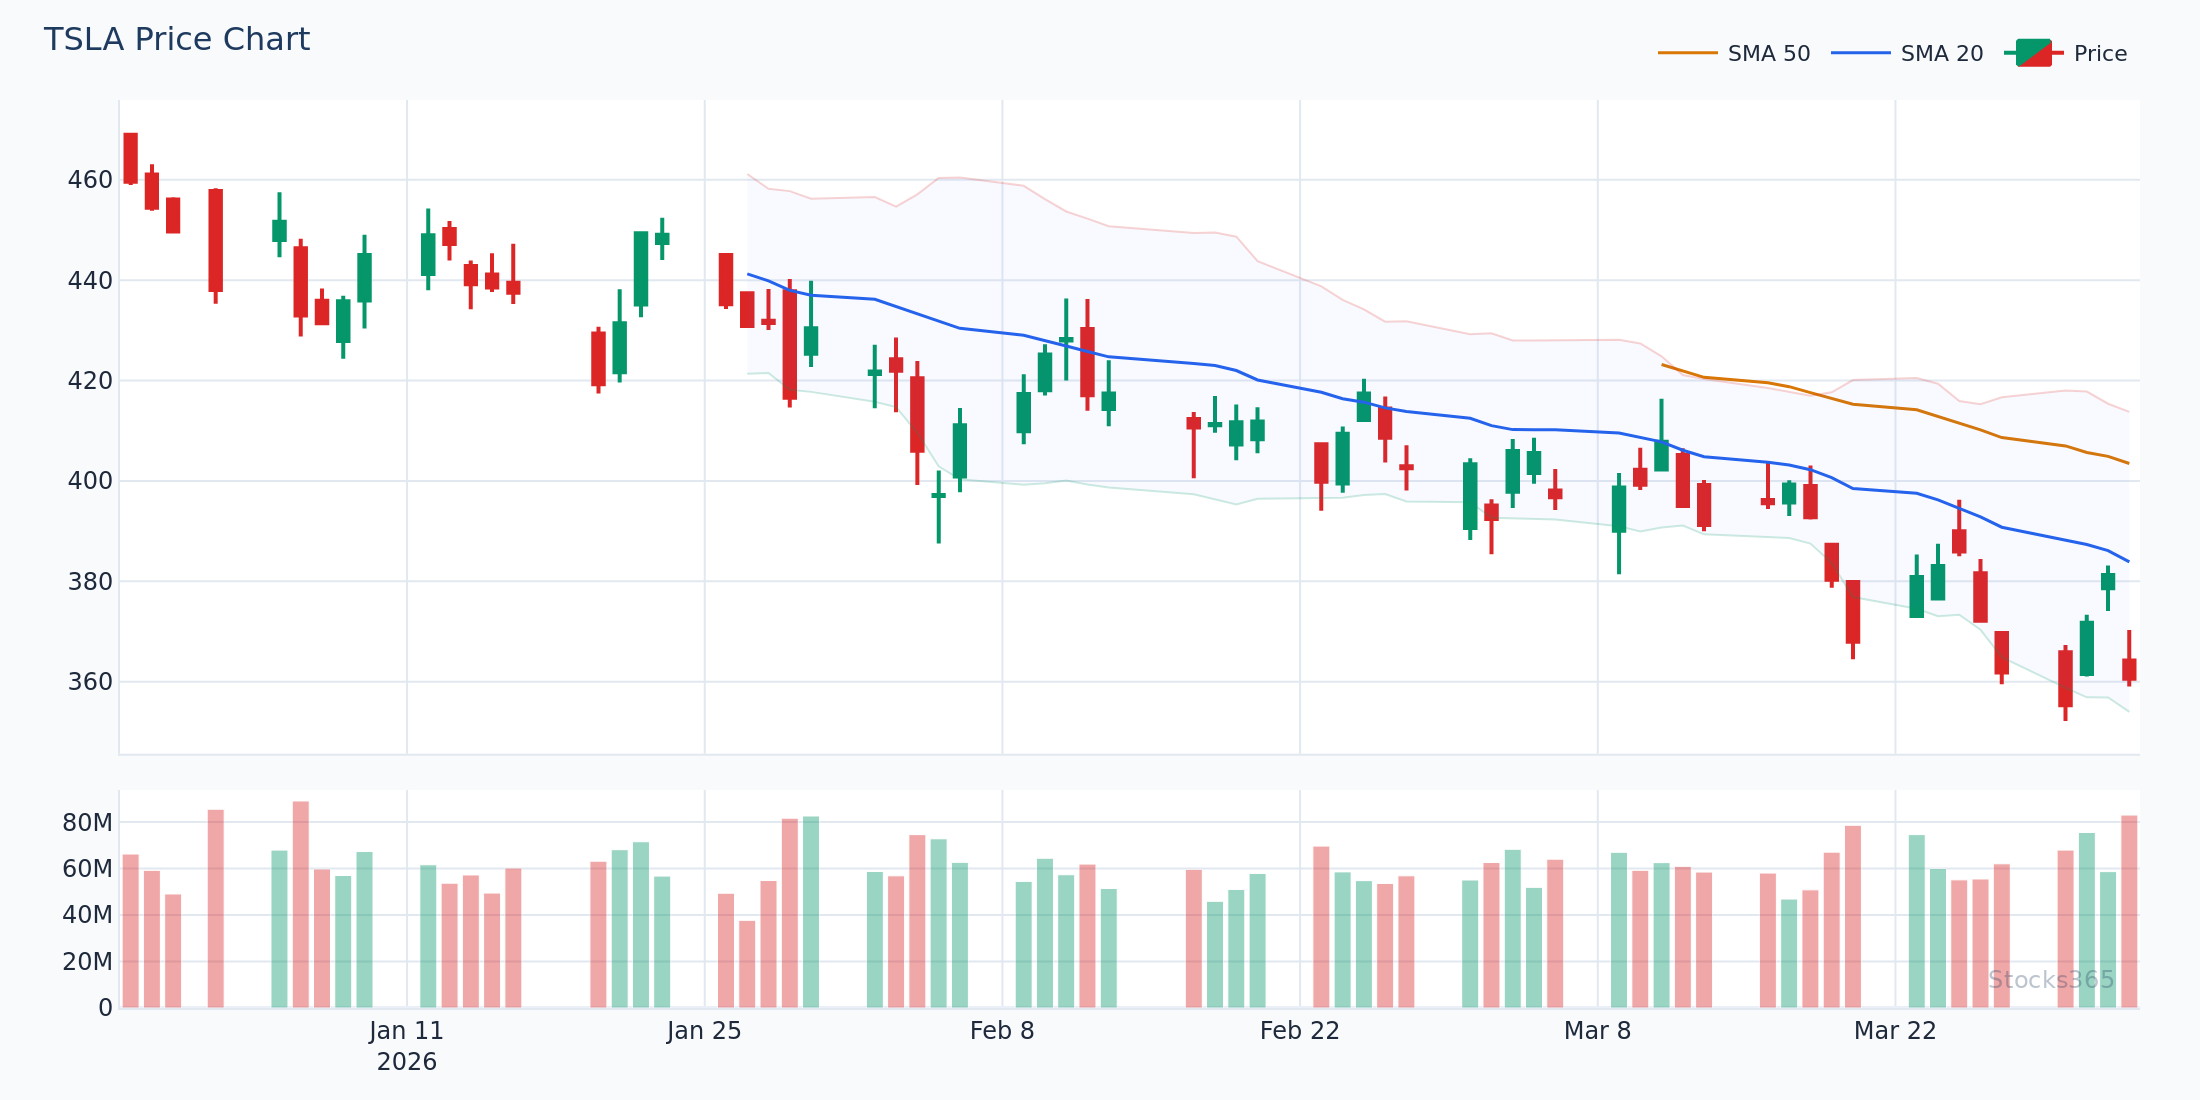
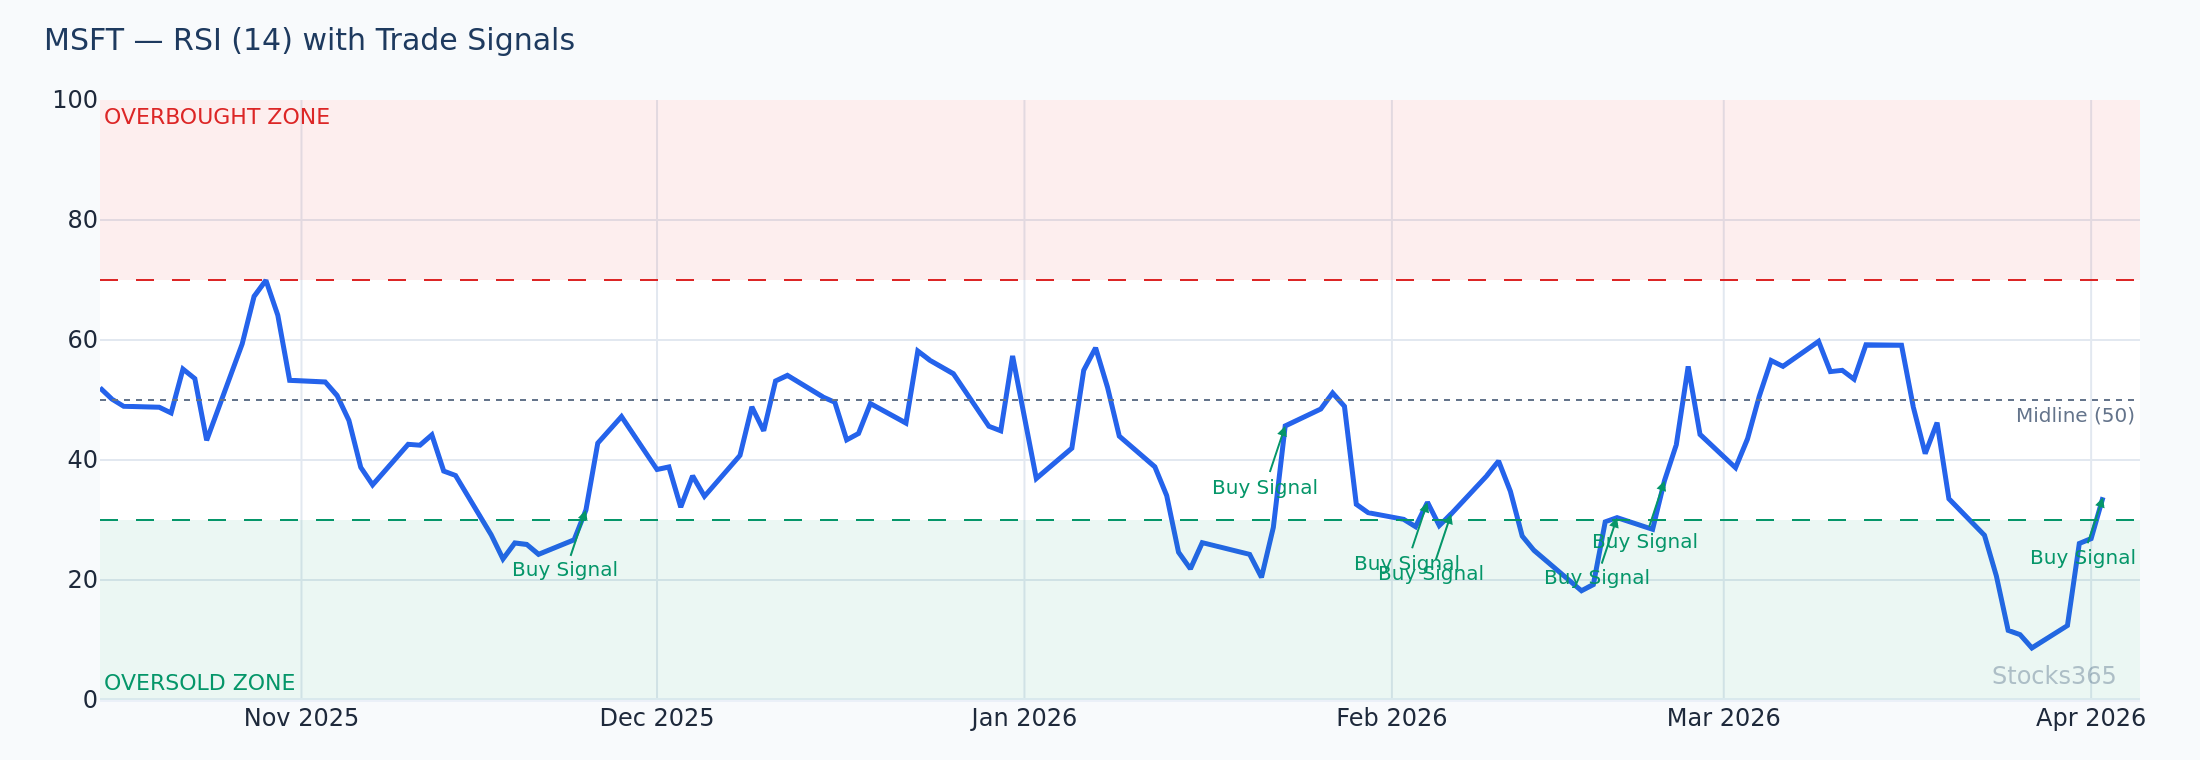
Imagine MSFT trading between $390 and $420 throughout a consolidation period in early 2026. Every time RSI drops toward 32–35, price is near the $390 support zone — a high-probability long entry. Every time RSI pushes toward 68–72, price is near the $420 resistance — a logical area to take profits or initiate a short position.
During this same period, MACD is generating noisy crossovers with little follow-through, producing multiple false entries as the trend is flat. RSI's bounded, oscillating nature makes it far superior in this environment.
Example 2: Strong Uptrend — MACD Wins
Now picture NVDA in a strong uptrend, climbing from $980 to $1,240 over a 10-week period. RSI remains persistently above 65 for much of this move — technically "elevated" but not generating clean sell signals. A trader relying solely on RSI overbought readings might exit the position at $1,050, missing a $190 per share continuation.
MACD, however, keeps its MACD line firmly above the signal line throughout the trend. The histogram stays positive and expanding. A MACD-based strategy would have kept the trader long for the entire sustained move, exiting only when the MACD line crossed below the signal line near $1,220 — capturing the vast majority of the trend.
Example 3: Divergence Signals — Both Have Power
One area where both indicators shine equally is divergence analysis. When GOOGL price makes a new high at $215 but RSI makes a lower high at 62 (versus 71 on the previous peak), that bearish divergence is a powerful warning signal. Similarly, when the MACD histogram shows declining peaks while price keeps climbing, the MACD divergence confirms weakening momentum.
Using both together here is extremely powerful — when RSI divergence and MACD divergence align on the same asset at the same time, the probability of a reversal increases significantly. To master this technique, read our full guide on RSI Divergence: Bullish and Bearish Signals Explained.
RSI vs MACD: Head-to-Head Comparison Table
Here's a structured breakdown to help you quickly assess which indicator suits your needs:
- Best market condition — RSI: Ranging, sideways markets | MACD: Trending markets
- Signal speed — RSI: Faster, more reactive | MACD: Slower, more lag
- False signal risk — RSI: Higher in strong trends | MACD: Higher in choppy markets
- Divergence detection — RSI: Excellent | MACD: Excellent
- Trend confirmation — RSI: Weak | MACD: Strong
- Reversal detection — RSI: Strong | MACD: Moderate
- Beginner-friendliness — RSI: High | MACD: Moderate
- Customizable settings — RSI: Yes (see RSI settings guide) | MACD: Yes
How Professional Traders Combine RSI and MACD
The real answer to the RSI vs MACD debate isn't choosing one over the other — it's knowing how to use them together as a confirmation system. Here are the three most effective combined approaches used by professional traders in 2026:
1. The Trend Filter + Reversal Trigger Method
Use MACD as your trend filter. If MACD is bullish (MACD line above signal line, above zero), only take long trades. Within that bullish context, use RSI dips below 40 as your entry triggers — buying the pullback within the trend. This approach avoids RSI's weakness (fighting the trend) while exploiting its strength (timing precise entries).
Example: AMZN in an established uptrend with MACD firmly bullish. RSI pulls back to 38 during a minor correction to $215. That pullback entry captures the next leg up to $234 before RSI reaches 68 — a clean, trend-confirmed trade.
2. The Dual Divergence Confirmation Method
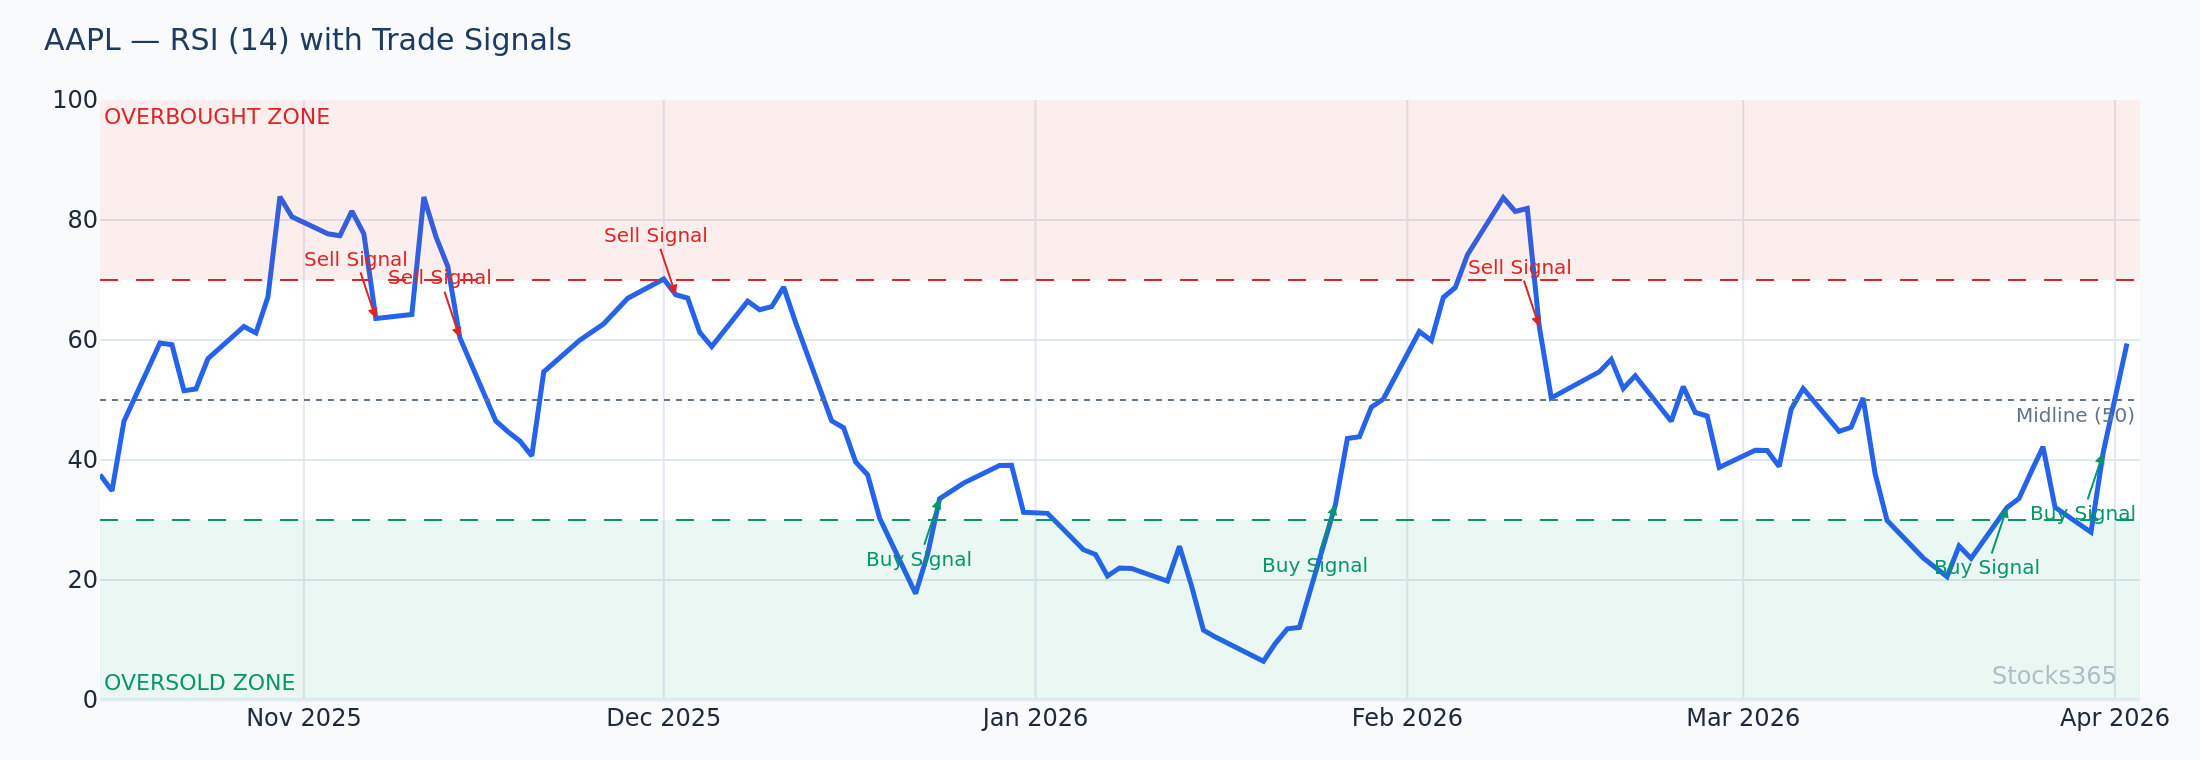
Only act on a divergence signal when both RSI and MACD confirm it simultaneously. If AAPL price makes a new low but RSI makes a higher low — that's a bullish RSI divergence. If the MACD histogram is also forming a less extreme trough on the same swing, you have dual confirmation. This dramatically reduces false divergence signals.
For traders interested in the advanced version of this technique, our guide on Hidden RSI Divergence adds another layer of confluence that most traders completely overlook.
3. The Timeframe Separation Method
Apply MACD on a higher timeframe (daily or weekly) to determine trend direction. Apply RSI on a lower timeframe (1-hour or 4-hour) to time your precise entries. This multi-timeframe approach is arguably the most sophisticated and reliable way to use both indicators, and it's central to how the Stocks365 signals dashboard evaluates momentum across timeframes simultaneously.
RSI Settings and MACD Settings: Optimizing for Your Style
Default settings are a starting point, not a rule. Active day traders often tighten RSI to a 7 or 9-period setting for faster signals. Swing traders frequently use the standard 14-period RSI. Position traders might extend it to 21 periods for smoother, less noisy readings. Our dedicated RSI settings guide covers this in detail.
MACD settings follow a similar logic. Scalpers might use 5/13/1, while swing traders often experiment with 12/26/9 (standard) or even 8/21/5 for a slightly more responsive version without excessive noise. The key principle: faster settings = more signals but more false positives; slower settings = fewer signals but higher quality.
Which Indicator Does Stocks365 Prioritize?
At Stocks365, our proprietary trust score system doesn't rely on a single indicator in isolation. The platform synthesizes RSI momentum readings, MACD trend alignment, volume confirmation, and price action context into a unified signal strength score for each stock. When you view a signal like AAPL on Stocks365, the underlying analysis considers both RSI and MACD as part of a multi-factor evaluation — precisely because no single indicator is superior in all market environments.
This is the honest answer to the RSI vs MACD question that most traders resist: the best approach is contextual, not absolute.
For a complete, step-by-step framework on how to integrate RSI into a real trading strategy, visit our Ultimate Guide to Using RSI in Trading.
Common Mistakes Traders Make With RSI and MACD
- Using RSI overbought signals to short strong uptrends: In momentum-driven bull markets, RSI can remain above 70 for extended periods. Fighting this is a costly mistake.
- Treating every MACD crossover as a high-conviction signal: In choppy, low-volatility markets, MACD crossovers produce excessive noise with minimal edge.
- Ignoring divergences: Both RSI and MACD divergences are among the highest-probability setups available. Not scanning for them is leaving money on the table.
- Using the same settings for all timeframes and assets: A 14-period RSI behaves very differently on a 5-minute crypto chart versus a weekly equity chart.
- Requiring confirmation from only one indicator: The most robust signals come from multi-indicator convergence, not single-indicator readings.
Key Takeaways: RSI vs MACD
- ✅ RSI is best in ranging, sideways markets for identifying overbought/oversold extremes and early reversals
- ✅ MACD is best in trending markets for confirming direction, momentum strength, and sustained moves
- ✅ Both indicators excel at divergence detection — combining them for dual confirmation dramatically improves signal quality
- ✅ The most effective approach uses MACD for trend context and RSI for precise timing
- ✅ Optimize settings based on your trading timeframe and asset class — defaults are a starting point
- ✅ Platforms like Stocks365 synthesize both indicators into unified trust scores to remove the burden of manual interpretation