
ما هو المتوسط المتحرك البسيط (SMA)؟
المتوسط المتحرك البسيط من أكثر الأدوات استخداماً في التحليل الفني. يعمل على تنعيم بيانات السعر عبر حساب الوسط الحسابي لعدد محدد من أسعار الإغلاق خلال فترة زمنية معينة. النتيجة خط واحد على الرسم البياني ينقّي الضجيج قصير الأجل ويكشف اتجاه السوق الأساسي.
بسيط. قوي. وعادةً ما يُستهان به.
على عكس مؤشرات الزخم أو مؤشرات حجم التداول التي تقيس قوة الحركة أو المشاركة، فإن المتوسط المتحرك البسيط يعتمد على السعر فقط. يجيب على سؤال واحد: أين كان متوسط السعر خلال نافذة زمنية معيّنة؟ تلك الإجابة الوحيدة تقود عدداً هائلاً من القرارات التداولية يومياً عبر أسواق الأسهم والعملات المشفرة والفوركس والعقود الآجلة.
كيف يُحسب المتوسط المتحرك البسيط
معادلة المتوسط المتحرك البسيط واضحة ومباشرة. تُجمع أسعار الإغلاق لعدد محدد من الفترات، ثم تُقسم على عدد تلك الفترات.
معادلة المتوسط المتحرك البسيط: SMA = (P1 + P2 + P3 + ... + Pn) ÷ n
حيث P = سعر الإغلاق و n = عدد الفترات
لحساب متوسط متحرك بسيط لـ10 فترات، تجمع آخر 10 أسعار إغلاق وتقسمها على 10. مع كل شمعة جديدة، يسقط السعر الأقدم ويدخل السعر الأحدث. المتوسط يتحرك إلى الأمام — ومن هنا جاءت التسمية «متحرك».
مثال عملي على حساب المتوسط المتحرك البسيط
لنفترض أن سهماً أغلق على مدى خمسة أيام متتالية عند القيم النسبية 100، 103، 101، 107، و105. يساوي المتوسط المتحرك لخمسة أيام: (100 + 103 + 101 + 107 + 105) ÷ 5 = 103.2. في اليوم السادس، إذا أغلق السعر عند 110، يسقط السعر الأقدم (100) ويصبح المتوسط المتحرك الجديد: (103 + 101 + 107 + 105 + 110) ÷ 5 = 105.2. الخط يتحرك مع السعر، ودائماً ما يتأخر عنه بالتصميم.
هذا التأخر مقصود — وهو أيضاً أكبر عيب في المتوسط المتحرك البسيط. سنعود إلى هذه النقطة لاحقاً.
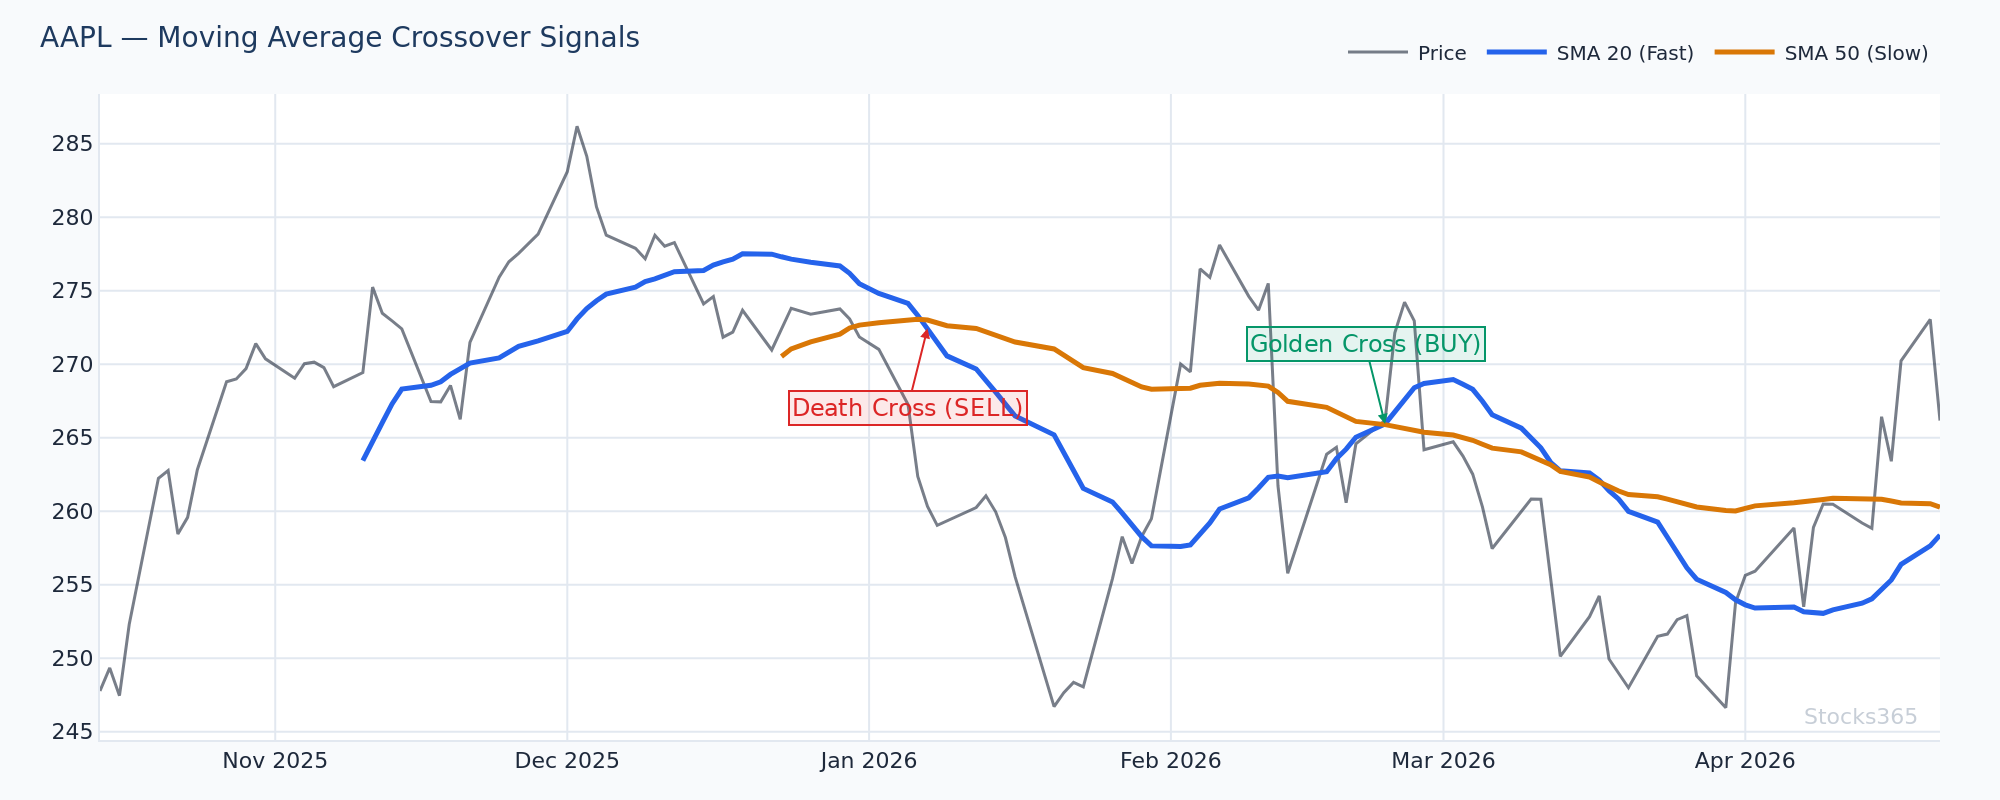
يُظهر هذا الرسم البياني المتوسط المتحرك 20 والمتوسط المتحرك 50 معاً على إطار زمني يومي. عندما ينحني المتوسط المتحرك 20 صعوداً ويتداول بوضوح فوق المتوسط المتحرك 50، عادةً ما يستمر السعر في اتجاه الاتجاه السائد. التقاطع — حيث يخترق الخط الأسرع الخط الأبطأ — يشير إلى تغيير محتمل في حالة السوق. التأكيد يأتي من ارتفاع حجم التداول وإغلاق أعلى من أعلى سعر لشمعة التقاطع.
الفترات الزمنية الشائعة للمتوسط المتحرك البسيط ومعانيها
ليست كل المتوسطات المتحركة متشابهة. الفترة التي تختارها تغيّر كل شيء في كيفية تصرف المؤشر والإشارات التي يولّدها.
- المتوسط المتحرك 9 / 10: قصير جداً الأجل. يستخدمه المتداولون خلال اليوم ومتداولو التأرجح لالتقاط حركات الزخم السريعة. حساس للغاية — يولّد إشارات كثيرة، كثير منها خاطئ.
- المتوسط المتحرك 20: الأداة الأساسية. يمثّل تقريباً شهراً تقويمياً من أيام التداول. يُتابَع على نطاق واسع من المتداولين الأفراد والمؤسسات على حد سواء. يعمل كدعم ديناميكي في الاتجاهات الصاعدة ومقاومة ديناميكية في الاتجاهات الهابطة.
- المتوسط المتحرك 50: مقياس الاتجاه المتوسط الأجل. إغلاق تحت المتوسط المتحرك 50 مع ارتفاع حجم التداول إشارة تحذير مهمة. كثير من الخوارزميات المؤسسية تعتمد على هذا المستوى.
- المتوسط المتحرك 100: متوسط. أقل استخداماً في النقاش لكنه مفيد كمنطقة وسطى بين الـ50 والـ200.
- المتوسط المتحرك 200: المعيار طويل الأجل. أي سهم يتداول فوق المتوسط المتحرك 200 يكون في اتجاه صاعد هيكلي. تحته، اتجاه هابط هيكلي. تقاطعات المتوسط المتحرك 50 مع المتوسط المتحرك 200 تنتج إشارات التقاطع الذهبي وتقاطع الموت الشهيرة.
كيف يستخدم المتداولون المتوسط المتحرك البسيط
1. تحديد الاتجاه
الاستخدام الأساسي للمتوسط المتحرك البسيط هو تحديد اتجاه السوق. إذا أغلق السعر بثبات فوق متوسط متحرك صاعد = اتجاه صعودي. إذا أغلق بثبات تحت متوسط متحرك هابط = اتجاه هبوطي. بسيط. لا يحتاج إلى تفسير.
يقوم المتداولون بتكديس عدة متوسطات متحركة — عادةً الـ20 والـ50 والـ200 — لقياس قوة الاتجاه عبر أطر زمنية متعددة في آن واحد. عندما تميل الثلاثة في نفس الاتجاه ويتداول السعر فوقها جميعاً، يكون الاتجاه قوياً. عندما تبدأ بالتشابك، يكون الاتجاه في ضعف.
2. الدعم والمقاومة الديناميكيان
في الأسواق ذات الاتجاه، تعمل المتوسطات المتحركة الرئيسية كمستويات دعم ومقاومة ديناميكية. السعر لا يرتد فقط عن المستويات الأفقية المرسومة بمسطرة. يرتد أيضاً عن المتوسطات المتحركة — لأن الكثير من المشاركين يراقبون نفس الخطوط ويتفاعلون عند نفس المناطق.
التراجع إلى المتوسط المتحرك 20 في اتجاه صاعد قوي يُعد إعداد دخول كلاسيكي. ينخفض السعر إلى المتوسط المتحرك، يجف حجم التداول، تتشكل شمعة انعكاسية، ويدخل المشترون. المتوسط المتحرك يصبح الأرضية.

هذا الإعداد يُظهر السعر في اتجاه صاعد مستدام يتراجع ليلامس المتوسط المتحرك 20 قبل أن يستأنف صعوده. الإشارة الرئيسية هي انخفاض حجم التداول عند لمس المتوسط المتحرك يليها شمعة انعكاسية بذيل سفلي طويل. ما يُبطل هذا النمط هو إغلاق يومي تحت المتوسط المتحرك 20 مع ارتفاع حجم التداول — وهذا يكسر الدعم الديناميكي ويغيّر التوجه قصير الأجل.
3. إشارات تقاطع المتوسطات المتحركة
تحدث تقاطعات المتوسطات المتحركة عندما يخترق متوسط متحرك قصير الأجل متوسطاً متحركاً أطول أجلاً. أشهر اثنين في التداول:
- التقاطع الذهبي (Golden Cross): المتوسط المتحرك 50 يتجاوز المتوسط المتحرك 200 صعوداً. إشارة صعودية طويلة الأجل. تولّد تغطية إعلامية كبيرة واهتمام مؤسسي.
- تقاطع الموت (Death Cross): المتوسط المتحرك 50 يخترق المتوسط المتحرك 200 هبوطاً. إشارة هبوطية طويلة الأجل. عادةً ما تُرى بعد اتجاهات هابطة ممتدة بدأت فعلاً — المتوسط المتحرك يؤكّد بدلاً من أن يتنبأ.
التقاطعات قصيرة الأجل — مثل المتوسط المتحرك 9 يتقاطع مع المتوسط المتحرك 20 — شائعة بين متداولي التأرجح الباحثين عن إشارات أسرع وأكثر تكراراً. المقايضة هي المزيد من الإشارات الخاطئة.
4. علاقة السعر بالمتوسط المتحرك
مدى ابتعاد السعر عن متوسطه المتحرك مهم. عندما يجري السعر بعيداً فوق متوسط متحرك رئيسي، يصبح ممدداً إحصائياً ومعرضاً للعودة نحو المتوسط. عندما ينهار بعيداً تحته، يسري العكس. هذا المفهوم — قياس المسافة بين السعر ومتوسطه المتحرك — يدعم كثيراً من استراتيجيات العودة نحو المتوسط.
ما يخطئ فيه معظم المتداولين بشأن المتوسط المتحرك البسيط
معظم المبتدئين يعاملون اختراق السعر تحت المتوسط المتحرك 20 كإشارة بيع تلقائية. لحظة ما ينخفض السعر تحت ذلك الخط، يخرجون أو يبيعون على المكشوف. المشكلة: في الاتجاهات الصاعدة القوية، ينخفض السعر بانتظام تحت المتوسط المتحرك 20 لشمعة أو اثنتين قبل أن ينعكس بعنف إلى الأعلى. من باعوا يُحاصرون على الجانب الخطأ من اتجاه صحي تماماً.
الإشارة الحقيقية ليست الاختراق — بل ما يحدث بعد الاختراق. انخفاض لشمعة واحدة تحت المتوسط المتحرك 20 مع حجم تداول ضعيف في اتجاه صعودي يُعتبر ضجيجاً. أما إغلاق لعدة أيام تحت المتوسط المتحرك 20 مع ارتفاع حجم التداول وإعادة اختبار فاشلة من الأسفل؟ هذه إشارة. السياق يفصل بين الصفقات التي تنجح وتلك التي لا تنجح.
التأخر حقيقي. تقبّله. تعامل معه.
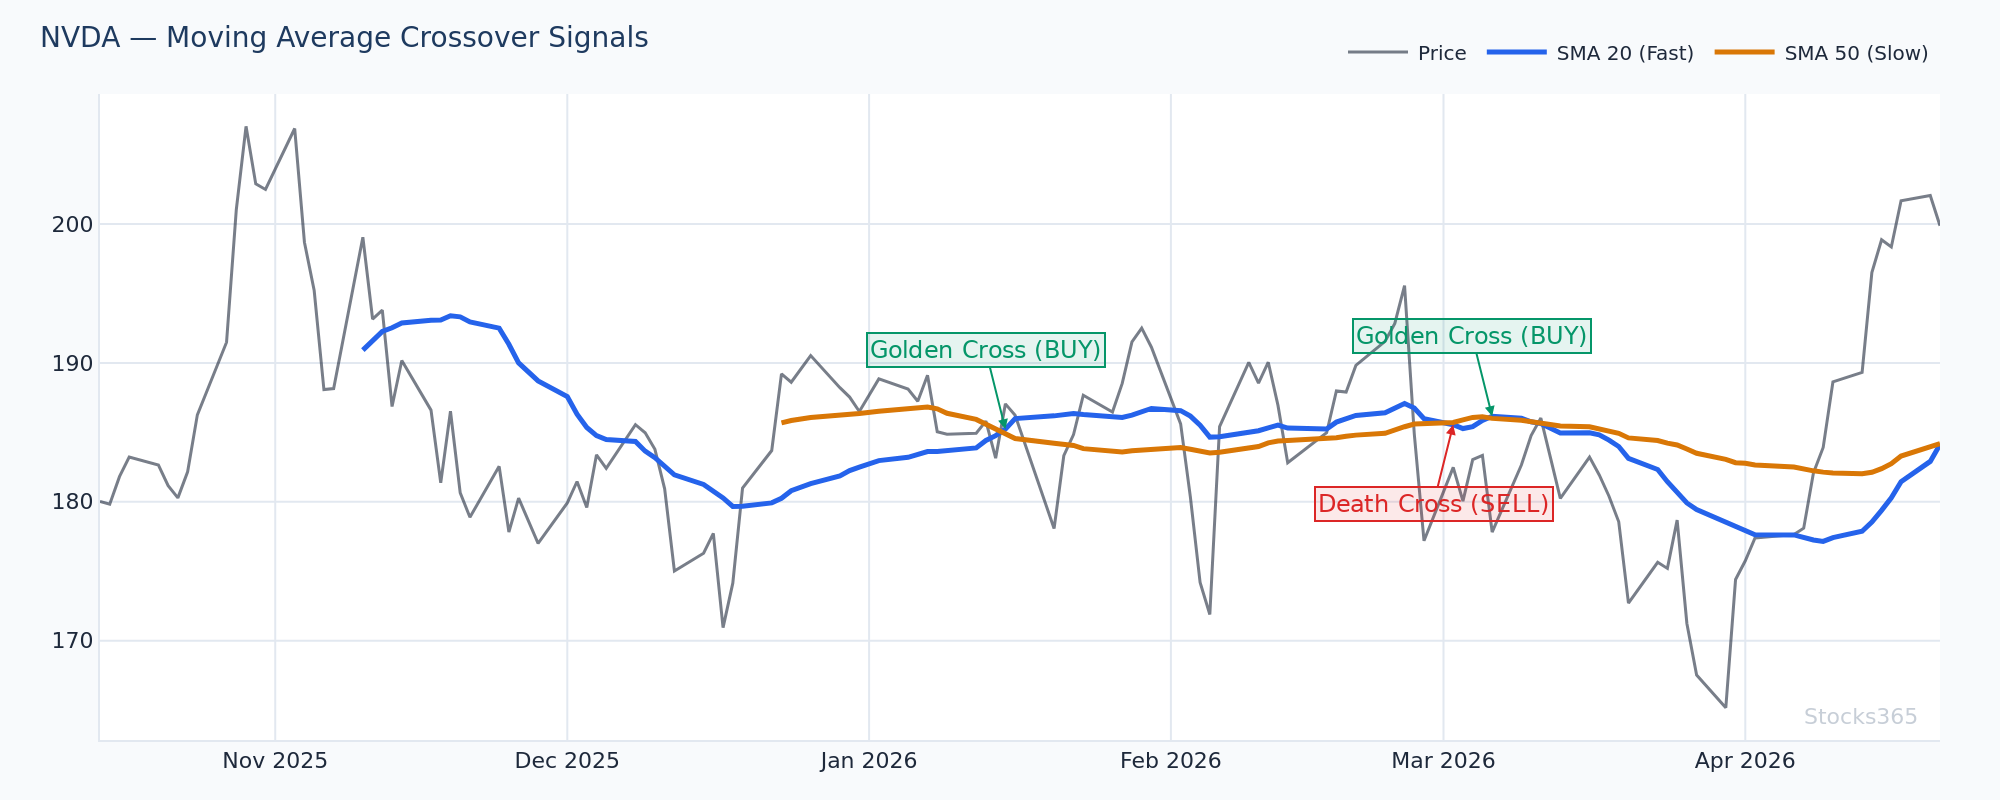
يبرز هذا الرسم البياني تقاطع المتوسط المتحرك 9 مع المتوسط المتحرك 20 في كلا الاتجاهين خلال فترة متقلبة. لاحظ كيف أن بعض التقاطعات تُنتج استمرارية اتجاهية قوية بينما ينعكس البعض الآخر فوراً — صفقات الإشارات الخاطئة. ما يفرّق بينهما هو سياق حجم التداول وما إذا كان الاتجاه الأوسع (كما يحدده اتجاه المتوسط المتحرك 50) يتماشى مع إشارة التقاطع.
المتوسط المتحرك البسيط مقابل المتوسط المتحرك الأسي: ما الفرق؟
المتوسط المتحرك الأسي (EMA) يعطي وزناً أكبر للأسعار الأحدث، ما يجعله أسرع في الاستجابة لحركة السعر الجديدة. المتوسط المتحرك البسيط (SMA) يوزن جميع الفترات بالتساوي، ما يجعله أنعم لكن أبطأ.
لا أحدهما أفضل من الآخر. يخدمان أهدافاً مختلفة.
متداولو اليوم الواحد ومتداولو الزخم عادةً ما يفضلون المتوسط المتحرك الأسي لأنه يتفاعل أسرع، فيعطي إشارات مبكرة. متداولو التأرجح والمراكز غالباً ما يفضلون المتوسط المتحرك البسيط لأن إشاراته أنظف وأقل عرضة للتقلبات اليومية. كثير من الأنظمة الاحترافية تستخدم الاثنين معاً — المتوسط المتحرك الأسي للدخول والمتوسط المتحرك البسيط لسياق الاتجاه.
دمج المتوسط المتحرك البسيط مع مؤشرات أخرى
لا يعمل المتوسط المتحرك البسيط بمعزل. الإعدادات الأكثر موثوقية تجمعه مع مؤشر تأكيد واحد على الأقل.
المتوسط المتحرك البسيط + مؤشر القوة النسبية RSI
دمج المتوسط المتحرك البسيط مع مؤشر القوة النسبية (RSI) ينتج إعدادات عالية الجودة. عندما يتراجع السعر إلى المتوسط المتحرك 20 في اتجاه صاعد وفي الوقت نفسه ينخفض مؤشر RSI إلى منطقة 40-50 دون كسر مستويات التشبع البيعي، فإن التوافق يشير إلى استمرار اتجاه صحي. مؤشر RSI يؤكد أن الزخم لم يُدمّر — إنه يستريح فقط.
لإلقاء نظرة أعمق على كيفية حساب RSI وماذا تعني تلك المستويات فعلياً، اقرأ دليلنا الكامل حول كيف يُحسب مؤشر RSI ودليل المبتدئين الكامل إلى RSI. فهم RSI جنباً إلى جنب مع المتوسط المتحرك البسيط يشحذ قراءتك لجودة الاتجاه بشكل كبير.
هل تريد معرفة كيفية تطبيق RSI عملياً جنباً إلى جنب مع أدوات الاتجاه مثل المتوسط المتحرك البسيط؟ يغطي الدليل النهائي خطوة بخطوة لاستخدام RSI في التداول هذا بالضبط.
المتوسط المتحرك البسيط + حجم التداول
حجم التداول هو أفضل صديق للمتوسط المتحرك البسيط. اختراق السعر فوق المتوسط المتحرك 50 مصحوباً بارتفاع في حجم التداول بمقدار 1.5 إلى 2 ضعف المتوسط يُعتبر أكثر مصداقية بكثير من اختراق بحجم تداول ضعيف أقل من المتوسط. تحقق دائماً من حجم التداول عند تقييم اختراقات أو انهيارات المتوسط المتحرك البسيط.
المتوسط المتحرك البسيط + التباعد في مؤشر RSI
التباعد في مؤشر RSI عند مستوى متوسط متحرك رئيسي يخلق بعضاً من أعلى إعدادات الانعكاس احتمالية المتاحة. عندما يعيد السعر اختبار المتوسط المتحرك 200 من الأعلى بينما يُسجل RSI قاعاً أعلى (تباعد صعودي)، يكون الجمع بين الدعم الهيكلي وتحول الزخم قوياً. اقرأ تحليلنا الكامل لـإشارات تباعد RSI لفهم كيفية إضافة هذا الطبقة فوق تحليل المتوسط المتحرك البسيط.
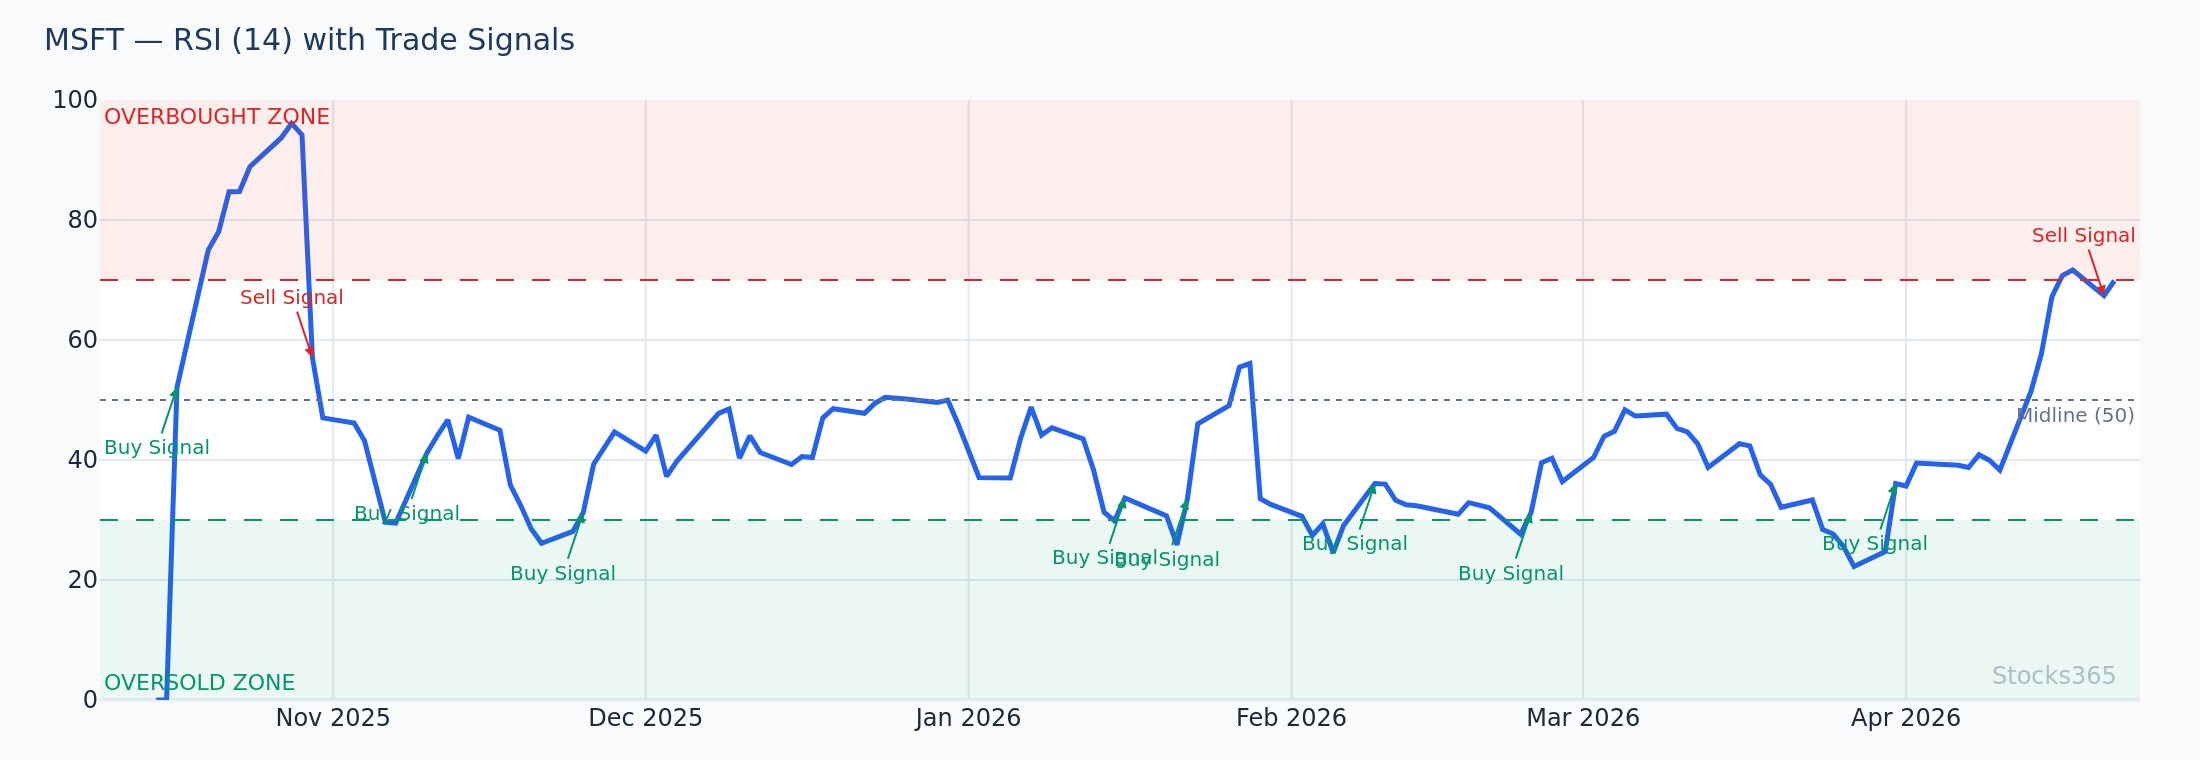
يُظهر هذا الرسم البياني مؤشر RSI يحافظ على مستوى أعلى من 50 بينما يتراجع السعر إلى المتوسط المتحرك 20 — إشارة كلاسيكية لاستمرار الاتجاه. بقاء RSI فوق خط المنتصف بينما يختبر السعر المتوسط المتحرك يؤكد أن ضغط الشراء الأساسي لا يزال سليماً. يفشل الإعداد إذا كسر RSI ما دون 40 وأغلق السعر تحت المتوسط المتحرك 20 بقناعة.
إعدادات تداول حقيقية باستخدام المتوسط المتحرك البسيط
الإعداد الأول: ارتداد المتوسط المتحرك
في اتجاه صاعد مؤكد (السعر فوق المتوسط المتحرك 50 والمتوسط المتحرك 200 الصاعدين)، انتظر حتى يتراجع السعر ويلمس المتوسط المتحرك 20. ابحث عن شمعة انعكاسية صعودية — مطرقة، شمعة ابتلاع، أو دوجي — تتشكل عند المتوسط المتحرك مع انخفاض حجم التداول. ادخل عند كسر أعلى سعر للشمعة الانعكاسية. الإبطال هو إغلاق تحت المتوسط المتحرك 20 مع حجم تداول أعلى من المتوسط.
الإعداد الثاني: دخول التقاطع الذهبي
عندما يتجاوز المتوسط المتحرك 50 المتوسط المتحرك 200 صعوداً (التقاطع الذهبي)، لا تطارد الاختراق مباشرةً. انتظر أول تراجع ذي معنى بعد التقاطع — من المفضل أن يكون نحو المتوسط المتحرك 50 الذي ارتفع حديثاً — وابحث عن تماسك بحجم تداول منخفض يليه استرجاع لأعلى نقطة سابقة. هذا الدخول يوفر نقطة خطر أضيق من الشراء عند شمعة التقاطع الأولية.
الإعداد الثالث: البيع على المكشوف عند رفض المتوسط المتحرك 20
في اتجاه هابط مؤكد (السعر تحت المتوسط المتحرك 50 والمتوسط المتحرك 200 الهابطين)، يرتفع السعر لإعادة اختبار المتوسط المتحرك 20 من الأسفل. المتوسط المتحرك يعمل كمقاومة. عندما ترى شمعة انعكاسية هبوطية تتشكل عند منطقة رفض المتوسط المتحرك 20 — خصوصاً مع اقتراب RSI من نطاق 50-60 دون اختراقه — فإن الإعداد يصب في صالح استمرار الاتجاه الهابط. راجع دليلنا حول مستويات التشبع الشرائي والبيعي في RSI لفهم ما تبدو عليه قراءات RSI في الأنظمة الهبوطية.
ما تُظهره البيانات عن إشارات المتوسط المتحرك البسيط
النظرية مفيدة. البيانات أفضل.
تحليلنا لـ3,332 إشارة تتعقب اختراق السعر تحت المتوسط المتحرك 20 وجد نسبة فوز بلغت 50.9% على فترة احتفاظ 10 أيام، مع معامل ربح 1.06. هذا أفضل قليلاً من رمية عملة — ليس انفجارياً، لكنه ذو معنى عند الجمع مع إدارة مخاطر صحيحة وتأكيد إضافي. تصدرت العملات المشفرة جميع فئات الأصول بنسبة فوز 66.8% على هذه الإشارة، بينما تأخرت الفوركس بشكل ملحوظ عند 42.5%. فئة الأصل التي تتداولها مهمة بقدر الإشارة نفسها. استكشف مجموعة البيانات الكاملة على Stocks365 Insights.
والأهم أن بحث Stocks365 عبر 3,289 إشارة لاختراق السعر فوق المتوسط المتحرك 20 أظهر نسبة فوز أقل بلغت 48.3% مع معامل ربح 0.88 — نتيجة أقل من نقطة التعادل على أساس قائم بذاته. أداء الأسهم كان الأفضل عند 52.3%، بينما تراجعت العملات المشفرة بشدة عند 36.9% فقط. هذا التباين يكشف شيئاً مهماً: اختراق المتوسط المتحرك 20 وحده ليس كافياً. سياق الاتجاه الأوسع وفئة الأصل يغيران قيمة الإشارة بشكل كبير.
الإشارات بدون سياق ليست سوى ضجيج متنكّر في زي استراتيجية.
محددات المتوسط المتحرك البسيط التي يجب أن تعرفها
- التأخر: المتوسط المتحرك البسيط بطبيعته ينظر إلى الوراء. يخبرك بمتوسط السعر في الماضي، لا إلى أين يتجه. في الأسواق سريعة الحركة، يمكن أن يكون التأخر مكلفاً.
- الإشارات الخاطئة في الأسواق الجانبية: عندما يتحرك السعر جانبياً في نطاق، يُنتج المتوسط المتحرك البسيط إشارات تقاطع متكررة في كلا الاتجاهين دون استمرارية. المتوسطات المتحركة تؤدي بشكل ضعيف في بيئات بلا اتجاه.
- مشكلة الوزن المتساوي: المتوسط المتحرك البسيط يعامل سعراً من 20 يوماً مضت مثل إغلاق الأمس. في الأسواق السريعة، هذا يجعل المتوسط المتحرك البسيط أبطأ في عكس المعلومات الجديدة مقارنةً بالمتوسط المتحرك الأسي.
- ديناميكية النبوءة ذاتية التحقق: لأن الكثير من المتداولين يراقبون نفس مستويات المتوسط المتحرك البسيط (خصوصاً الـ20 والـ50 والـ200)، تصمد المستويات أحياناً لأن عدداً كافياً من المشاركين يتصرف بناءً عليها — وليس بسبب أي أهمية رياضية متأصلة.
ما يجب متابعته
- المتوسط المتحرك 20 مستوٍ + السعر يلتف حوله: عندما يتسطح المتوسط المتحرك 20 ويضغط السعر في نطاق ضيق فوقه مباشرةً، راقب شمعة توسع عالية الحجم. الاختراق من هذا الانضغاط غالباً ما ينتج حركة سريعة ومستدامة حيث يستسلم البائعون المحاصرون ويدخل مشترون جدد في الوقت نفسه.
- استعادة المتوسط المتحرك 50 بعد انهيار فاشل: عندما يخترق السعر ما دون المتوسط المتحرك 50، يمضي جلسة إلى ثلاث جلسات تحته، ثم يستعيده بإغلاق قوي أعلى — هذا الانهيار الفاشل عادةً ما يكون إعداداً لارتفاع عدواني. صيد وقف الخسارة تحت المتوسط المتحرك يهز أصحاب المراكز الطويلة الضعفاء ويعيد تحميل الحركة.
- المتوسط المتحرك 20 يعمل كمقاومة ثلاث مرات: إذا اختبر السعر المتوسط المتحرك 20 من الأسفل ورُفض ثلاث مرات متتالية دون اختراقه، يكون المتوسط المتحرك قد أسس نفسه كمقاومة صلبة. الرفض التالي غالباً ما ينتج حركة أسرع وأكثر حدة نزولاً مع بناء القناعة على الجانب البيعي.
- التباعد الخفي في RSI عند المتوسط المتحرك 20: في اتجاه صاعد قوي، عندما يتراجع السعر إلى المتوسط المتحرك 20 ويُسجل RSI قاعاً أعلى مقارنةً بقاع RSI في التراجع السابق، فإن ذلك التباعد الصعودي الخفي يشير إلى استمرار الاتجاه باحتمالية عالية. دليلنا حول التباعد الخفي في RSI يشرح هذا النمط بتعمق.
- التقاطع الذهبي في العملات المشفرة مع تأكيد الحجم: في أسواق العملات المشفرة، تشكيلات التقاطع الذهبي (المتوسط المتحرك 50 يتجاوز المتوسط المتحرك 200 صعوداً) المصحوبة بزيادة مستدامة في متوسط حجم التداول اليومي — وليس فقط ارتفاعاً لمرة واحدة — سبقت تاريخياً فترات اتجاه ممتدة. دون تأكيد الحجم، يفشل التقاطع الذهبي بشكل متكرر خلال أسابيع قليلة.
كيف يستخدم Stocks365 هذا
في Stocks365، المتوسط المتحرك البسيط واحد من أكثر من 12 مؤشراً فنياً مُدمجاً في نظام Trust Score الاحترافي الخاص بنا. تحديداً، يساهم موقع المتوسط المتحرك البسيط في طبقة تقييم حالة السوق (regime scoring) — التي تُقيّم ما إذا كانت الأداة المالية في حالة اتجاه أو عودة نحو المتوسط وقت توليد الإشارة.
عندما تقيّم خوارزمية Trust Score إشارة لسهم مثل AAPL، تتحقق مما إذا كان السعر أعلى أو أسفل متوسطات متحركة رئيسية (20، 50، 200)، ميل تلك المتوسطات المتحركة، وما إذا كانت تقاطعات المتوسط المتحرك الأخيرة تتماشى مع اتجاه الإشارة. إشارة شراء تحدث بينما يتداول السعر فوق متوسط متحرك 50 صاعد تحمل مساهمة Trust Score أعلى مادياً من نفس الإشارة المتولدة خلال اتجاه هابط. هذا سياق الحالة يساعد على تصفية الإعدادات منخفضة الاحتمال قبل أن تصل إلى لوحة الإشارات.
الهدف ليس القضاء على جميع الصفقات الخاسرة — لا نظام يفعل ذلك. الهدف هو ترجيح الإشارات نحو بيئات احتمالية أعلى. تحليل حالة السوق بناءً على المتوسط المتحرك البسيط جوهري في تلك العملية الترجيحية.
النقاط الرئيسية
- المتوسط المتحرك البسيط (SMA) يحسب الوسط الحسابي لأسعار الإغلاق على مدى فترة محددة، يتدحرج إلى الأمام مع كل شمعة جديدة.
- الفترات الشائعة — 20، 50، و200 — كل منها يخدم وظائف مختلفة: الاتجاه قصير الأجل، الاتجاه متوسط الأجل، والانحياز الهيكلي طويل الأجل.
- المتوسطات المتحركة تعمل كـدعم ومقاومة ديناميكيين في الأسواق ذات الاتجاه وتكون أقوى عندما يقترب السعر من ضمن اتجاه الاتجاه.
- إشارات التقاطع (التقاطع الذهبي، تقاطع الموت) متأخرة بطبيعتها — استخدمها لتأكيد الاتجاه، لا للتنبؤ.
- دمج المتوسط المتحرك البسيط مع RSI، حجم التداول، ومؤشرات الزخم يحسّن جودة الإشارة بشكل كبير مقارنةً باستخدام مؤشر واحد فقط.
- المتوسط المتحرك البسيط يؤدي بشكل ضعيف في الأسواق الجانبية المتقلبة — قيّم دائماً ما إذا كان اتجاه موجود قبل تطبيق استراتيجيات المتوسط المتحرك.
- سياق فئة الأصول مهم: البيانات تُظهر أن العملات المشفرة والأسهم تستجيب بشكل مختلف لإشارات تقاطع المتوسط المتحرك مقارنةً بالفوركس.