
What Is MACD? Understanding the Moving Average Convergence Divergence Indicator
If you've spent any time exploring technical analysis, you've almost certainly encountered the term MACD. It appears on charts across every major trading platform, it's referenced by professional analysts daily, and it remains one of the most widely used momentum indicators in modern trading. But what is MACD, exactly — and more importantly, how can you actually use it to make smarter trading decisions?
This guide breaks down everything you need to know about MACD from the ground up. Whether you're a complete beginner or a trader looking to sharpen your edge, you'll come away with a clear, practical understanding of what MACD measures, how it's calculated, and how to read its signals with confidence.
MACD Definition: What Does MACD Stand For?
MACD stands for Moving Average Convergence Divergence. It is a trend-following momentum indicator that shows the relationship between two exponential moving averages (EMAs) of a security's price. Developed by Gerald Appel in the late 1970s, MACD has stood the test of time because it elegantly combines trend direction, momentum strength, and potential reversal signals into a single, readable indicator.
At its core, MACD answers one fundamental question every trader asks: Is the current price momentum accelerating or decelerating? When momentum is building, trends tend to continue. When momentum is fading, reversals often follow. MACD helps you see those shifts before they become obvious on the price chart alone.
How Is MACD Calculated? The Formula Explained
Understanding what is MACD requires understanding its three core components. Don't worry — the math is simpler than it sounds.
The Three Components of MACD
- MACD Line: Calculated by subtracting the 26-period EMA from the 12-period EMA. Formula: MACD Line = 12-Period EMA − 26-Period EMA
- Signal Line: A 9-period EMA of the MACD Line itself. This smooths out the MACD Line and creates tradeable crossover signals.
- Histogram: The visual bar chart that represents the difference between the MACD Line and the Signal Line. When the MACD Line is above the Signal Line, the histogram is positive (plotted above zero). When below, it's negative.
The standard MACD settings are therefore expressed as (12, 26, 9) — the three numbers you'll see on most charting platforms. These defaults were optimized for daily charts but are widely used across timeframes.
Quick Example: Suppose AAPL's 12-period EMA is $215.40 and its 26-period EMA is $210.80. The MACD Line would be +4.60. If the 9-period EMA of that MACD Line (the Signal Line) sits at +3.20, the histogram would show +1.40 — indicating positive and growing momentum.
How to Read MACD: The Key Signals Every Trader Uses
Knowing what MACD is means little without knowing how to interpret it. There are four primary signal types that traders watch for on any MACD chart.
1. MACD Crossovers (The Most Common Signal)
A bullish MACD crossover occurs when the MACD Line crosses above the Signal Line. This suggests upward momentum is strengthening and is often used as a buy signal. Conversely, a bearish MACD crossover occurs when the MACD Line crosses below the Signal Line, suggesting momentum is turning negative.
For example, in early 2026, NVDA showed a clear bullish MACD crossover after a brief consolidation period near the $138 level. The MACD Line moved above the Signal Line while both remained above the zero line — a particularly strong confirmation of renewed upside momentum. Traders who acted on that crossover with a position near $140 saw the stock push toward $158 over the following three weeks.
2. Zero Line Crossovers (Trend Confirmation)
When the MACD Line crosses above zero, it means the 12-period EMA has moved above the 26-period EMA — a sign that the short-term trend is now bullish. When MACD crosses below zero, the opposite is true. Zero line crossovers are slower signals than crossovers with the Signal Line, but they carry more weight as trend-confirmation tools.
Many professional traders use zero line crossovers to filter trades: they only take bullish signals when MACD is above zero and bearish signals when it's below. This simple filter eliminates a significant number of false signals in trending markets.
3. MACD Histogram Analysis
The histogram is often the most underappreciated part of MACD. Rather than waiting for a full crossover, skilled traders watch for the histogram to shrink — a sign that momentum is fading even before the crossover happens.
When the histogram bars are growing taller (in either direction), momentum is accelerating. When they begin contracting, momentum is weakening. A histogram that moves from large negative bars to smaller negative bars — even while still below zero — can signal that selling pressure is exhausting itself and a reversal may be near.
4. MACD Divergence (The Most Powerful Signal)
MACD divergence is widely considered the most powerful signal the indicator generates. It occurs when the price action and the MACD indicator move in opposite directions.
- Bullish Divergence: Price makes a new lower low, but MACD makes a higher low. This suggests selling momentum is weakening despite the continued price decline — a potential reversal signal.
- Bearish Divergence: Price makes a new higher high, but MACD makes a lower high. This suggests buying momentum is fading even as prices continue rising — a potential topping signal.
Divergence is similar in concept to RSI divergence, another powerful technique covered in our guide on RSI Divergence Explained: Master Bullish & Bearish Signals. When both MACD and RSI show divergence simultaneously, the signal reliability increases substantially.
MACD vs RSI: How These Two Indicators Compare
One of the most common questions from traders learning what is MACD is how it compares to the Relative Strength Index (RSI). Both are momentum indicators, but they measure different things and work best in different scenarios.
If you're new to RSI, our comprehensive guide What Is RSI? The Complete Beginner's Guide provides an excellent foundation. Here's how the two indicators differ:
- MACD measures the relationship between two moving averages — it excels at identifying trend direction and momentum shifts in trending markets.
- RSI measures the speed and magnitude of price changes on a 0–100 scale — it excels at identifying overbought and oversold conditions. Learn more in our article on RSI Overbought and Oversold Levels: Master the Signals.
- MACD has no fixed upper or lower bounds, making it better for trend-following. RSI's bounded scale makes it more useful for mean-reversion strategies.
- In choppy, sideways markets, MACD tends to generate more false signals. RSI can be more reliable in those conditions.
The practical takeaway? Use both together. When MACD signals a bullish crossover AND RSI is recovering from oversold territory, that's a far more compelling trade setup than either signal alone. For a deeper exploration of combining these tools, see our guide on How to Use RSI in Trading: The Ultimate Step-by-Step Guide.
MACD Settings: Should You Adjust the Default Parameters?
The default MACD settings of (12, 26, 9) were designed for daily charts and remain the standard for good reason — they strike a balance between responsiveness and reliability. However, experienced traders do adjust these settings based on their trading style and timeframe.
Common MACD Setting Adjustments
- For faster signals (short-term/day traders): Try (5, 13, 5) or (8, 17, 9). Shorter periods make MACD more sensitive to price changes but increase the number of false signals.
- For slower, more reliable signals (swing/position traders): Try (19, 39, 9) or even (24, 52, 18). These settings filter out market noise but generate fewer trade signals overall.
- For cryptocurrency markets: Many crypto traders use shorter settings like (6, 13, 5) due to the higher volatility and 24/7 trading nature of crypto assets.
The principle here is similar to adjusting RSI periods — longer lookback windows produce smoother, more reliable signals while shorter ones produce more frequent but noisier ones. Our article on RSI Settings: Master the Best Period for Your Strategy explores this trade-off in detail for RSI, and the same logic applies to MACD.
Our recommendation for most beginners: start with the default (12, 26, 9) settings and master interpreting those signals before experimenting with custom parameters.
Practical MACD Trading Strategy: A Step-by-Step Example
Let's walk through a realistic trade setup using MACD on AMZN in 2026 to illustrate how these concepts work in practice.
Setting Up the Trade
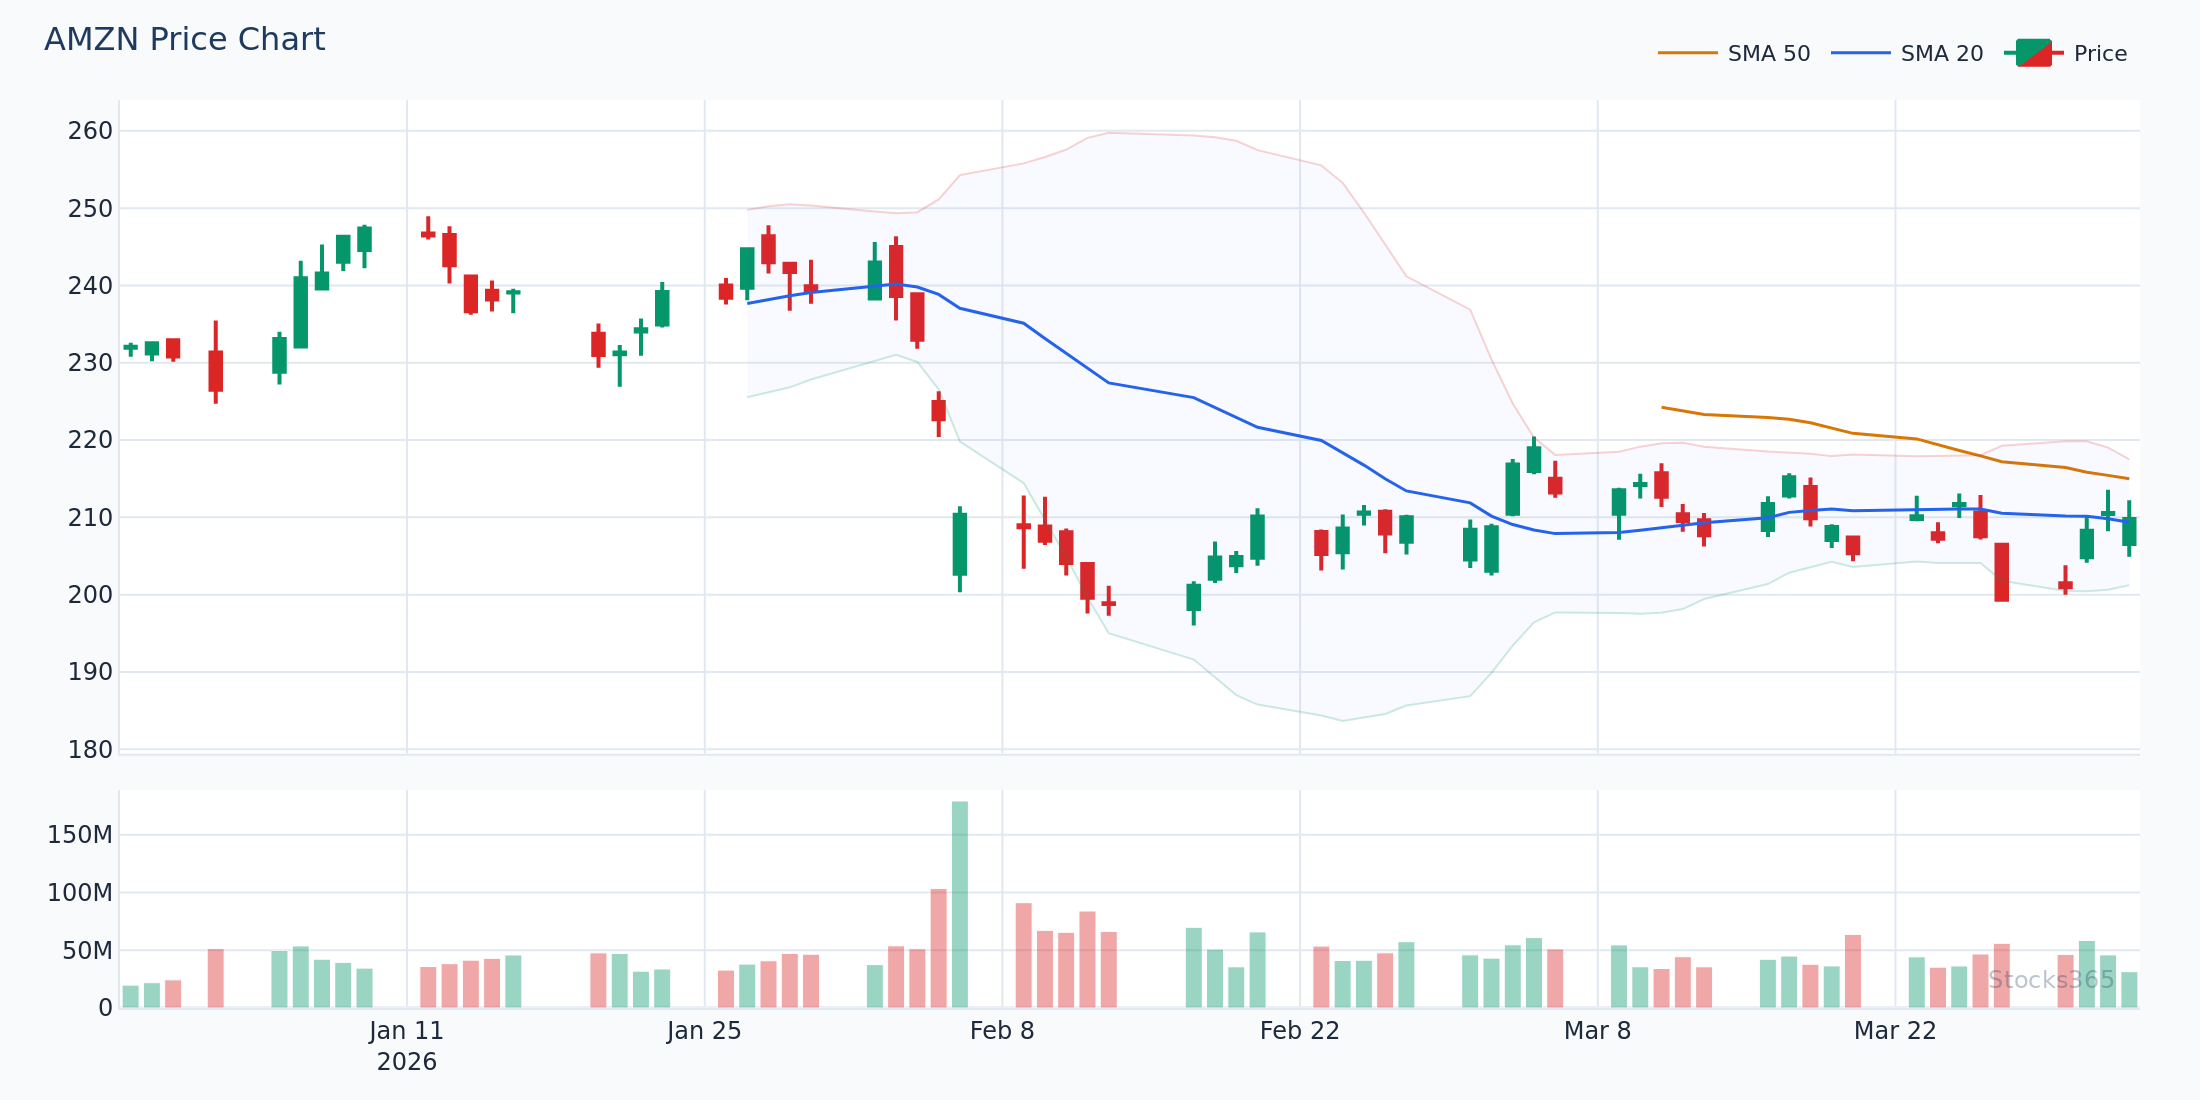
Suppose AMZN has been consolidating between $230 and $242 for several weeks after a broader market pullback. You open the daily chart and observe the following:
- The MACD Line is sitting just below the Signal Line, and both are below the zero line — indicating a recent bearish phase.
- The histogram bars, while still negative, are visibly shrinking over the past five sessions — suggesting selling momentum is fading.
- RSI has recovered from a reading near 32 and is now trending back toward 50 — consistent with the MACD story.
Two days later, the MACD Line crosses above the Signal Line while both move toward the zero line. The histogram turns positive. AMZN's price breaks above the $242 resistance level on above-average volume.
Executing the Trade
- Entry: $243.50 (breakout confirmation with MACD crossover)
- Stop Loss: $236.00 (below the consolidation range)
- Target: $262.00 (next significant resistance level)
- Risk/Reward: Approximately 1:2.5
This is the power of MACD used in context — not as a standalone trigger, but as confirmation that momentum supports the price action you're already seeing. The Stocks365 signals dashboard automatically scans for these high-probability MACD setups across thousands of stocks, saving traders hours of manual chart analysis.
Common MACD Mistakes Beginners Make
Understanding what is MACD also means understanding where traders go wrong. Here are the most frequent mistakes to avoid:
Mistake 1: Using MACD as a Standalone Indicator
MACD is a lagging indicator — it's derived from moving averages, which means it reacts to price rather than predicting it. Relying on MACD crossovers alone, without considering price structure, volume, or other indicators, leads to a high rate of false signals — particularly in choppy, sideways markets.
Mistake 2: Ignoring the Broader Trend
Taking bullish MACD signals in a strong downtrend — or bearish signals in a strong uptrend — is a recipe for losses. Always confirm that your MACD signal aligns with the dominant trend on a higher timeframe. A bullish crossover on a 1-hour chart means far more if the daily chart is also in a clear uptrend.
Mistake 3: Chasing the Signal Line Crossover
By the time a MACD crossover becomes visually obvious, much of the initial move has already occurred. Watching the histogram for early signs of momentum shifts — as described above — gives you an earlier, higher-quality entry. Consider pairing this with divergence analysis for even earlier signals. For a related advanced technique, explore our guide on Hidden RSI Divergence: The Advanced Signal Most Traders Miss.
Mistake 4: Applying the Same Settings Everywhere
Default MACD settings were designed for daily equity charts. Applying them unchanged to 5-minute charts or weekly crypto charts without adjustment will produce signals that are either too noisy or too slow. Match your settings to your timeframe and asset class.
How Stocks365 Uses MACD in Its Signal System
At Stocks365, MACD is one of several momentum indicators integrated into our proprietary trust score system. Rather than presenting raw MACD crossovers as trade recommendations, our platform contextualizes MACD signals within a broader analysis framework — evaluating trend strength, volume confirmation, support and resistance levels, and complementary indicators like RSI.
When a stock like AAPL generates a MACD bullish crossover alongside a high Stocks365 trust score, it means that signal has been validated across multiple analytical dimensions — not just one indicator firing in isolation. This multi-factor approach is designed to surface the highest-probability setups while filtering out the noise that leads beginner traders astray.
You can explore live MACD-driven signals for hundreds of stocks directly on our signals dashboard.
MACD and Other Momentum Indicators: Building a Complete Toolkit
As you advance beyond the basics of what MACD is, it's worth building a complete momentum indicator toolkit. MACD pairs well with a variety of other technical tools:
- MACD + RSI: The most popular combination. RSI confirms overbought/oversold conditions while MACD confirms trend momentum. Both together significantly filter false signals.
- MACD + Stochastic Oscillator: Useful for shorter timeframes. The Stochastic adds sensitivity to recent price ranges. Compare these tools in our RSI vs Stochastic Oscillator: The Essential Guide.
- MACD + Volume: Volume is the most powerful MACD confirmation tool. A bullish crossover accompanied by rising volume carries significantly more weight than one on declining volume.
- MACD + Support/Resistance: MACD signals generated at key price levels — particularly when price bounces from established support or breaks through resistance — offer the most reliable trade setups.
- MACD (Moving Average Convergence Divergence) measures momentum by tracking the relationship between a 12-period and 26-period EMA.
- The three components — MACD Line, Signal Line, and Histogram — each provide different but complementary insights.
- The four main signals are: Signal Line crossovers, Zero Line crossovers, Histogram momentum shifts, and MACD divergence.
- Default settings (12, 26, 9) work well for most daily chart traders; adjust for different timeframes and asset classes.
- MACD is most powerful when combined with RSI, volume analysis, and price structure — not used in isolation.
- Divergence between MACD and price is often the earliest and most reliable reversal signal.
- Avoid common mistakes: don't trade against the dominant trend, don't chase crossovers, and don't apply one-size-fits-all settings.
Frequently Asked Questions About MACD
What is MACD in simple terms?
MACD is a momentum indicator that shows whether the short-term trend of a stock or asset is gaining or losing speed. It does this by comparing two moving averages of different lengths — when they're moving apart (diverging), momentum is strong; when they're coming together (converging), momentum is weakening.
Is MACD a leading or lagging indicator?
MACD is primarily a lagging indicator because it's based on moving averages, which are derived from historical prices. However, MACD divergence signals and histogram analysis can provide early warning of potential reversals — giving it some leading characteristics when used skillfully.
What is a good MACD signal to trade?
The strongest MACD signals typically combine multiple factors: a Signal Line crossover that occurs near the zero line (rather than at an extreme), a histogram that has clearly reversed direction, and confirmation from a second indicator such as RSI recovering from oversold levels. Volume confirmation further strengthens any MACD signal.
Can MACD be used for day trading?
Yes, MACD can be adapted for day trading, but the default (12, 26, 9) settings are typically too slow for short intraday timeframes. Day traders commonly use faster settings such as (5, 13, 5) or (6, 13, 5) and apply MACD to 5-minute or 15-minute charts. Even so, shorter timeframe MACD signals carry more noise and benefit greatly from additional confirmation tools.
How is MACD different from RSI?
MACD measures the relationship between two moving averages and has no fixed upper or lower boundary — it excels at identifying trend direction and momentum. RSI measures the speed of price changes on a bounded 0–100 scale and is better at identifying overbought and oversold extremes. The two indicators complement each other well and are commonly used together for higher-confidence signals. For a full breakdown of RSI, visit our guide What Is RSI? The Complete Beginner's Guide.