
Adaptive Moving Averages: How KAMA and VIDYA Outperform Traditional Indicators
Most moving averages are dumb. They apply the same smoothing regardless of whether the market is trending hard or chopping sideways. An adaptive moving average fixes that — and once you understand how, you won't want to go back.
KAMA (Kaufman's Adaptive Moving Average) and VIDYA (Variable Index Dynamic Average) are two of the most powerful adaptive moving average indicators available to retail traders in 2026. Both automatically adjust their sensitivity based on actual market conditions. When volatility is high and price is trending, they react fast. When the market chops, they slow down and filter out the noise.
Across 3,332 signals backtested by Stocks365, simple moving average crossovers produced a win rate of just 50.9% (profit factor: 1.06 over a 10-day holding period). That's barely better than a coin flip. Adaptive moving averages — by contrast — are designed to improve those odds by eliminating the false signals that kill standard MA strategies. Our research dashboard breaks down exactly where and why those edge cases emerge.
What Is an Adaptive Moving Average?
An adaptive moving average is a moving average that changes its own smoothing constant dynamically, based on a measure of market condition — typically volatility or trend efficiency.
Traditional MAs use a fixed period. A 20-day EMA always weights the last 20 days. It doesn't care if the market is exploding or flat-lining. An adaptive moving average reads the environment and adjusts accordingly.
Think of it like cruise control that actually watches the road ahead.
Why Fixed-Period Moving Averages Fail in Choppy Markets
When price oscillates without direction, a fast moving average generates constant crossovers — most of them false. A slow moving average lags so far behind that by the time it signals, the move is over. There's no fixed period that works in all regimes.
Adaptive moving averages solve this by acting like a fast MA during trending conditions and a slow MA during consolidation. You get the best of both worlds without manually switching settings.
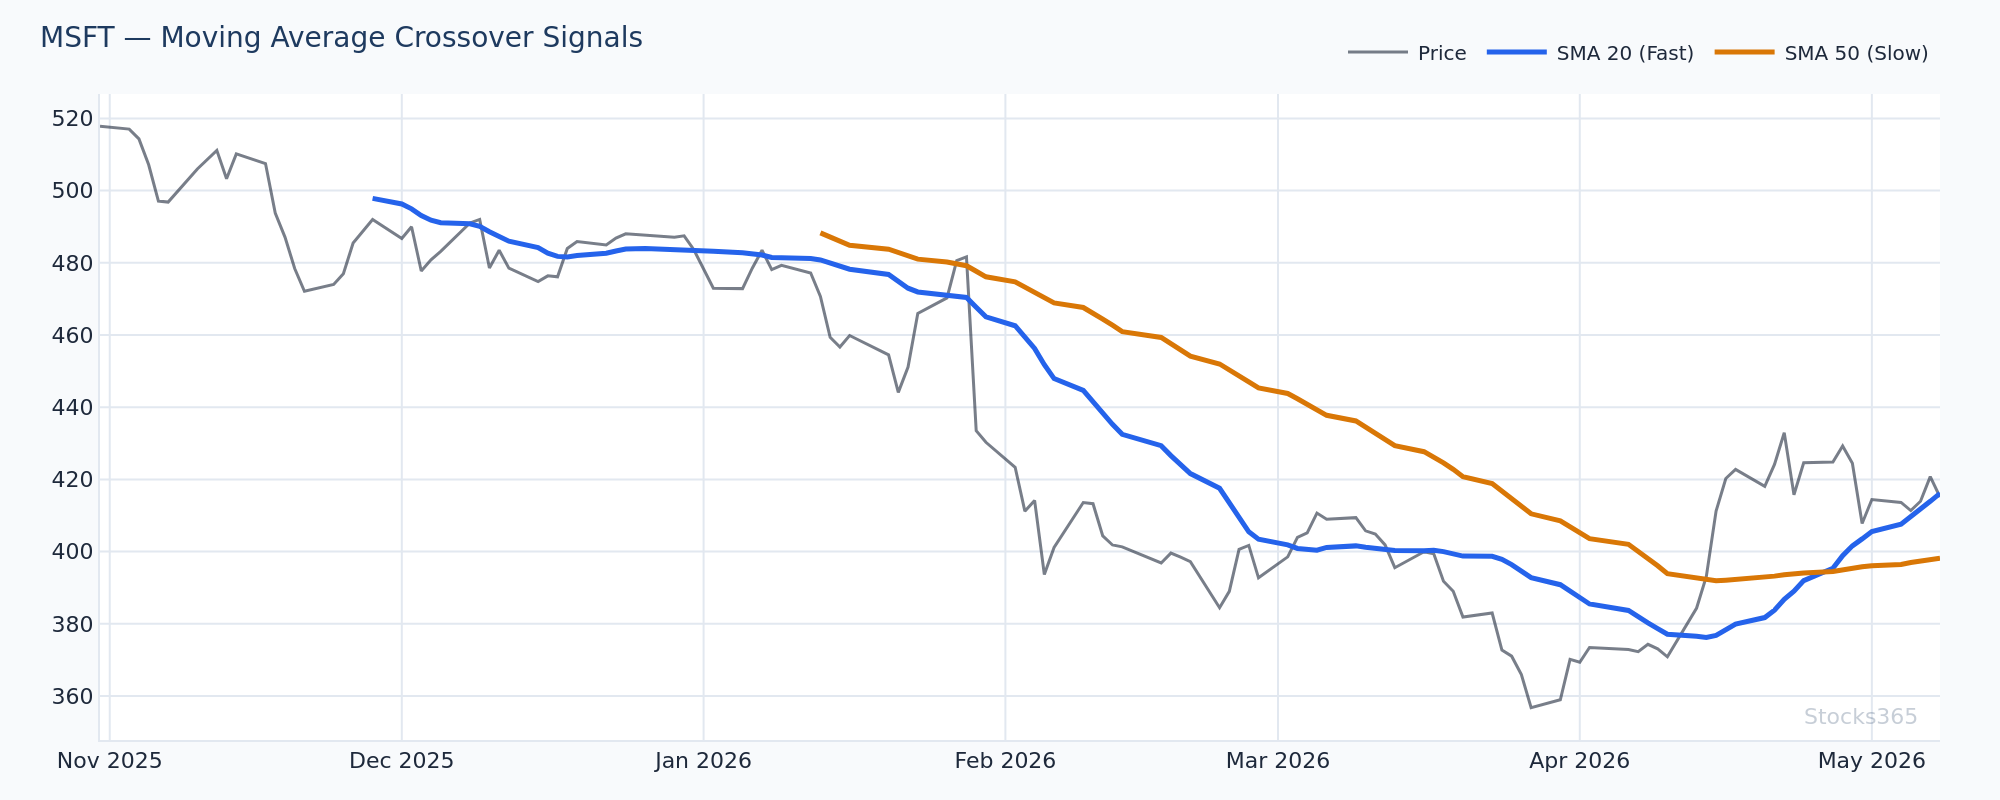
This chart shows how a standard 20-EMA generates multiple crossover signals during a sideways consolidation phase, while KAMA flattens and ignores the noise. When price breaks out decisively, KAMA accelerates and aligns with the trend. A widening gap between KAMA and the 20-EMA confirms the trend is gaining genuine momentum — a narrowing or cross back invalidates the breakout thesis.
KAMA: Kaufman's Adaptive Moving Average Explained
Perry Kaufman developed KAMA in the 1990s, and it remains one of the most elegant solutions to the noise problem in technical analysis. The core idea is the Efficiency Ratio (ER).
The Efficiency Ratio: KAMA's Intelligence Engine
The Efficiency Ratio measures how efficiently price is moving from point A to point B. A perfectly trending market has an ER of 1.0 — every price move contributes to the trend direction. A perfectly choppy market has an ER near 0 — price moves a lot but goes nowhere.
The formula:
ER = |Price Change over N periods| ÷ Sum of |Individual Daily Price Changes| over N periods
When ER is high (trending), KAMA uses a fast smoothing constant — similar to a 2-period EMA. When ER is low (choppy), KAMA slows to something resembling a 30-period EMA. The transition is smooth and continuous, not binary.
How to Read KAMA in Practice
KAMA generates its most reliable signals in two specific setups:
- Price crosses above KAMA after a flat period: KAMA has been moving sideways (low ER environment), price breaks decisively above it, and KAMA begins to angle upward. This is KAMA confirming a regime shift from range to trend.
- KAMA acceleration: The slope of KAMA steepens noticeably over 3-5 bars. This happens as ER climbs — early signal that trend momentum is building before it's obvious on price alone.
- KAMA flattening during a pullback: Price dips but KAMA barely moves. The ER has dropped — the pullback is noise, not a trend reversal. Strong hands hold here.
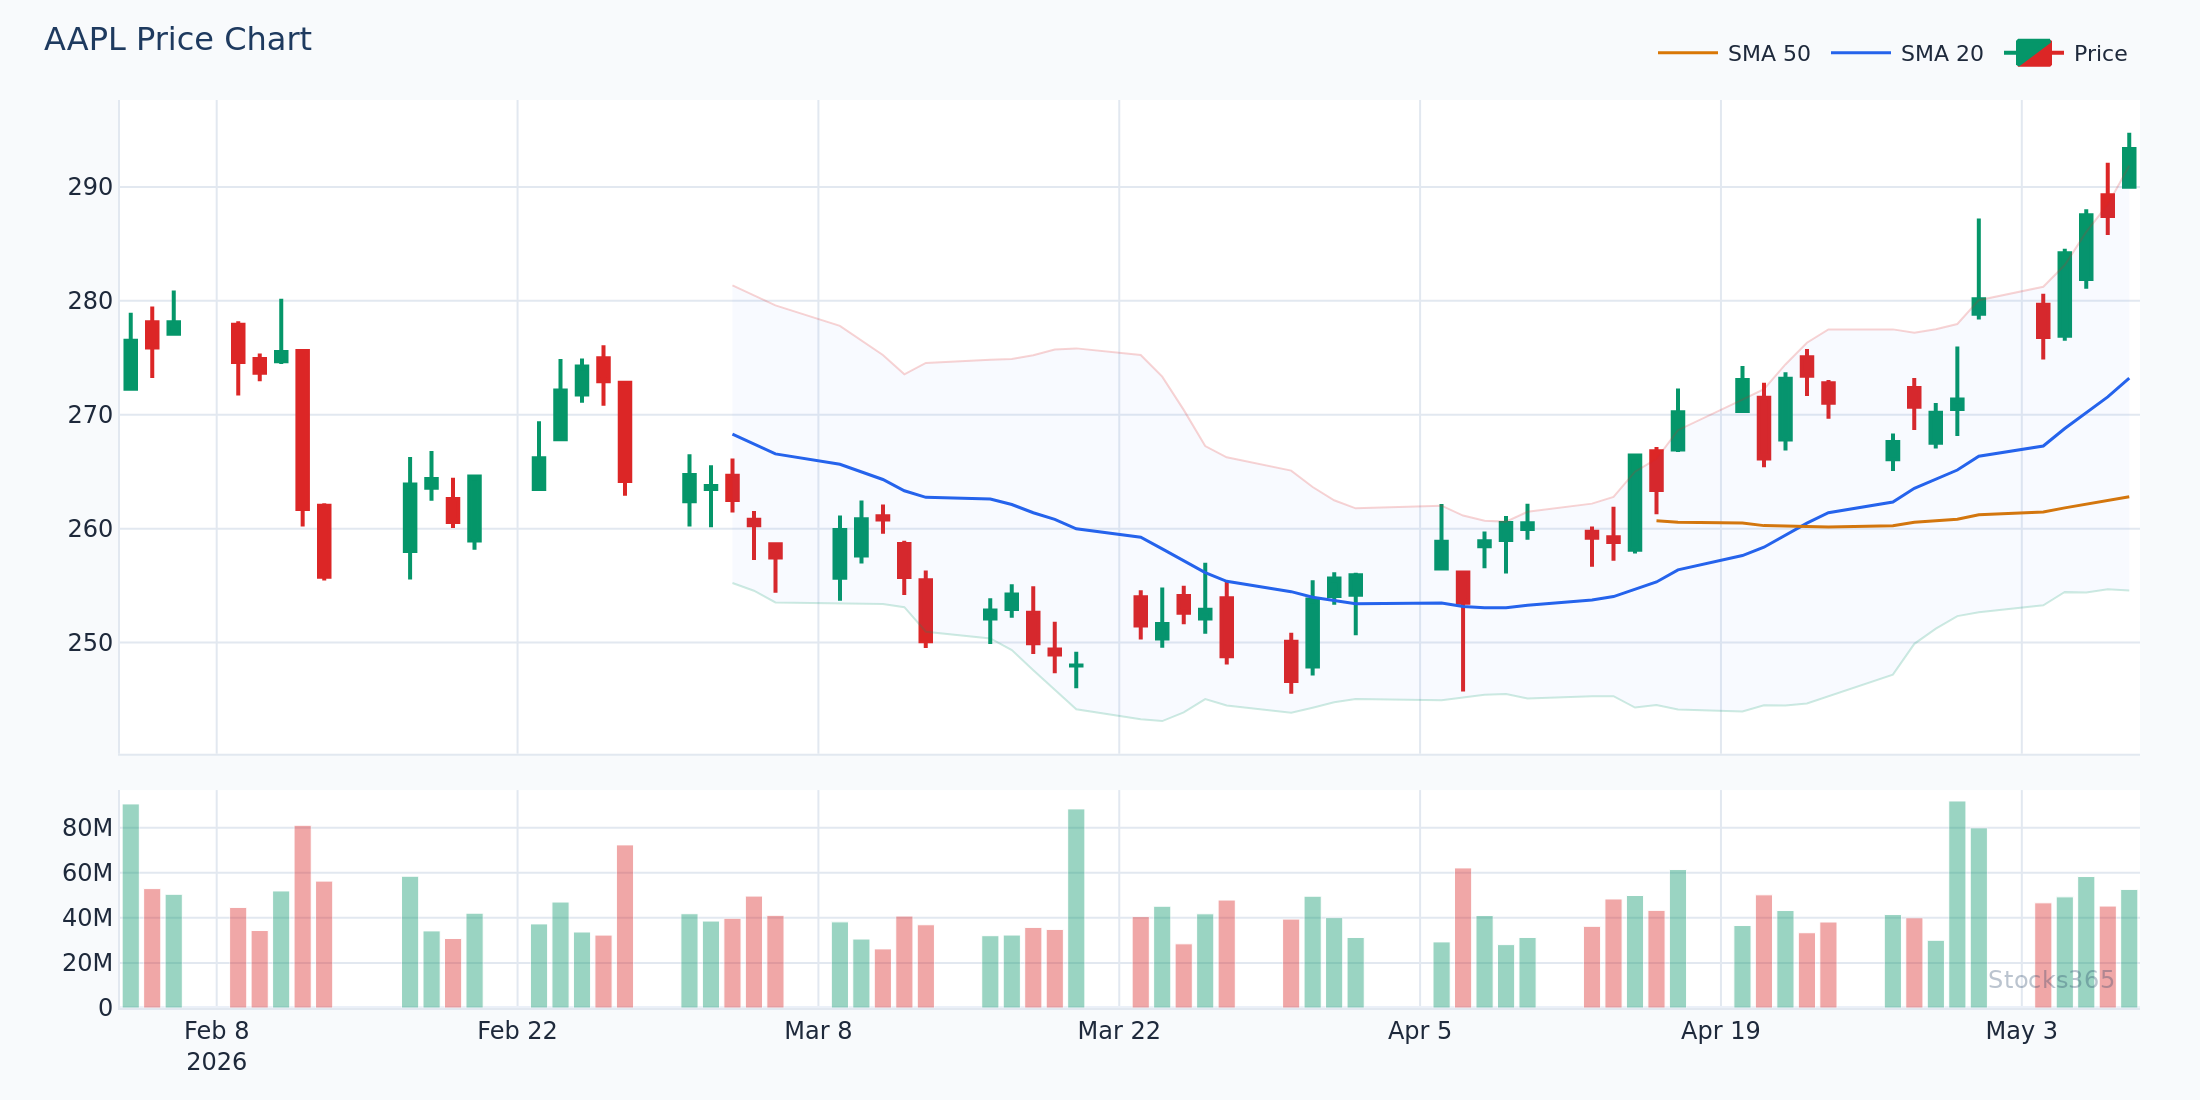
Here, KAMA remains nearly horizontal during the multi-week consolidation, then sharply accelerates as price breaks above with expanding volume. The angle of KAMA's slope is the signal — not just the price-KAMA crossover. A retest of KAMA from above with KAMA still rising confirms the trend; a close below KAMA while it flattens suggests the move is exhausting.
VIDYA: Variable Index Dynamic Average Explained
VIDYA was developed by Tushar Chande and takes a different approach to adaptability. Instead of measuring trend efficiency, VIDYA uses volatility — specifically the ratio of short-term to long-term standard deviation — to adjust its smoothing factor.
The Chande Volatility Index: VIDYA's Core
VIDYA incorporates what Chande called the Volatility Index (VI), calculated as:
VI = Short-term Standard Deviation ÷ Long-term Standard Deviation
When short-term volatility spikes relative to longer-term baseline volatility, VI rises and VIDYA becomes more responsive. When short-term volatility collapses (consolidation), VI drops and VIDYA slows dramatically.
The result is an adaptive moving average that behaves like a fast EMA during breakouts and volatility expansions, and like a glacier during low-volatility compression phases.
KAMA vs. VIDYA: Which One Should You Use?
Both work. The difference is what they measure. KAMA is trend-efficiency based — it responds to directional consistency. VIDYA is volatility-based — it responds to the magnitude of price fluctuation.
- Use KAMA when you want to measure whether price is moving with purpose — ideal for trending stocks and crypto breakouts where efficiency of movement matters.
- Use VIDYA when you want to respond to volatility events — useful for earnings plays, macro announcements, and forex pairs where volatility bursts define the opportunity.
- Use both together as a confirmation pair — when KAMA and VIDYA both angle in the same direction, the regime is unambiguous.
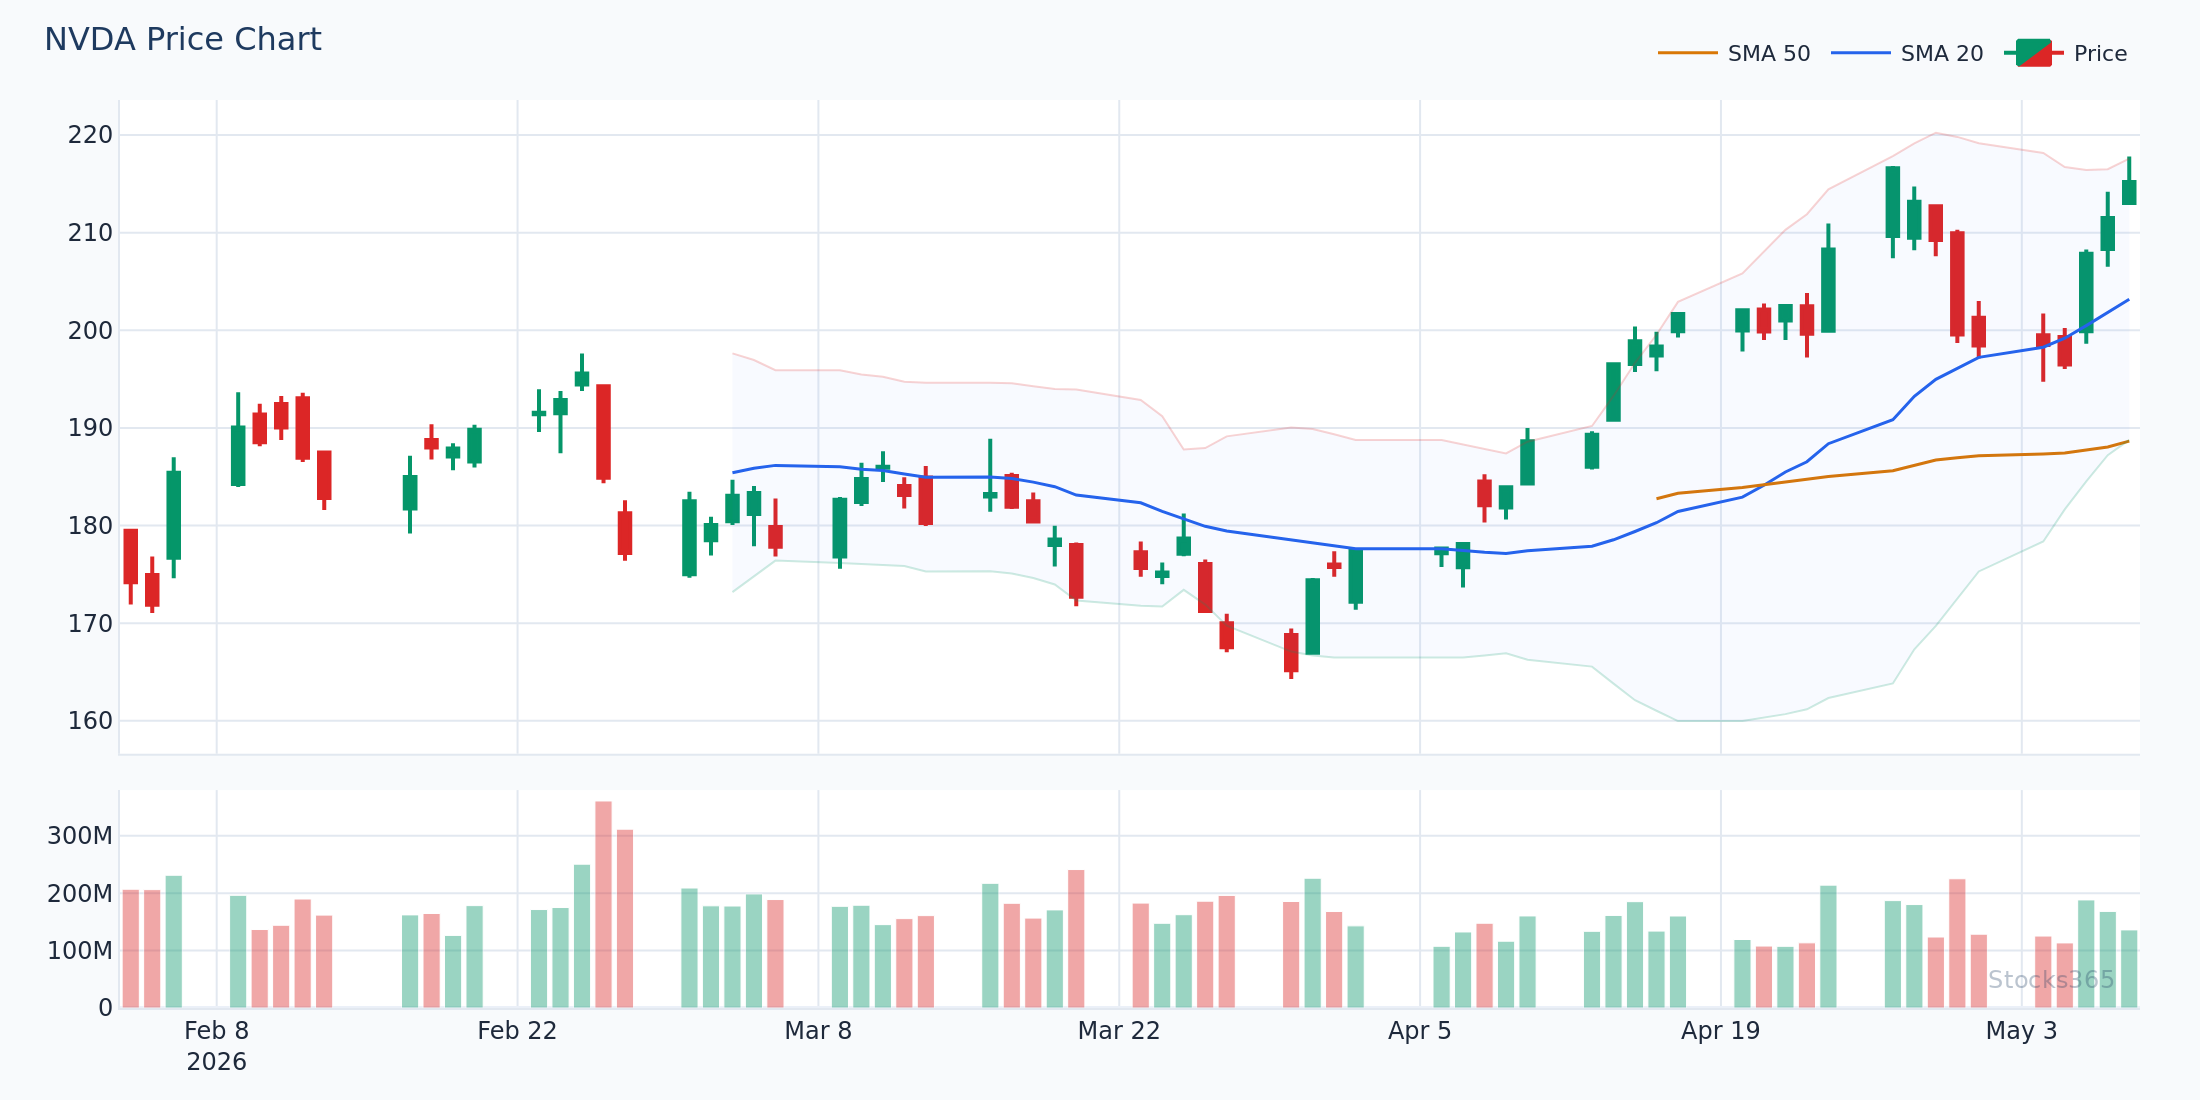
When both KAMA and VIDYA angle upward simultaneously after a volatility compression phase, the confluence is a high-conviction trend signal. The pattern here shows a classic squeeze-to-breakout: both adaptive MAs flatten during the compression, then accelerate in lockstep on the breakout bar. If only one adapts while the other stays flat, treat the signal with caution and wait for alignment.
Combining Adaptive Moving Averages With Other Indicators
Adaptive moving averages are most powerful as a regime filter — not a standalone signal generator.
Adaptive MAs With RSI: A Powerful Combination
Pairing KAMA or VIDYA with RSI creates a layered confirmation system. The adaptive MA tells you what regime you're in. RSI tells you where price is within that regime.
The setup: KAMA is rising (trending regime confirmed). RSI pulls back from overbought toward 40-50 and bounces. That RSI bounce in a confirmed KAMA uptrend is a high-probability long entry. If you're new to RSI mechanics, start with RSI for Beginners: 5 Simple Rules to Start Trading Today.
For advanced users, combining adaptive MA trend confirmation with RSI divergence signals can identify high-conviction turning points — moments when trend momentum is waning before price confirms it. And if you want to push further into RSI tactics, hidden RSI divergence is particularly effective when KAMA is still trending but RSI hints at a continuation setup.
Understanding RSI overbought and oversold levels becomes far more nuanced when you overlay an adaptive MA — because the MA tells you whether an overbought reading means exhaustion or continuation.
Adaptive MAs With MACD
MACD measures momentum divergence between two EMAs. Adding KAMA as a trend filter is straightforward: only take MACD crossover signals in the direction of the KAMA slope. Counter-trend MACD signals get ignored entirely. This single filter dramatically reduces whipsaws. For forex traders, this combination is especially effective — see MACD in Forex Trading: Master Currency Pair Strategies for a deep dive.
Here's What Most Traders Get Wrong
Most traders think adaptive moving averages are just "better" moving averages that work everywhere. They apply KAMA or VIDYA to a 5-minute chart, see a crossover, and enter — the same mistake they made with the 20-EMA.
The misconception: adaptive MAs eliminate the need for a trend filter. They don't. They ARE the trend filter. KAMA and VIDYA tell you the regime — fast slope means trend, flat line means stay out. The entry trigger still needs to come from a separate tool: RSI, volume, MACD, or a candlestick pattern. Treating an adaptive MA crossover as an entry signal on its own ignores what makes these tools special in the first place. Use them to define the playing field, then use a momentum indicator to call the play.
Adaptive Moving Averages Across Asset Classes
Performance varies. Our backtesting of standard SMA-based signals — the baseline that adaptive MAs are designed to improve upon — shows dramatic differences across asset classes. Simple SMA crossover signals on crypto showed a 66.8% win rate (n=3,332), while the same approach on forex dropped to just 42.5%. This gap exists precisely because crypto's high-volatility trending regimes suit moving average strategies, while forex's mean-reverting, range-heavy conditions punish them.
Adaptive moving averages partially close this gap in forex — but they don't eliminate it. VIDYA in particular helps in forex by slowing down during the tight range-bound sessions that dominate currency pairs. Combine this with RSI trendline analysis and you have a framework that can work even in lower-trending environments.
For stocks — especially large-cap tech — KAMA performs well during multi-month trending phases. For crypto, VIDYA's volatility responsiveness makes it the sharper tool during breakout phases.
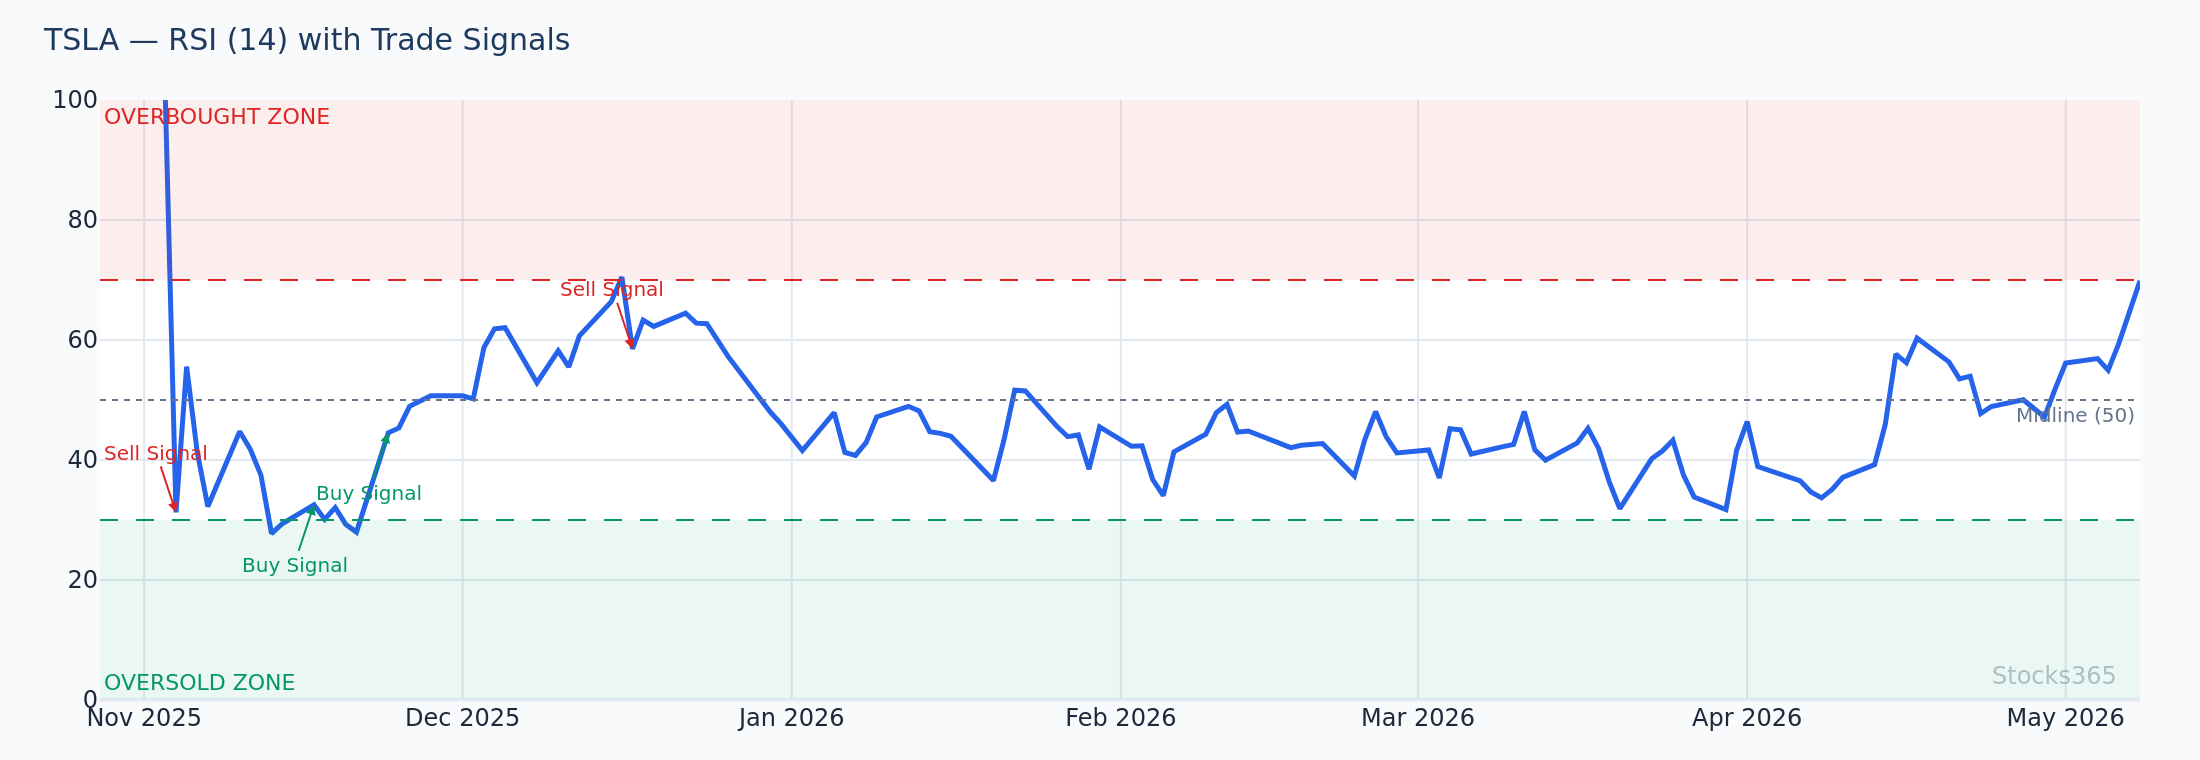
This chart shows VIDYA accelerating upward as TSLA enters a high-volatility trending phase, while RSI dips from elevated levels and finds support near 50. The bounce off RSI 50 while VIDYA remains steeply angled is the entry trigger — price hasn't broken the trend, just paused. The setup fails if VIDYA flattens or reverses while RSI fails to reclaim 50 on the bounce attempt.
Practical Setup Examples Using KAMA and VIDYA
Setup 1: The KAMA Breakout Confirmation
Price consolidates for several weeks. KAMA is nearly flat — Efficiency Ratio is low. Volume contracts. Then price breaks above the consolidation range with a strong candle and volume surging 1.5x to 2x average. KAMA immediately begins to angle upward. The ER jumps. This is the signal: price has broken out AND KAMA confirms the regime shift. Enter on the first pullback to KAMA.
Setup 2: The VIDYA Squeeze-to-Trend
Short-term volatility has compressed below its long-term average. VIDYA is moving sideways, almost indistinguishable from a flat line. This is a pre-breakout condition. When volatility expands — a sharp multi-day move — VIDYA accelerates. Trade in the direction of that acceleration. The squeeze-to-trend is one of the cleanest setups in technical analysis, and VIDYA makes it quantifiable.
Setup 3: Dual Adaptive MA Divergence
Run both KAMA and VIDYA simultaneously. When they diverge — one rising while the other flattens — the market is in a transitional regime. Neither trend nor range dominates. This is a no-trade zone. Wait for both to align. When they do, the conviction is highest.
Optimizing Adaptive Moving Average Settings
KAMA default settings are typically: 10-period lookback, fast EMA of 2, slow EMA of 30. These work well for daily charts on stocks. For higher-frequency charts, reduce the lookback to 5-7 periods. For weekly charts, extend it to 15-20.
VIDYA typically uses a 9-period short-term standard deviation against a 26-period long-term baseline, with a 14-period base EMA. Adjust the short-term period down for more responsiveness, up for more stability.
Understanding how period settings affect indicator behavior is fundamental — the same logic applies to RSI. If you want to calibrate your approach, RSI Settings: Master the Best Period for Your Strategy covers the optimization framework clearly. And if you want to understand what's actually happening mathematically under the hood, How RSI Is Calculated gives you the same first-principles foundation.
What to Watch For
- KAMA slope acceleration after flat phase: When KAMA transitions from horizontal to a 30°+ angle within 3-5 bars, and volume confirms the move, the Efficiency Ratio is rising fast. This is one of the earliest trend confirmation signals available — often visible before the move becomes obvious.
- VIDYA compression below baseline volatility: When the VI ratio drops below 0.5 (short-term volatility less than half the long-term), a volatility expansion is statistically likely. Position for a breakout in either direction, then follow VIDYA's slope to determine which side won.
- Dual KAMA/VIDYA alignment after divergence: After a period where KAMA and VIDYA point in different directions, their convergence on the same slope direction signals a resolved regime. The first 3-5 bars after alignment are historically the highest-probability window.
- RSI pullback to 40-50 while KAMA remains rising: In a confirmed KAMA uptrend, RSI dips to the 40-50 zone without KAMA flattening. This is a continuation setup — the trend is intact and RSI is giving a re-entry opportunity rather than a reversal signal.
- KAMA flattening near a prior resistance level: When KAMA slows as price approaches a significant technical level, the ER is dropping — the market is hesitating. Wait for a confirmed break with KAMA re-accelerating before adding exposure.
How Stocks365 Uses This
Stocks365's trust score system integrates adaptive moving average regime detection as part of its trend agreement scoring — one of 12+ indicators that collectively determine a signal's trust level. Specifically, KAMA slope direction and steepness contribute to the regime classification layer: signals generated in confirmed trending regimes (rising KAMA, high ER) receive higher agreement scores than those generated during flat or ambiguous KAMA conditions.
When you view a signal on the Stocks365 signals dashboard — for example, checking the AAPL signal page — the trust score already factors in whether the adaptive MA environment supports or contradicts the momentum signal. Stocks365 backtested this framework across thousands of setups and found that filtering signals by regime quality (using adaptive MA slope as the gate) meaningfully improves the quality distribution of signals surfaced to traders.
Key Takeaways
- Adaptive moving averages adjust their own smoothing based on market conditions — fast in trends, slow in chop. Fixed-period MAs don't.
- KAMA uses the Efficiency Ratio — a measure of directional movement consistency — to dynamically set its smoothing factor.
- VIDYA uses volatility ratio — short-term vs. long-term standard deviation — to adapt its responsiveness to price action.
- Use adaptive MAs as regime filters, not entry triggers. They define the environment; other tools (RSI, MACD, volume) generate the entry signal.
- KAMA and VIDYA together create a powerful dual-confirmation system. When both align, regime conviction is highest.
- Asset class matters: Adaptive MAs work best in trending, high-volatility environments. Crypto and trending large-cap stocks are the strongest use cases. Forex requires additional filters.
- Optimize settings for timeframe: Shorter lookbacks for intraday, longer for daily/weekly. Default settings are a starting point, not a mandate.