
How to Add Bollinger Bands on TradingView: Full Tutorial (2026)
Bollinger Bands are one of the most widely used technical indicators in active trading — and TradingView makes them accessible in under 60 seconds. But knowing how to add them is only step one. Knowing how to use them is where most traders fall short.
This guide covers everything: the exact steps to add Bollinger Bands on TradingView, how to customize the settings for your strategy, and the specific chart setups that produce the most reliable signals. Whether you trade stocks, crypto, or ETFs, this is the tutorial you save and return to.
Before we dive in: Stocks365 backtested 14,266 Bollinger Squeeze Breakout signals across multiple asset classes and found a profit factor of 1.03 — the only Bollinger Band setup in our sweep that consistently clears breakeven over a 10-day holding period. Crypto led the way at 51.8%. We'll show you exactly what that setup looks like on a TradingView chart.
What Are Bollinger Bands? A Quick Refresher
Bollinger Bands consist of three lines plotted directly on a price chart:
- Middle Band: A 20-period Simple Moving Average (SMA)
- Upper Band: The middle band plus 2 standard deviations
- Lower Band: The middle band minus 2 standard deviations
The bands expand when volatility rises and contract when the market quiets down. That expansion and contraction cycle is the core signal traders look for. If you want the full mathematical breakdown, our deep-dive on how Bollinger Bands work and the math behind them covers the standard deviation formula in detail.
Now let's get them on your chart.
Step-by-Step: How to Add Bollinger Bands on TradingView
Method 1: Using the Indicator Search Bar (Fastest)
This is the quickest route. Works on both desktop and the TradingView mobile app.
- Open any chart on TradingView
- Click the "Indicators" button at the top of the chart toolbar (or press the / shortcut key)
- In the search box, type "Bollinger Bands"
- Select "Bollinger Bands" from the Built-ins section (the official TradingView version)
- The bands appear instantly on your chart
Done. That's it. The default settings load automatically.
Method 2: Using the Pine Script Editor
For traders who want more control, TradingView's Pine Script editor lets you add Bollinger Bands with custom logic baked in. Open the Pine Script Editor at the bottom of the screen and add this one line inside your script:
[length, src, mult] = input(20), input(close), input(2.0) — then call ta.bb(src, length, mult) to return upper, basis, and lower values.]
This method is useful when you're building a full strategy that combines Bollinger Bands with other indicators like the MACD or RSI. For a comparison of oscillators that pair well with Bollinger Bands, see our guide on MACD vs Stochastic Oscillator.
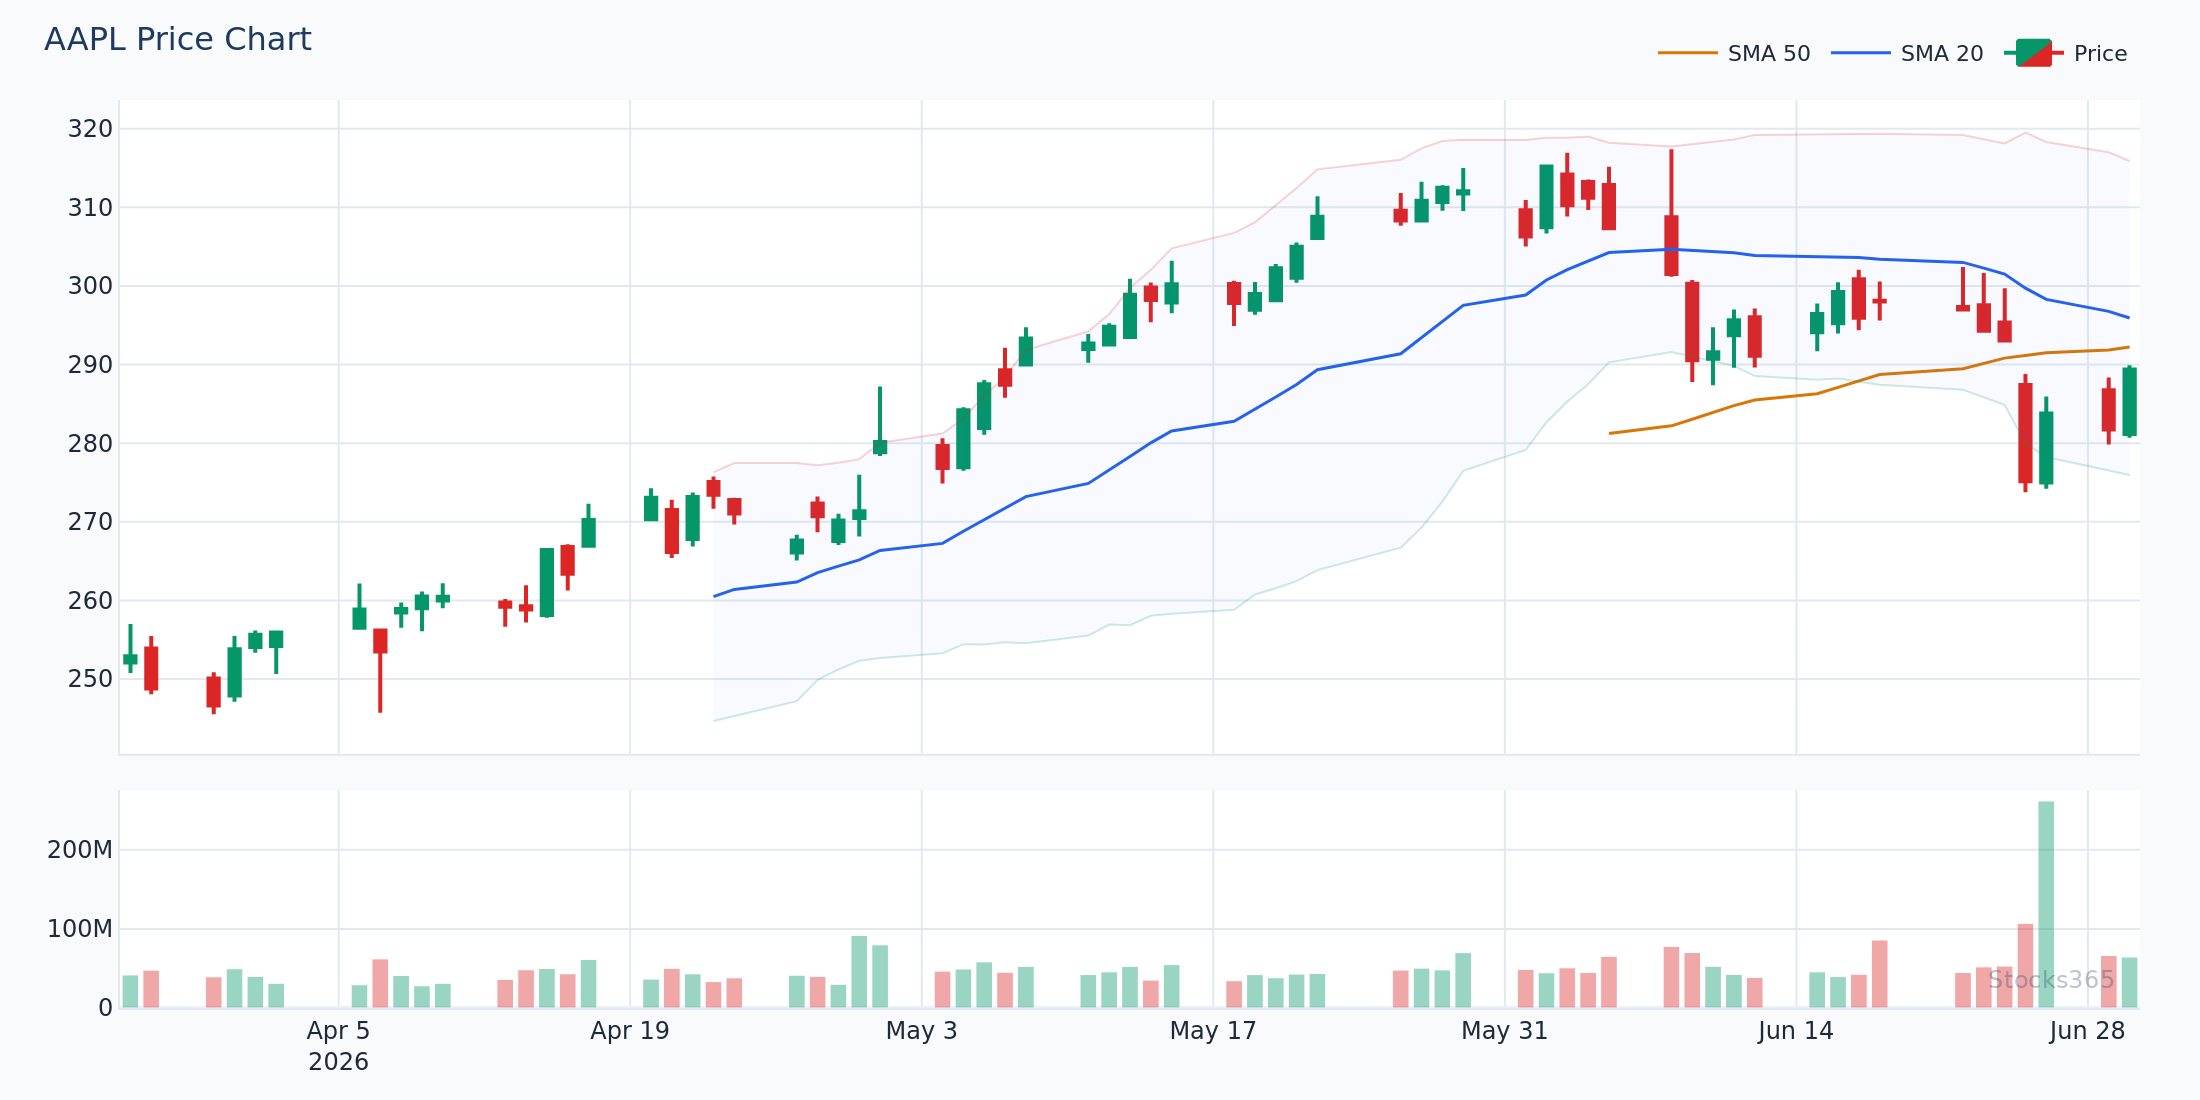
This chart shows price hugging the upper band during a trending phase, with the bands expanding as volatility picks up. When price begins to pull back toward the middle band (the 20-SMA), that's the first sign the momentum is fading. A close back below the middle band — especially on rising volume — typically confirms a short-term reversal or consolidation ahead.
How to Customize Bollinger Bands Settings on TradingView
The default 20-period, 2 standard deviation setting is a solid starting point. But your strategy may demand something different.
Accessing the Settings Panel
- Once the bands are on your chart, click the gear icon (⚙) that appears when you hover over the indicator name in the top-left
- Or double-click directly on any of the three band lines
- The settings panel opens with three tabs: Inputs, Style, Visibility
Key Settings to Adjust
Length (default: 20)
This controls the number of periods used for the moving average. Shorter periods (10–14) make the bands more reactive and tighter around price. Longer periods (50+) smooth out noise and work better on weekly charts for swing traders.
Source (default: Close)
Most traders keep this on Close. Some prefer HL2 (high+low divided by 2) on volatile instruments like crypto to reduce wick noise.
StdDev Multiplier (default: 2.0)
Raising this to 2.5 or 3.0 widens the bands — useful for highly volatile assets where 2.0 gets breached too frequently. Lowering to 1.5 tightens them for more sensitive signals on low-volatility instruments.
Offset (default: 0)
Leave this at 0 unless you're deliberately shifting the bands forward or backward for specific analysis purposes.
Recommended Settings by Trading Style
- Day traders (5-min to 15-min charts): Length 10–14, StdDev 1.5–2.0
- Swing traders (daily charts): Default 20, 2.0 — proven and clean
- Position traders (weekly charts): Length 20–50, StdDev 2.0–2.5
- Crypto traders: Length 20, StdDev 2.5 to account for larger average swings
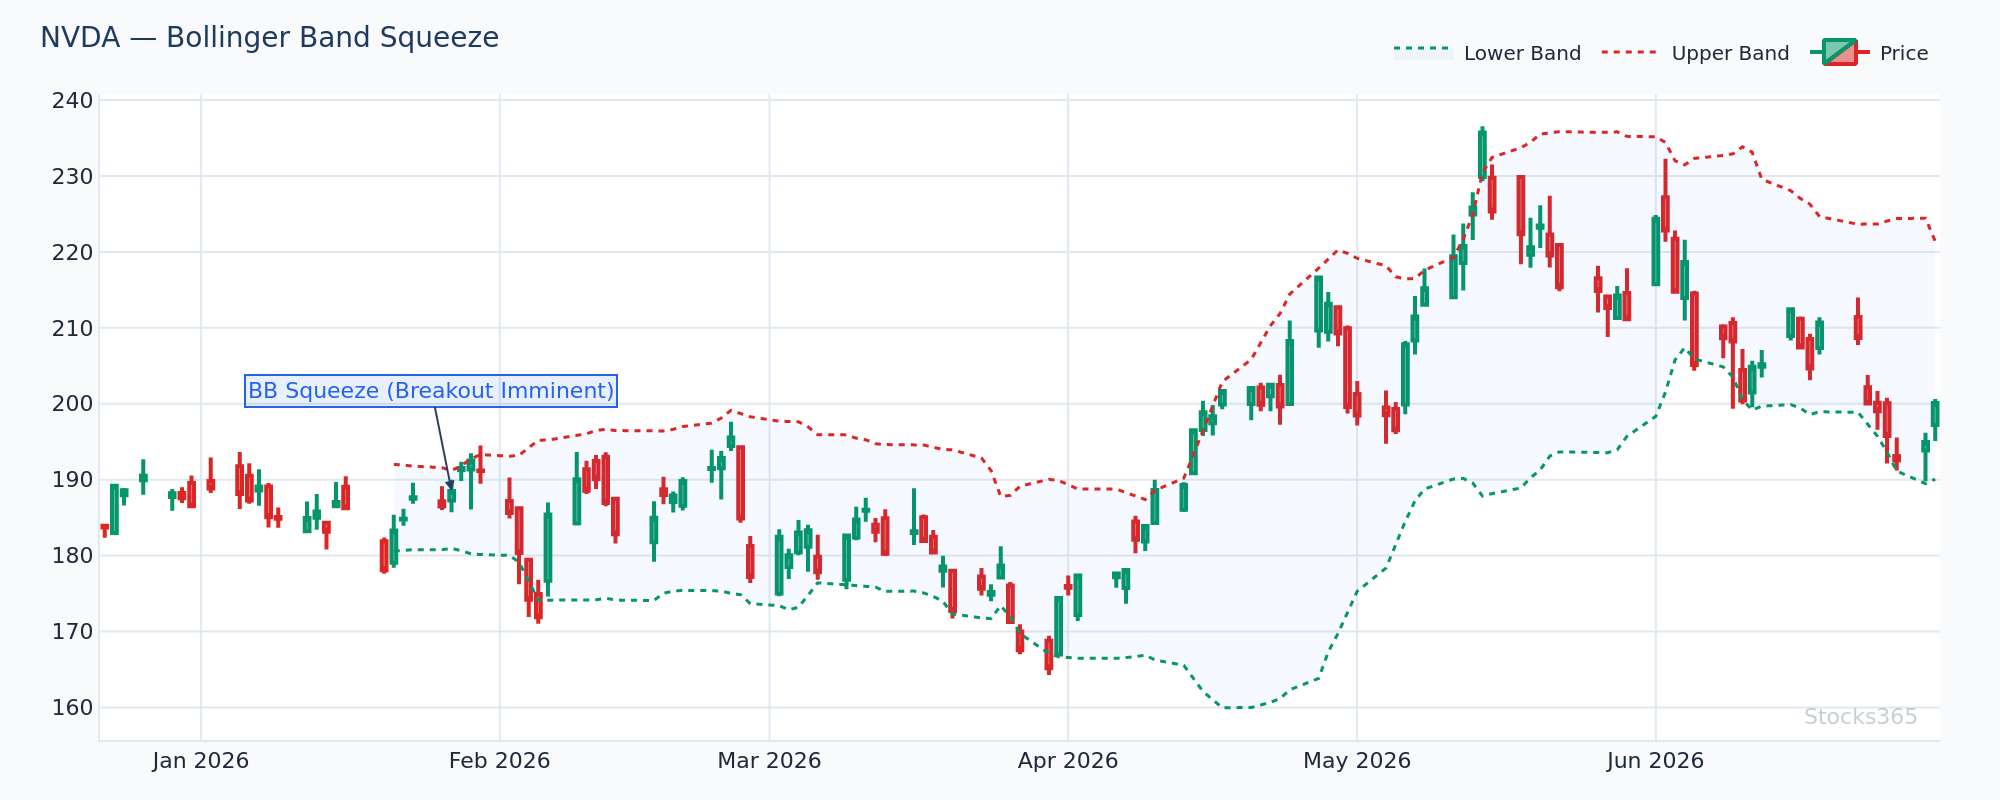
This is the squeeze setup — band width has compressed to a multi-week low, and price is coiling inside a tight range. Historically, this type of low-volatility compression precedes a sharp directional move. The direction isn't confirmed until price breaks and closes decisively outside the bands on strong volume. A false breakout that reverses back inside the bands within 1–2 candles invalidates the setup.
The Bollinger Band Squeeze: The Setup That Actually Works
Most Bollinger Band strategies underperform. The raw numbers prove it. Our analysis of 3,255 Bollinger Upper Band Touch signals found only a 49.6% win rate with a profit factor of 0.88 — meaning those setups lose money in aggregate over a 10-day hold. Chasing upper band touches is a losing game for most traders.
The exception is the squeeze breakout.
Stocks365 backtested 14,266 squeeze breakout signals across stocks, crypto, forex, and commodities. The profit factor hit 1.03 — the only setup in our sweep to clear breakeven. Crypto showed the strongest edge at 51.8%. Check our research dashboard for the full asset class breakdown.
How to Identify a Bollinger Squeeze on TradingView
- Add the Bollinger Bands Width indicator (search "BBW" in the indicators panel) — this plots the gap between upper and lower bands as a separate line below your chart
- Look for BBW dropping to a multi-week or multi-month low
- Price should be consolidating inside a narrow range — candlesticks getting smaller, wicks tightening
- Watch for the first candle that closes decisively outside either band on volume that's at least 1.5x the 20-day average
- That breakout direction becomes your trade bias
Simple. Repeatable. Backtested.
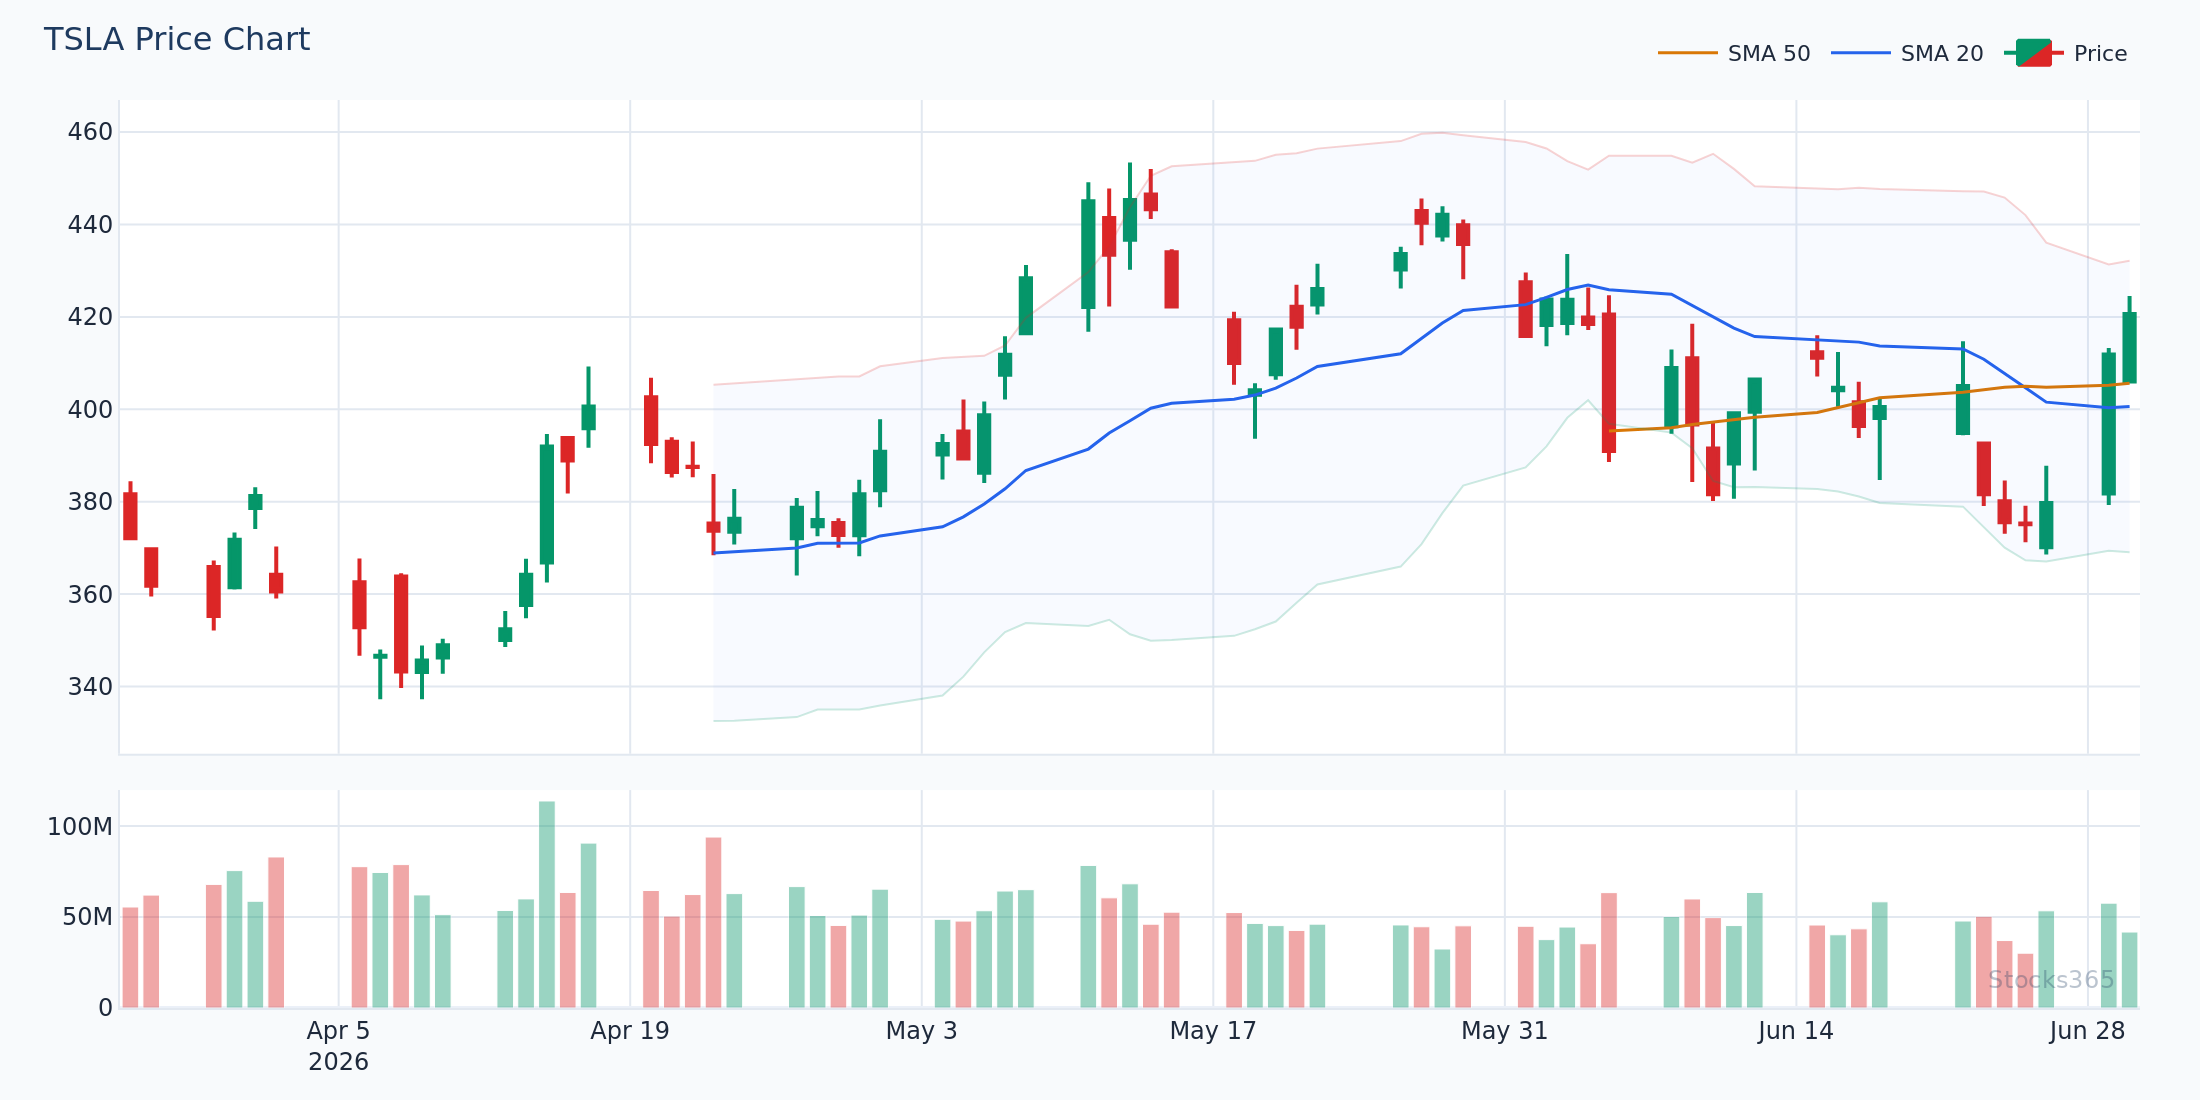
Price has been compressing for several sessions, with Bollinger Band width at its lowest level in weeks. The breakout candle closes above the upper band with a notable volume surge — this is the confirmation traders wait for. If the following session opens and holds above the prior breakout candle's midpoint, the move has legs. A reversal back inside the bands on the next day's close is the main invalidation signal.
Here's What Most Traders Get Wrong
Most traders treat a price touch of the upper Bollinger Band as an automatic sell signal — and a touch of the lower band as an automatic buy. This is wrong. In a strong uptrend, price can walk the upper band for days or even weeks, producing touch after touch with no reversal. Fading every upper band touch in a trending market is how accounts bleed slowly.
The real signal isn't the touch. It's what happens after the touch. Watch for price to close back inside the band after touching or breaching it — that's the actual reversal signal. One close back inside. On meaningful volume. That's your trigger. Without that confirmation candle, you're guessing.
This same principle applies to RSI overbought and oversold levels — the reading itself isn't the signal. The break back through the level is.
Combining Bollinger Bands With Other TradingView Indicators
Bollinger Bands + RSI
This is one of the most common combinations — and for good reason. When price touches the lower Bollinger Band and RSI drops below 30, you have two independent systems agreeing on oversold conditions. When RSI then crosses back above 30 while price closes inside the band, you have a higher-confidence reversal setup.
Bollinger Bands + Volume
Volume is your confirmation layer. Any band touch or squeeze breakout without a volume surge is suspect. Add TradingView's built-in Volume indicator and look for bars that exceed the 20-period volume average. No volume, no conviction.
Bollinger Bands + Stochastic Oscillator
The Stochastic adds momentum timing to Bollinger Band signals. Our research on the Bollinger Bands backtest results shows how this combination performs in real conditions. We also found that BB + Stochastic Double Overbought signals (n=3,026) produced a 49.9% win rate — marginally better in crypto (58.0%) but weak in commodities (40.7%). If you're learning the Stochastic, start with our step-by-step Stochastic guide.
Bollinger Bands + Moving Average Crossovers
The middle Bollinger Band is already a 20-SMA. Some traders add a second moving average — typically the 50-SMA — directly on the chart. When the 50-SMA crosses the middle Bollinger Band from below, it confirms a longer-term trend shift. For a deeper look at crossover strategies, our Moving Average Crossover Strategy guide is worth reading alongside this one. And if you're newer to MAs, review the 7 beginner mistakes with moving averages before stacking too many lines on your chart.
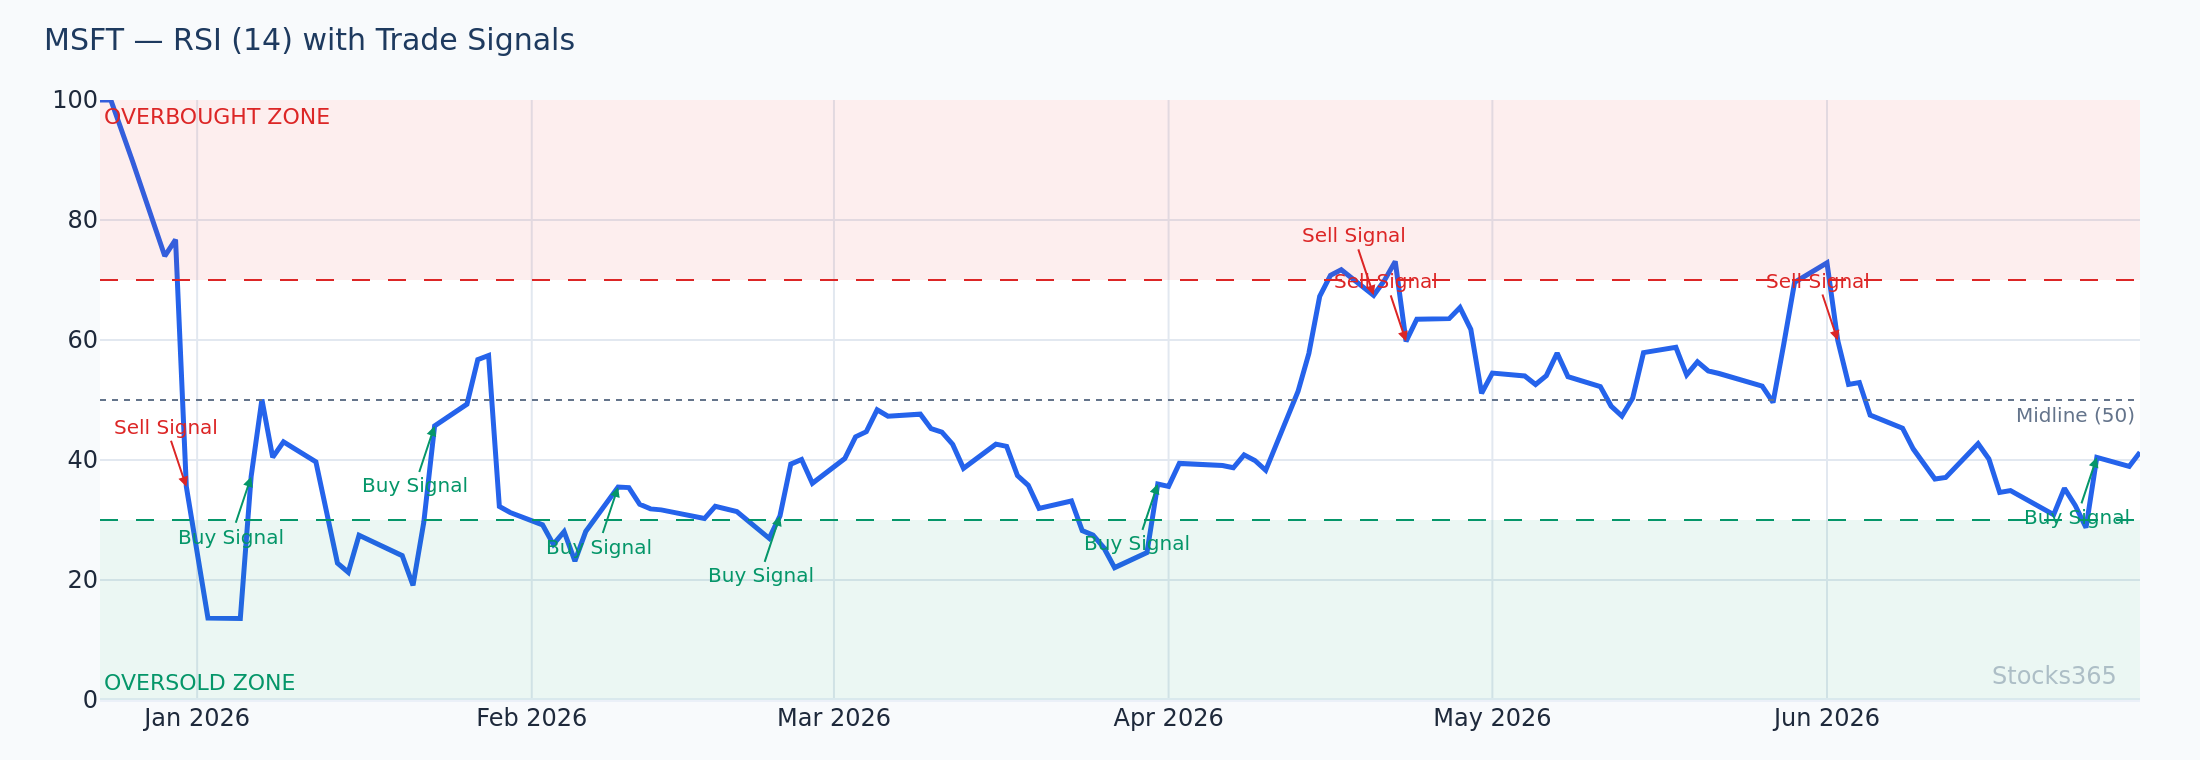
Price has tagged the lower Bollinger Band while RSI simultaneously dips below 30 — a double-confirmation oversold reading. The setup becomes actionable when the next session's candle closes back inside the lower band and RSI begins curling upward. If RSI fails to recover above 30 within 2–3 sessions, the setup weakens and a deeper breakdown should be considered.
Saving Bollinger Bands as a TradingView Template
Once you've dialed in your settings, save them. Don't set this up from scratch every session.
- Set your Bollinger Bands to your preferred parameters
- Add any companion indicators (RSI, Volume, BBW)
- Click "Chart Settings" → "Templates" → "Save as Template"
- Name it (e.g., "BB Swing Setup" or "BB Squeeze Day Trade")
- Apply to any new chart with two clicks
Pro traders run multiple templates for different strategies and timeframes. Build the habit early.
Bollinger Bands for ETF and Index Trading
Bollinger Bands perform differently across asset classes, and ETFs have some unique characteristics worth knowing. Sector ETFs tend to trend more smoothly than individual stocks — band walks are more sustained, and mean-reversion signals are less reliable during strong sector rotations. Our full breakdown on Bollinger Bands for ETF trading covers index and sector-specific setups in detail.
The core adjustment: on broad index ETFs, widen your standard deviation multiplier slightly. The reduced idiosyncratic volatility means 2.0 StdDev touches are statistically less extreme than on individual names.
What to Watch For
- Bollinger Squeeze setups on momentum stocks and crypto: When Bollinger Band Width drops to its lowest level in 20+ sessions, the compression is setting up a volatility expansion. The breakout direction — confirmed by a close outside the band on above-average volume — defines the trade. Crypto shows the strongest edge in this setup based on our backtests.
- Band walk patterns in trending markets: When price repeatedly closes near or above the upper band across multiple sessions without a strong reversal candle, the trend is intact. Fighting it with short positions is a losing strategy. Trade with the band walk, not against it.
- RSI divergence at lower band touches: When price makes a new recent low that touches or breaks the lower band, but RSI makes a higher low, that divergence signals weakening bearish momentum. Combine with a close back inside the band for a higher-confidence long setup.
- Middle band reclaims after a breakdown: When price drops below the 20-SMA (middle band) and then reclaims it on a strong close, this often precedes a re-test of the upper band. Works well on daily charts for swing entries.
- Squeeze breakouts on earnings-adjacent setups: Volatility compression ahead of a known catalyst (earnings, Fed decisions, product launches) creates some of the cleanest squeeze breakouts. The bands have been artificially compressed by low pre-event volume — when the event hits, the expansion is sharp. Size accordingly.
How Stocks365 Uses This
Bollinger Bands are one of 12+ technical indicators that feed into the Stocks365 Trust Score system. Specifically, band position and width contribute to two scoring dimensions: volatility regime classification (squeeze vs. expansion phase) and signal agreement scoring (whether price action at the bands is confirmed by momentum indicators like RSI or Stochastic).
When a stock or ETF shows a squeeze breakout with multi-indicator confirmation, the Trust Score reflects higher signal confidence — which is visible directly on each individual signal page. The system doesn't treat Bollinger Band signals in isolation. It weights them against the broader indicator stack to filter out the low-probability setups that single-indicator traders get trapped by.
You can see which signals are currently in squeeze or expansion phases across the full watchlist on our signals dashboard.
Key Takeaways
- Add Bollinger Bands on TradingView in under 60 seconds via the Indicators search bar — type "Bollinger Bands" and select the built-in version
- Default settings (20 period, 2.0 StdDev) work well for most swing traders on daily charts — adjust length and multiplier for your timeframe and asset class
- The Bollinger Squeeze Breakout is the strongest setup in backtesting — 14,266 signals, profit factor of 1.03, with crypto showing the best edge at 51.8%
- Upper band touches alone are not reliable sell signals — wait for a confirmed close back inside the band before acting
- Combine Bollinger Bands with RSI, volume, and Stochastic for multi-confirmation setups — single-indicator signals have weak statistical edges
- Save your preferred configuration as a TradingView template to apply it consistently across charts
- The Stocks365 Trust Score incorporates Bollinger Band signals into its volatility and agreement scoring — giving each setup a reliability rating beyond raw indicator readings