
Best RSI Settings for Stocks: How to Optimize Your Indicator for Maximum Accuracy
The Relative Strength Index is one of the most widely used technical indicators in stock trading — but most traders use it with the default settings and wonder why it keeps giving false signals. The truth is, the best RSI settings for stocks depend heavily on your trading style, timeframe, and the specific stock you're analyzing. Getting this right can be the difference between a reliable signal and a costly mistake.
In this guide, we'll break down exactly how to optimize your RSI settings for any market condition, covering period lengths, overbought/oversold thresholds, and timeframe combinations that professional traders use in 2026. If you're new to the indicator, start with our complete beginner's guide to RSI before diving in here.
Why Default RSI Settings Often Underperform
Most charting platforms ship RSI with a default period of 14 and overbought/oversold levels set at 70/30. J. Welles Wilder originally designed these settings in 1978 for daily commodity charts. The stock market of 2026 — with its algorithmic trading, high-frequency execution, and 24-hour news cycles — moves very differently from the markets Wilder was analyzing.
Using a one-size-fits-all RSI configuration means you're applying a tool calibrated for a different environment. A growth stock like NVIDIA reacts completely differently to momentum than a defensive utility stock. The RSI needs to reflect that. To understand why different settings produce different outputs, it helps to understand how RSI is calculated step by step.
Key Insight: There is no universally "best" RSI setting. The optimal configuration is the one that aligns with your specific trading strategy, the stock's volatility profile, and the timeframe you trade on.
Understanding the RSI Period Setting
The RSI period controls how many bars (candles) are used in the calculation. A shorter period makes RSI more sensitive — it reacts faster to price changes and generates more signals. A longer period smooths out the noise and produces fewer, but potentially more reliable, signals.
Short Period RSI (2–7): For Aggressive Traders
An RSI set to a period of 2 to 7 is extremely sensitive. It will regularly swing from near 0 to near 100, even within a short intraday session. This makes it popular among short-term traders and scalpers who need rapid signal generation.
- Best for: Day trading, scalping, mean-reversion strategies
- Common thresholds: Overbought at 90, oversold at 10
- Popular choice: RSI(2) used with standard thresholds of 95/5
- Risk: High false signal rate; requires strong confirmation from price action
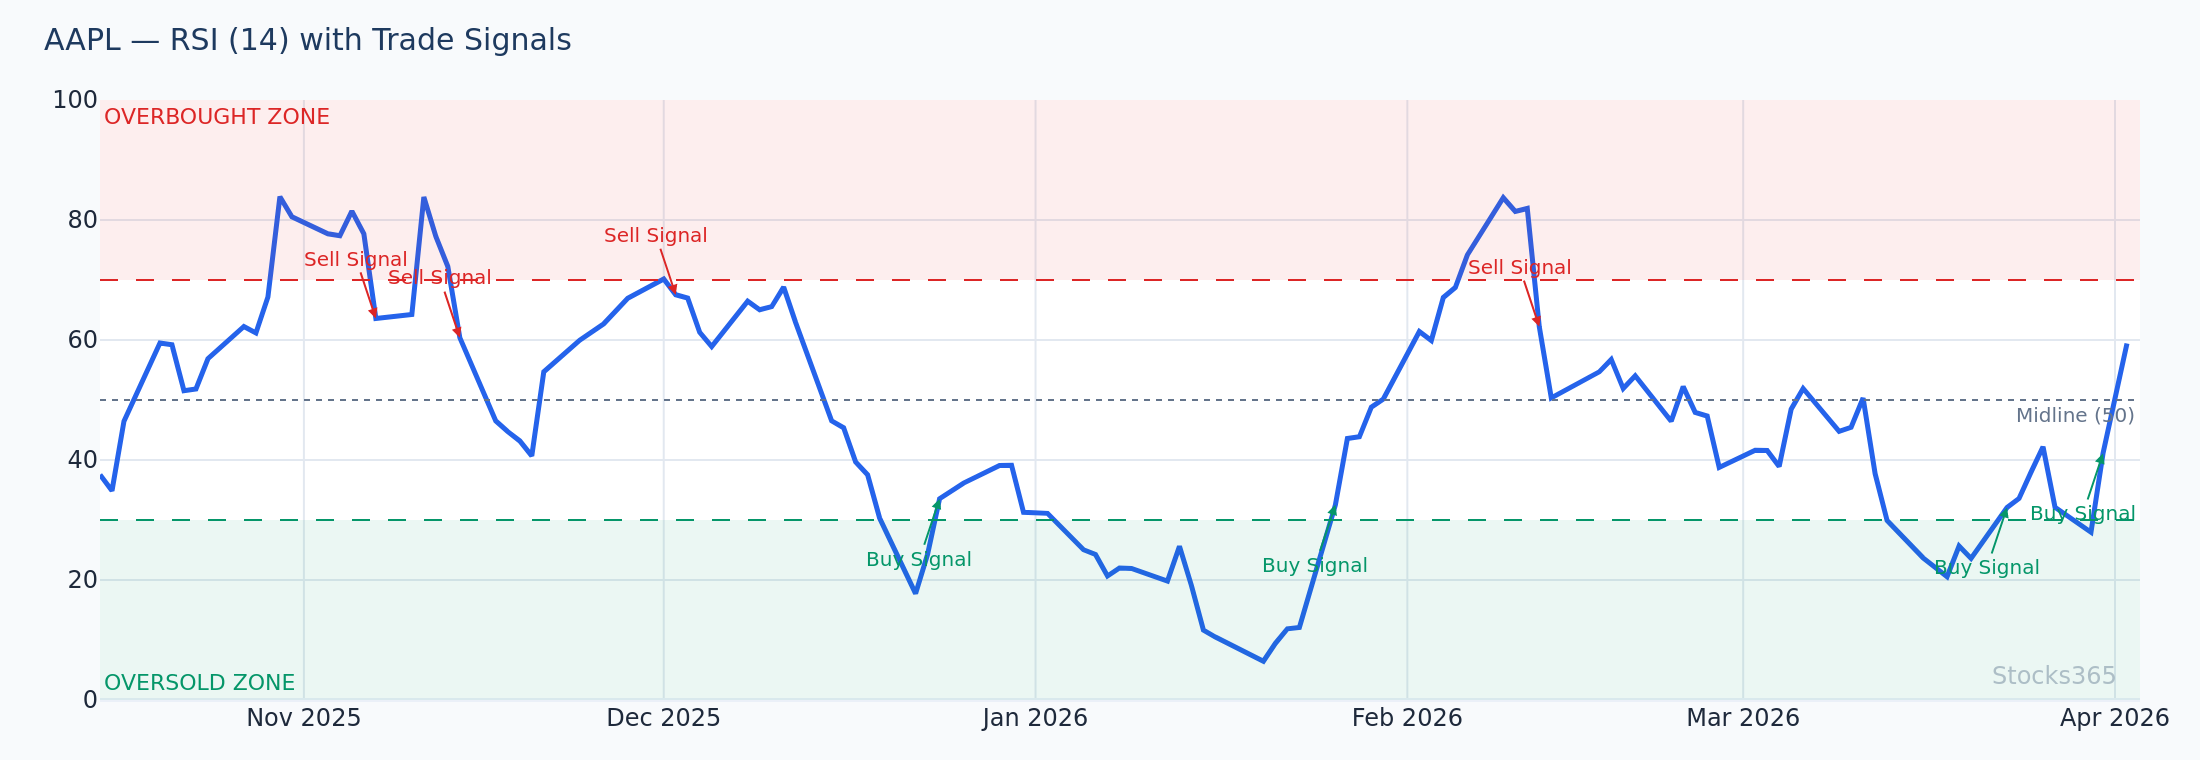
Example: A day trader watching AAPL on a 5-minute chart with RSI(4) might enter a long position when RSI drops below 10 and price is holding above a key intraday support of $210.50, targeting a quick bounce to $212.00.
Standard Period RSI (9–14): The Balanced Approach
The 9 to 14 period range is the most widely used by retail and institutional traders alike. RSI(14) is the classic default — it balances responsiveness with reliability well enough for swing trading on daily charts.
- Best for: Swing trading, position trading, daily and 4-hour charts
- Common thresholds: Standard 70/30 or slightly adjusted 65/35
- RSI(9): More responsive than 14, useful for shorter swing trades (2–5 days)
- RSI(14): Industry standard; better suited for weekly trend confirmation
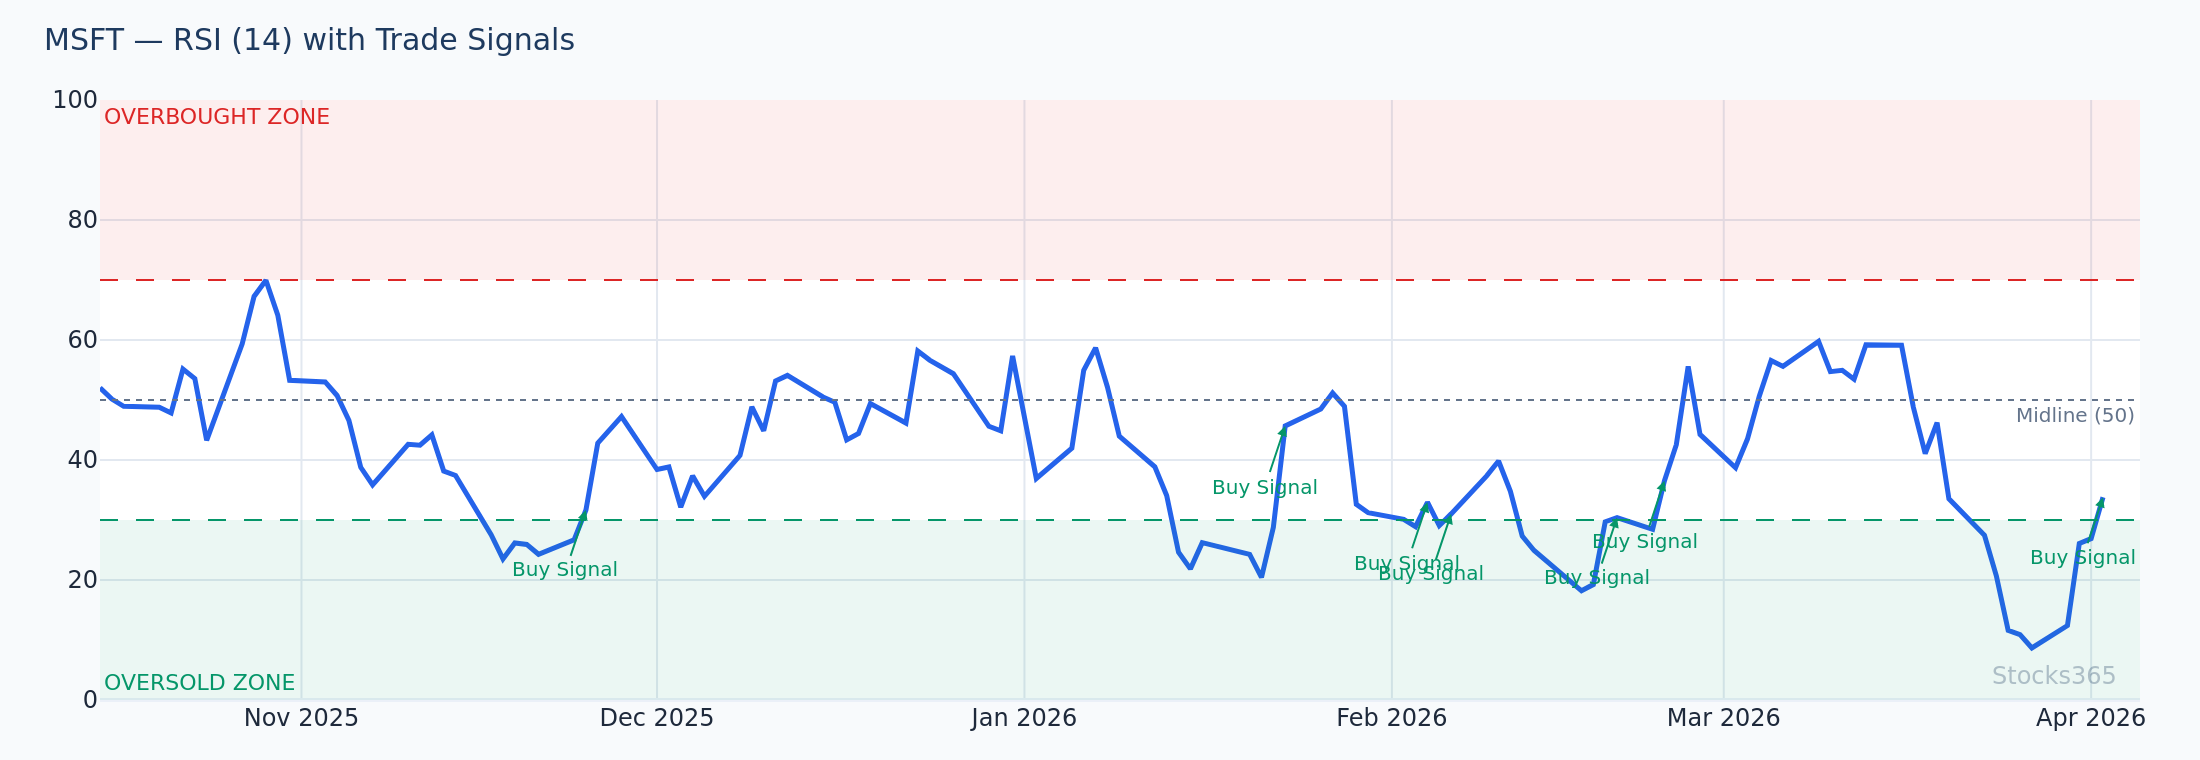
Example: A swing trader analyzing MSFT on a daily chart with RSI(14) notices RSI approaching 68 as price tests resistance at $415.00. Rather than buying the breakout, they wait for RSI to pull back below 60 before entering — avoiding a common false breakout trap.
Long Period RSI (20–50): For Position Traders and Investors
Longer RSI settings are used by traders who want to filter out short-term noise and focus only on major momentum shifts. RSI(21) and RSI(25) are commonly used on weekly charts by position traders.
- Best for: Position trading, long-term investing, weekly charts
- Common thresholds: 60/40 or even 65/45 for trending markets
- Signal frequency: Very low — may only trigger a handful of times per year
- Advantage: Extremely low false signal rate in trending environments
For a more structured breakdown of how period length affects signal quality across timeframes, see our detailed article on RSI settings and mastering the best period for your strategy.
Best RSI Settings by Trading Style
RSI Settings for Day Trading Stocks
Day traders need RSI to be fast. On intraday timeframes (1-minute to 15-minute charts), the default RSI(14) is too slow — it lags too far behind price and often gives signals after the move has already happened.
Recommended settings for day trading:
- RSI Period: 5 or 7
- Overbought Level: 80
- Oversold Level: 20
- Timeframe: 5-minute or 15-minute charts
- Confirmation: VWAP, volume surge, or price action at key levels
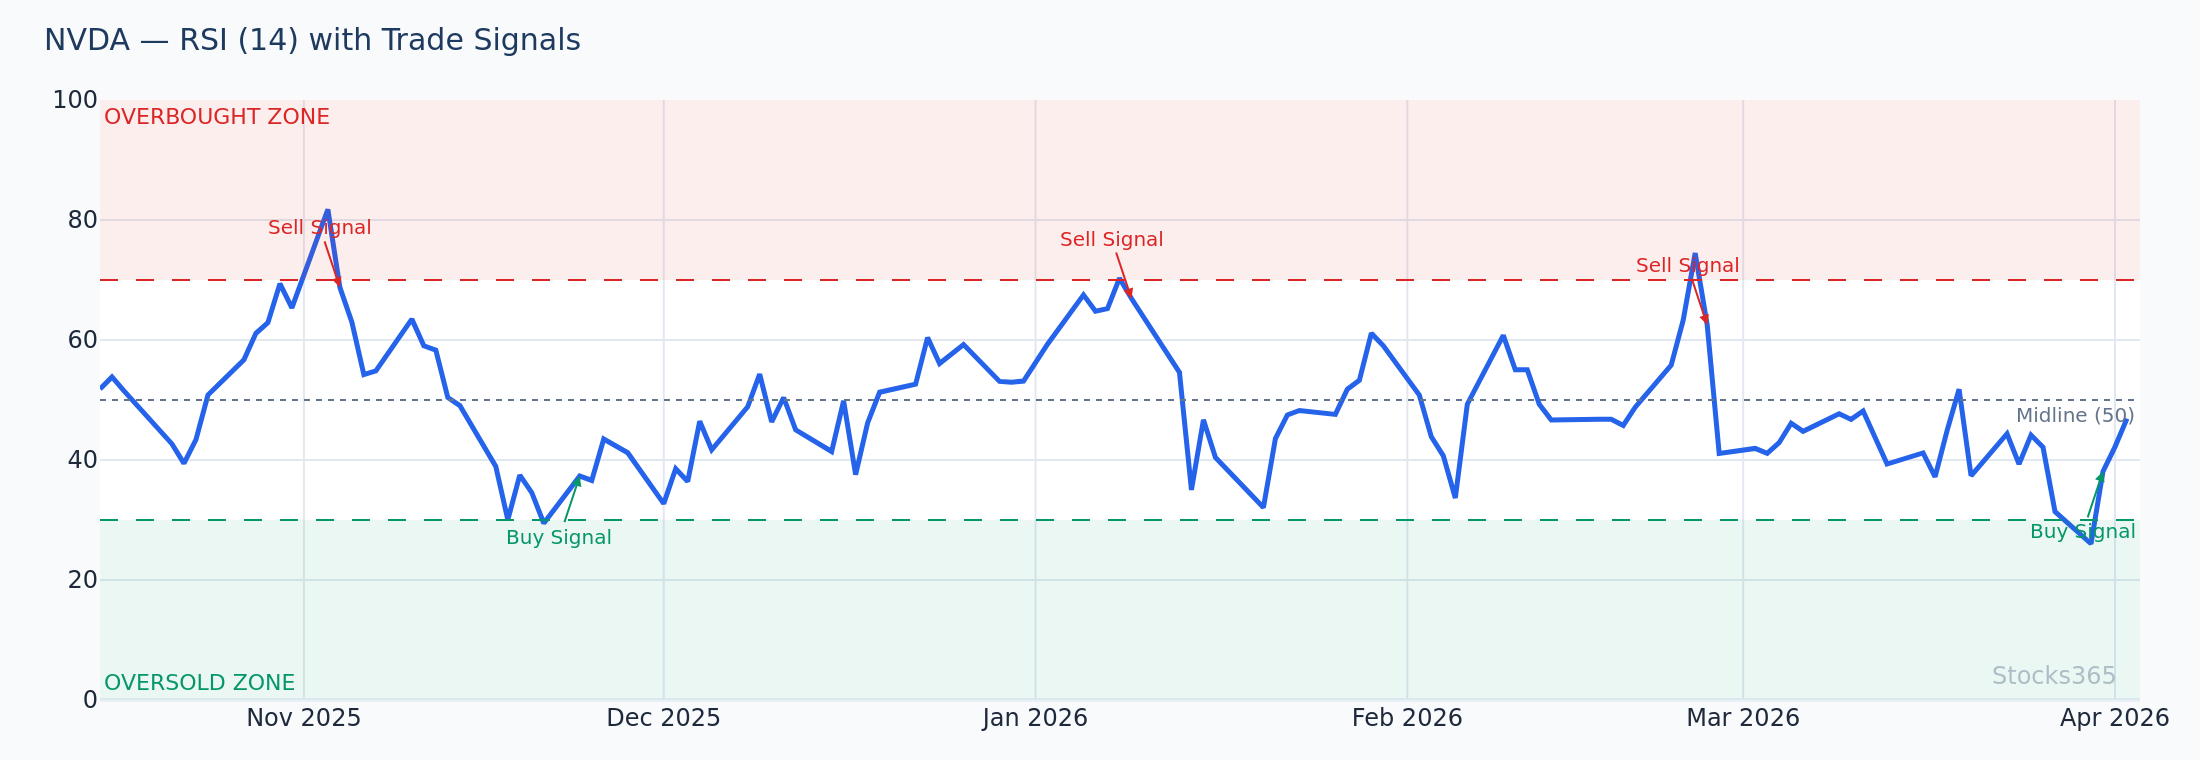
Practical example: On a 15-minute NVDA chart with RSI(7), price drops sharply from $875 to $858 on an opening gap. RSI hits 18 (oversold). A day trader waits for a bullish engulfing candle at $858 support before entering long, targeting a quick recovery to $866 for a clean risk-reward trade.
RSI Settings for Swing Trading Stocks
Swing traders hold positions from a few days to a few weeks, making the daily chart their primary battlefield. RSI(14) with standard 70/30 levels works reasonably well, but many experienced swing traders prefer a slightly shorter period to catch momentum earlier.
Recommended settings for swing trading:
- RSI Period: 9 or 10
- Overbought Level: 70
- Oversold Level: 30
- Timeframe: Daily chart (4-hour for entry timing)
- Confirmation: RSI divergence, moving average support, volume
Combining RSI signals with RSI divergence analysis is especially powerful for swing traders. When RSI(9) shows a bullish divergence while price tests a key support zone, the confluence dramatically increases signal reliability.
RSI Settings for Long-Term Investing
For investors using RSI to time entries and exits on weekly or monthly charts, sensitivity is the enemy. You want RSI to only respond to major, sustained momentum changes.
Recommended settings for long-term investing:
- RSI Period: 14 to 21 on weekly charts
- Overbought Level: 75 or 80
- Oversold Level: 30 or 25
- Timeframe: Weekly chart
- Use case: Identifying major buying opportunities during corrections in uptrending stocks
Adjusting RSI Overbought and Oversold Levels
Most traders never question the default 70/30 thresholds, but adjusting these levels is often more impactful than changing the period. In strongly trending markets, RSI rarely reaches oversold territory — using 30 as your entry trigger means you'll miss most of the best opportunities.
Adjusting Thresholds for Trending Stocks
When a stock is in a strong uptrend, RSI tends to oscillate between 40 and 80 rather than the full 0–100 range. In this environment:
- Treat RSI pullbacks to 40–50 as buy signals (not 30)
- Treat RSI reaching 80+ as a potential overbought signal (not 70)
- Avoid shorting a strong uptrend simply because RSI hits 70
For a comprehensive breakdown of how to interpret these threshold signals in different market conditions, our guide to RSI overbought and oversold levels covers every scenario in detail.
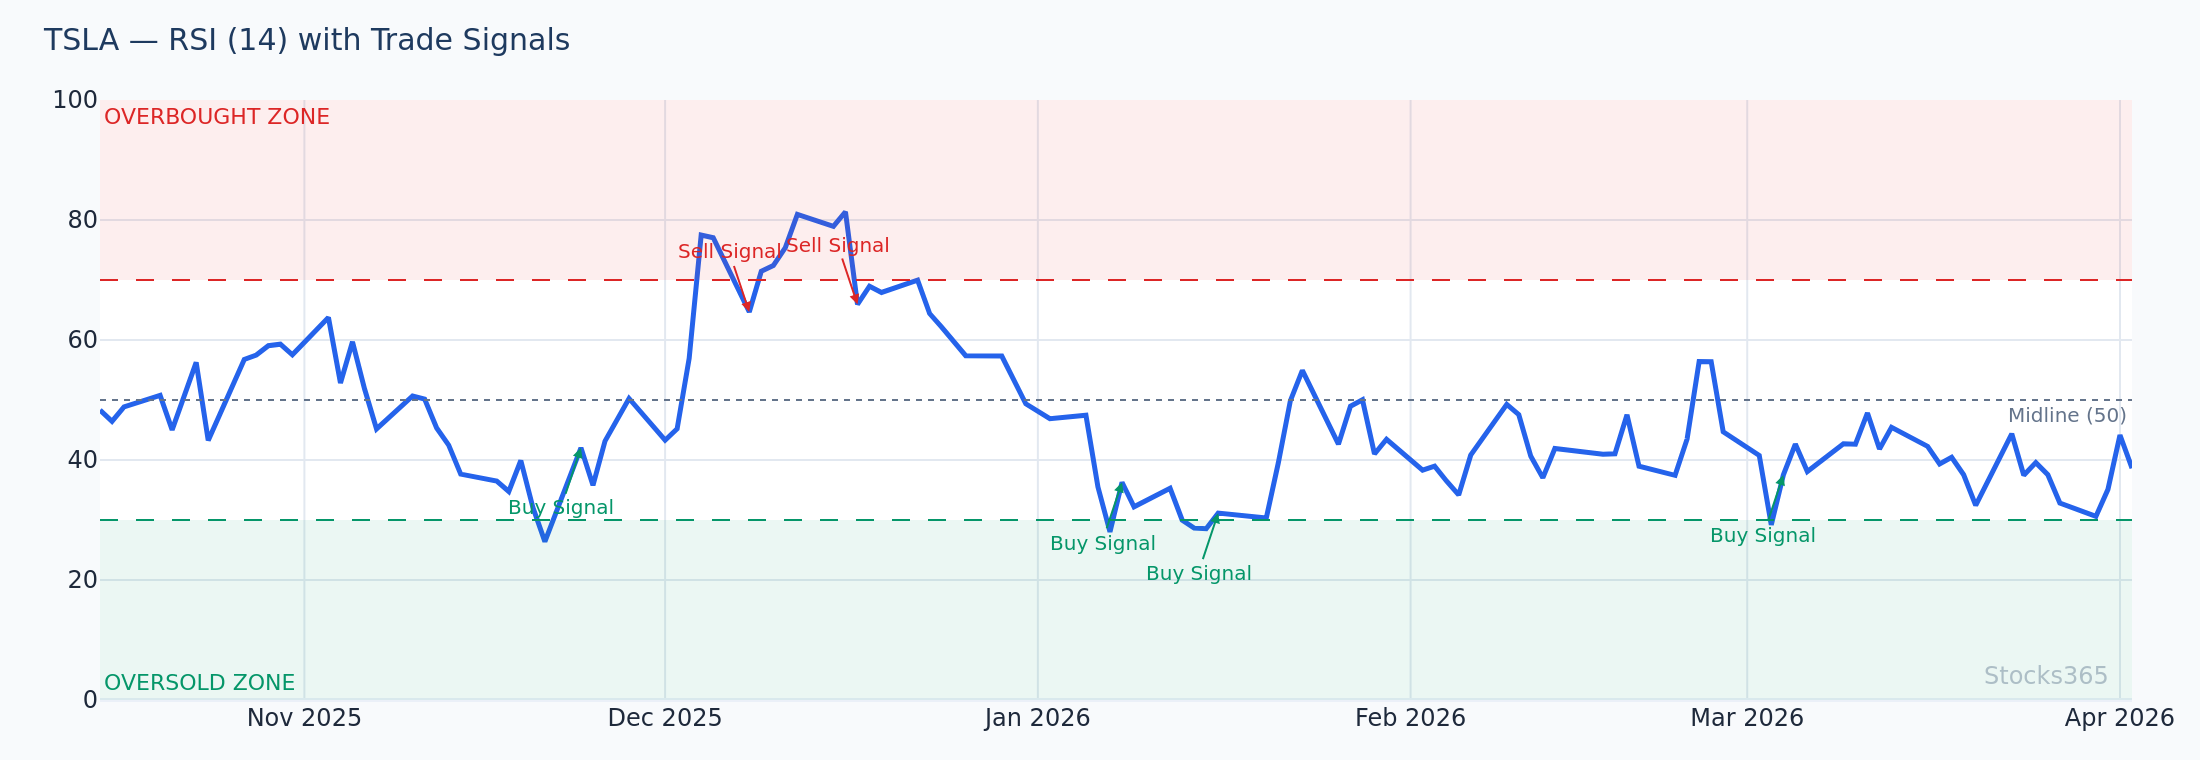
Adjusting Thresholds for Volatile Stocks
High-beta stocks like TSLA can spend extended periods above 70 or below 30 without reversing. For volatile names, widening the thresholds reduces whipsaw losses:
- Overbought: 80 instead of 70
- Oversold: 20 instead of 30
Multi-Timeframe RSI Strategy: The Professional Approach
One of the most powerful techniques professional traders use is analyzing RSI across multiple timeframes simultaneously. The concept is simple: use a higher timeframe to establish the trend bias, then use a lower timeframe to time your entry.
Example multi-timeframe RSI setup:
- Weekly chart RSI(14): Confirms the macro trend (above 50 = bullish bias)
- Daily chart RSI(14): Identifies the trading opportunity (RSI pulling back toward 40)
- 4-hour chart RSI(9): Triggers the entry (RSI crossing back above 40 from below)
Real-world scenario: AMZN shows RSI(14) at 58 on the weekly chart (bullish bias). On the daily chart, a 10% correction has pushed RSI(14) down to 42. On the 4-hour chart, RSI(9) dips to 35 then crosses back above 40 as price bounces from the $185 support zone. This three-timeframe alignment creates a high-probability long entry with a clearly defined stop below $183.
For a complete walkthrough of how to build and execute trades using RSI setups like this, see our ultimate step-by-step guide to using RSI in trading.
RSI Settings vs Other Indicators: When to Combine
RSI doesn't operate in isolation. Pairing it with complementary indicators can significantly improve the accuracy of your signals and reduce false positives.
RSI + Moving Averages
Using RSI alongside a 20-period or 50-period moving average helps confirm trend direction. Only take RSI buy signals when price is above the moving average; only take sell signals when price is below it. This simple filter can dramatically cut your false signal rate.
RSI + Stochastic Oscillator
Both RSI and the Stochastic are momentum oscillators, but they work differently enough to complement each other. When both signal oversold simultaneously, the confluence creates a much stronger entry signal. Our detailed comparison of RSI vs the Stochastic Oscillator explains exactly how to use them together without double-counting the same information.
RSI + Divergence Analysis
Perhaps the most powerful RSI combination is pairing your optimized settings with divergence analysis. When RSI(9) or RSI(14) shows a hidden bullish divergence on a pullback in an uptrend, it can signal a high-probability continuation setup. This advanced technique is covered in our guide to hidden RSI divergence signals.
Using Stocks365 to Apply Optimized RSI Settings
Understanding RSI settings is only half the equation — applying them consistently across dozens of stocks in real time is the other half. The Stocks365 signals dashboard integrates RSI analysis across multiple timeframes and stocks, incorporating it into a broader trust score system that weighs RSI signals alongside volume, trend strength, and institutional activity.
For example, on the AAPL signal page, you can see RSI readings across timeframes at a glance, combined with the Stocks365 trust score that tells you how many independent indicators are confirming the same directional bias. Rather than manually checking RSI settings on each chart, the platform surfaces the most actionable setups — so you spend less time configuring and more time trading.
This kind of signal aggregation is particularly valuable when you're implementing a multi-timeframe RSI strategy, since manually tracking three RSI readings across hundreds of stocks isn't practical without the right tools.
Common RSI Setting Mistakes to Avoid
- Using the same settings for every stock: A volatile small-cap and a blue-chip dividend stock behave completely differently — their RSI settings should reflect that.
- Treating every RSI extreme as a reversal signal: In strong trends, RSI staying overbought for weeks is normal, not a sell signal.
- Ignoring timeframe context: RSI oversold on a 5-minute chart means almost nothing if the daily chart is in a strong downtrend.
- Over-optimizing historical data: Backtesting RSI settings obsessively on past data often leads to curve-fitting — settings that worked perfectly in hindsight but fail in live markets.
- Neglecting volume confirmation: An RSI reversal signal without supporting volume is far more likely to fail.
📋 Key Takeaways
- The best RSI settings for stocks depend on your trading style, timeframe, and the stock's volatility — there is no universal answer.
- Use shorter periods (5–7) for day trading on intraday charts and longer periods (14–21) for swing and position trading on daily/weekly charts.
- Adjust overbought/oversold thresholds to match market conditions — trending stocks often need wider thresholds (80/20) to filter out noise.
- A multi-timeframe RSI strategy — using a higher timeframe to set bias and a lower timeframe to trigger entry — is one of the most reliable professional approaches.
- Always combine RSI with price action, volume, or complementary indicators like moving averages or the Stochastic Oscillator for confirmation.
- The Stocks365 platform integrates RSI signals with its trust score system to surface high-probability setups across multiple stocks automatically.
Frequently Asked Questions
What is the best RSI period setting for stocks?
For most stock traders, RSI(14) on a daily chart is a strong starting point. Day traders typically prefer shorter periods like RSI(5) or RSI(7) on intraday charts for faster signals, while long-term investors may use RSI(21) on weekly charts. The best setting depends on your specific trading style and the stock's volatility.
Should I change the RSI overbought and oversold levels?
Yes, adjusting the default 70/30 levels is often necessary. For strongly trending stocks, consider using 80/40 in an uptrend or 60/20 in a downtrend. For highly volatile stocks, widening to 80/20 helps reduce false signals. The standard 70/30 works best in range-bound or moderately volatile markets.
What RSI settings work best for day trading stocks?
Day traders typically use RSI with a period of 5–7 on 5-minute or 15-minute charts, with overbought/oversold levels set at 80/20. This faster configuration generates more signals within a trading session but requires strong confirmation from price action, volume, or VWAP to reduce false entries.
Can I use RSI alone to trade stocks?
While RSI can generate standalone signals, relying on it alone significantly increases your false signal rate. The most effective RSI strategies combine the indicator with trend context (moving averages), volume analysis, price action confirmation, and ideally RSI divergence analysis. Think of RSI as one powerful piece of a broader analytical framework.
How do I know if my RSI settings are optimized for a specific stock?
A well-optimized RSI setting will generate meaningful signals at logical turning points in a stock's price history — without excessive noise or lag. You can evaluate this visually by overlaying RSI on a chart and checking whether the overbought/oversold signals historically aligned with actual price reversals or continuation patterns. Be cautious of over-optimizing to past data; always test settings on out-of-sample periods before trading live.