
Bitcoin Moving Average Analysis: What the Historical Data Actually Shows
Most traders slap a 50-day moving average on a Bitcoin chart and call it analysis. That's not analysis. That's decoration.
Real Bitcoin moving average analysis means understanding which MA setups have produced edge across market cycles, when they fail, and why the mechanics behind the signals matter more than the signals themselves. This case study digs into the historical behavior of Bitcoin across its defining market phases — and what the patterns consistently reveal about where price tends to go next.
Stocks365 backtested 3,332 Price Crosses Below SMA 20 signals across multiple asset classes and found a 50.9% win rate over a 10-day holding period — with crypto leading all asset classes at 66.8%. That single stat changes how you think about short-term MA crossovers on Bitcoin. Here's the full breakdown.
Why Moving Averages Work Differently on Bitcoin
Bitcoin is not a stock. It doesn't have earnings, dividends, or analyst coverage. It trades 24/7, attracts retail momentum traders, algorithmic bots, and institutional positioning all at once. That cocktail creates a price environment where moving averages behave with unusual consistency — especially around key trend boundaries.
Here's the core reason: Bitcoin trends. Hard. When it breaks above a major moving average with volume, it tends to stay above that average for extended periods. When it loses that average, the breakdown accelerates. This trending behavior is what makes moving average analysis particularly powerful for BTC compared to, say, a sideways-grinding forex pair.
Compare that to our MACD analysis in forex trading, where mean-reversion dynamics dominate and trend-following signals generate far more false starts. Bitcoin's momentum characteristics are fundamentally different — and your MA strategy needs to reflect that.
The Key Moving Averages Bitcoin Traders Use
The 20-Period SMA: Short-Term Trend Engine
The 20-period Simple Moving Average is the market's short-term heartbeat for Bitcoin. On daily charts, price spending consecutive sessions above the 20-SMA signals healthy trend momentum. Below it, and short-term sellers are in control.
What makes the 20-SMA especially interesting for Bitcoin is how it acts as a dynamic support and resistance zone during trending phases. In a strong uptrend, Bitcoin repeatedly bounces from the 20-SMA before continuing higher. In a downtrend, every attempted recovery gets rejected at the same level.
This chart illustrates a clean SMA 20 crossover setup. Notice how price consolidates just below the average before breaking through with a volume surge — that confirmation candle is the entry trigger. When the crossover happens without volume expansion, treat it with skepticism. A failed breakout above the 20-SMA that reverses within two sessions typically signals the trend remains bearish.
The 50-Period SMA: The Battleground Level
If the 20-SMA is short-term momentum, the 50-SMA is where bulls and bears fight for medium-term control. Bitcoin's history is filled with defining moments at the 50-SMA — accumulation phases that resolve into explosive moves once price firmly reclaims it, and distribution phases where the 50-SMA acts as a ceiling that caps every rally.
The pattern to study: when Bitcoin closes above the 50-SMA on the daily after being below it for 30+ days, the subsequent 4-6 weeks often produce outsized moves. The opposite is equally powerful — a clean break below the 50-SMA after a prolonged uptrend frequently marks the beginning of a multi-week correction, not a single-day dip to buy.
The 200-Period SMA: The Long-Term Verdict
The 200-SMA is Bitcoin's macro trend filter. Full stop.
Historically, Bitcoin trading above the 200-SMA has been the defining characteristic of bull market phases. Below it, bear market dynamics dominate. This isn't just a nice narrative — it has mechanically repeated across every major cycle. Position sizing, risk tolerance, and strategy selection should all shift based on where Bitcoin sits relative to its 200-SMA on the weekly chart.
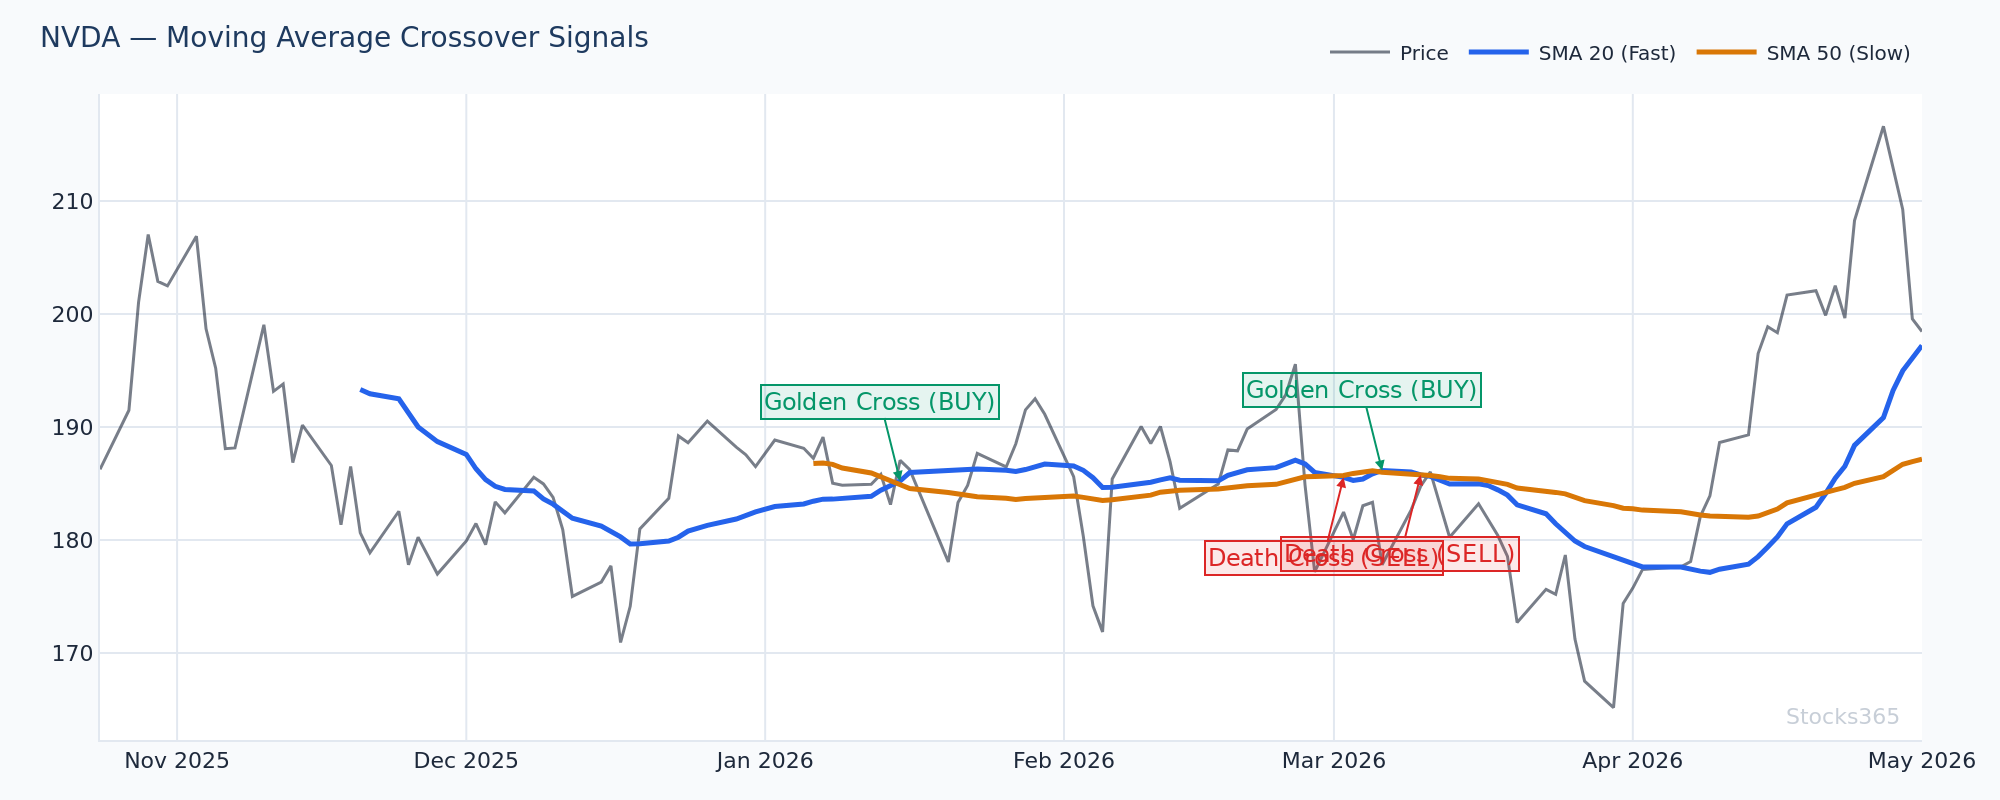
Historical Case Study: The Golden Cross and Death Cross Patterns
The Golden Cross Setup
A Golden Cross occurs when the 50-SMA crosses above the 200-SMA. On Bitcoin, this pattern has historically marked the transition from a recovering market to a confirmed bull trend. The critical nuance most traders miss: the actual crossover date is rarely the best entry point. By the time the 50-SMA crosses above the 200-SMA, price has often already moved significantly.
The smarter play documented in historical Bitcoin data: enter when price first reclaims the 200-SMA with a strong close, before the Golden Cross confirms. Use the Golden Cross itself as trend confirmation that validates your earlier position — not as an entry trigger.
This candlestick setup shows the typical price behavior leading into a Golden Cross formation. Notice the initial 200-SMA reclaim — that's the early signal. The subsequent consolidation just above the 200-SMA before the actual cross is where patient traders build positions. If price pulls back below the 200-SMA after the Golden Cross fires, that's your invalidation — it signals a false cross, not a buying opportunity.
The Death Cross Setup
The Death Cross — 50-SMA crossing below the 200-SMA — has historically preceded the most damaging periods of Bitcoin drawdown. Again, the entry timing misconception is costly: shorting the literal Death Cross candle often means entering after significant downside has already occurred.
What historical data shows consistently: the period immediately after a Death Cross often includes a brief relief rally — sometimes called a "dead cat bounce" — where price temporarily recovers toward the 200-SMA from below. That recovery attempt, which fails to close back above the 200-SMA, is historically one of the highest-probability short setups in Bitcoin's pattern history.
Here's What Most Traders Get Wrong About Bitcoin Moving Average Signals
Most traders treat a moving average crossover as a buy or sell signal the instant it happens. In Bitcoin, this causes chronic late entries and premature exits. The crossover is a condition, not a command.
The edge isn't in the crossover itself — it's in what price does after the crossover while the moving average acts as a reference point. A Bitcoin candle that closes back above the 20-SMA after three rejections below it, with volume expanding 1.5x the 20-day average, is a meaningfully different signal than a thin-volume drift above the same level. Same crossover. Completely different probability. Watch the confirmation, not the cross.
Combining Moving Averages With Momentum Indicators
Moving averages tell you direction. They don't tell you strength. That's where momentum confirmation becomes critical.
Bitcoin moving average analysis reaches its highest reliability when paired with RSI as a momentum filter. Specifically: a price reclaim of the 50-SMA while RSI simultaneously crosses back above 50 from below is a dual-confirmation setup that historically carries significantly higher follow-through than either signal alone.
If you're new to RSI mechanics, start with our complete RSI beginner's guide before adding it to your moving average framework. Understanding how RSI is calculated also helps you understand why the 50-level acts as a meaningful momentum pivot rather than an arbitrary number.
RSI divergence adds another layer. When Bitcoin price makes a new low but RSI forms a higher low — classic bullish divergence — and this happens while price is testing a major moving average from below, the historical confluence is notable. For a deep dive on reading these signals, our RSI divergence guide covers the setup mechanics in full.
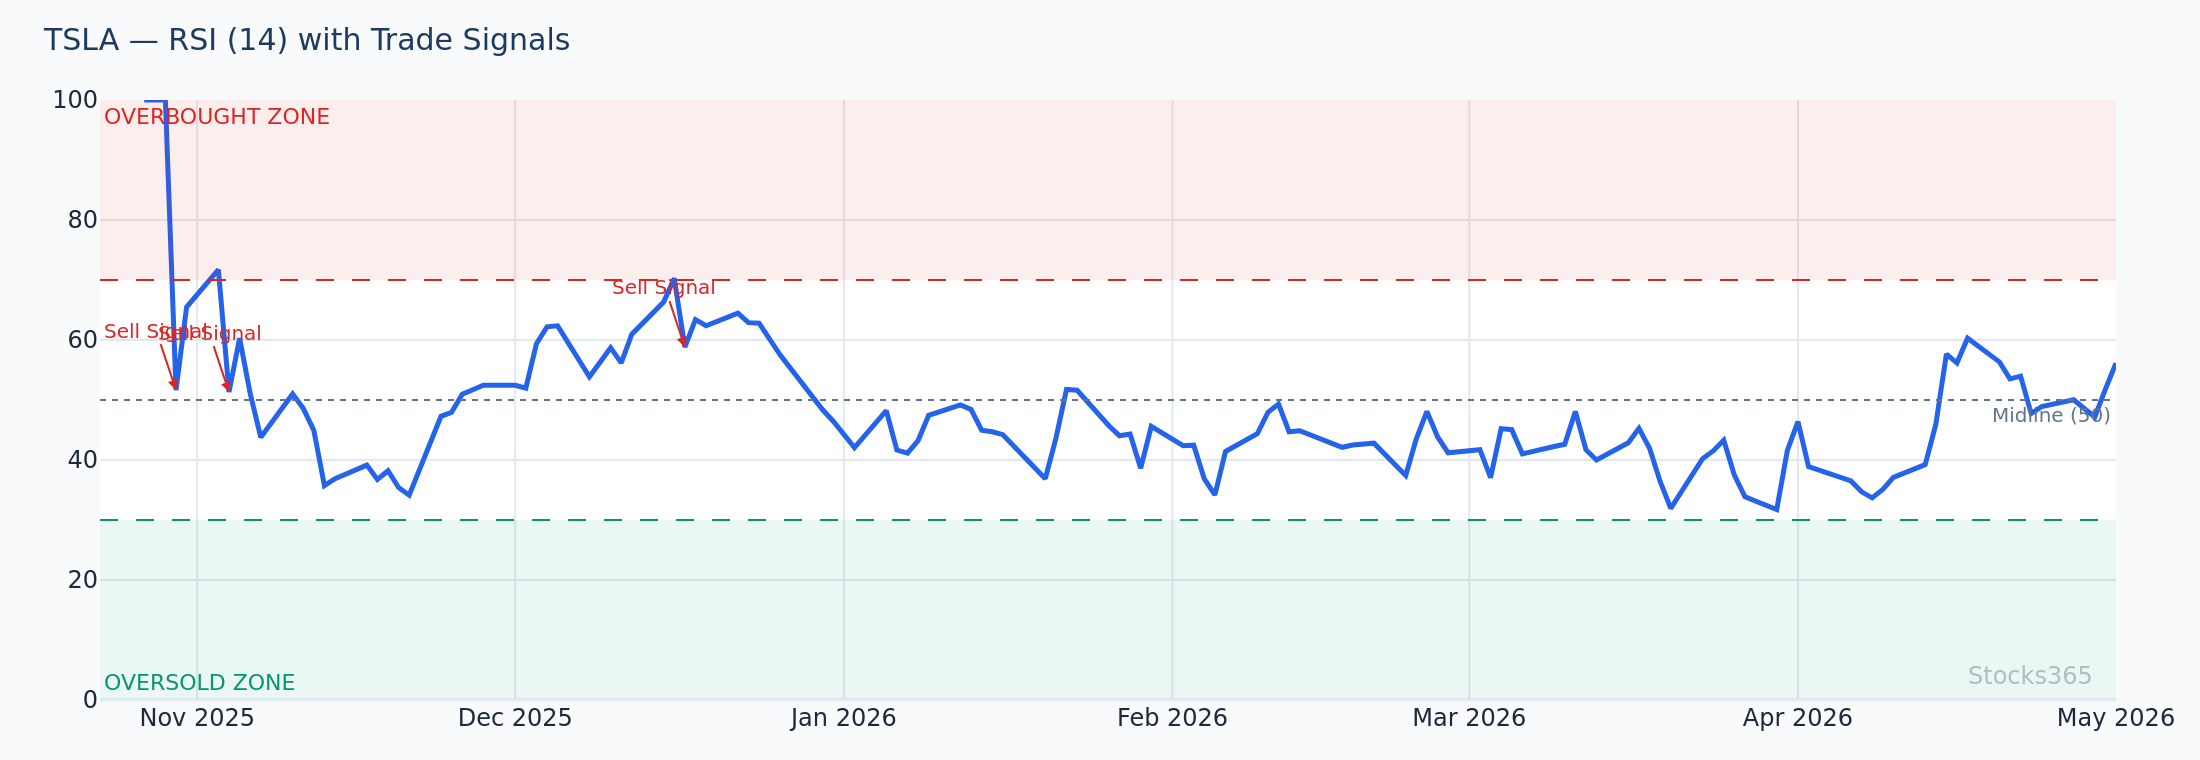
This RSI overlay demonstrates the momentum confirmation pattern at a moving average test. When price touches the SMA from above and RSI simultaneously holds above 40 without breaking into oversold territory, the trend often resumes upward. An RSI break below 30 while price is below a declining 20-SMA is a very different signal — momentum and trend are both bearish, and the setup warrants a different response entirely. Watch for RSI reclaiming 50 as the first sign that momentum is shifting back in favor of buyers.
The SMA 20 Cross: What Backtested Data Reveals for Crypto
Here's where the historical data gets specific — and where many traders are surprised by the direction of the edge.
Our analysis of 3,332 Price Crosses Below SMA 20 signals shows a 66.8% win rate for crypto specifically over a 10-day holding period — the strongest result across all asset classes in our dataset. Compare that to the same signal in forex, where the win rate drops to 42.5%. The asset class matters enormously. A strategy that works on Bitcoin may fail completely when applied mechanically to EUR/USD.
What explains the crypto outperformance on downside crosses? Bitcoin's trending behavior. When Bitcoin breaks below the 20-SMA with conviction, it tends to stay below it — sellers pile in, leveraged longs get liquidated, and the path of least resistance remains down for the following 10 days more often than not. You can explore more cross-asset signal performance in our research dashboard.
The flip side is equally important: Price Crosses Above SMA 20 in crypto showed only a 36.9% win rate — the worst of all asset classes tested across 3,289 signals. Buying breakouts above the 20-SMA in crypto has historically been a losing strategy on a 10-day basis. The takeaway is counterintuitive but clear: in Bitcoin, the downside SMA 20 signal carries the edge, not the upside one.
Multi-Timeframe Moving Average Analysis on Bitcoin
The Weekly Chart Anchors Everything
Daily chart signals are noise when the weekly chart trend is decisively against you. Bitcoin weekly MA analysis provides the macro context that makes daily signals meaningful or meaningless.
The framework: use the weekly 20-SMA and 50-SMA to determine macro regime. If both are pointing upward and price is above both, daily dips toward the 20-SMA are buying opportunities. If both are declining and price is below both, daily bounces toward the 50-SMA are distribution opportunities. Align your daily signals with your weekly context. This alone eliminates a significant percentage of false signals.
The 4-Hour Chart for Entry Precision
Once you've identified a setup on the daily chart — say, price retesting the 50-SMA from above in a bull market — drop to the 4-hour chart for entry precision. A 4-hour candle that closes above the 4-hour 20-SMA after a brief dip below it confirms the daily setup is still intact. This multi-timeframe confluence approach reduces the number of trades taken but dramatically improves the quality of each entry.
This chart demonstrates the multi-timeframe alignment setup. The daily chart shows price respecting the 50-SMA as support, while the 4-hour chart shows a clean reclaim of the shorter-term average on rising volume. Both timeframes agree — that agreement is the confirmation. When daily and 4-hour moving averages are pointing in opposite directions, step aside and wait for clarity before committing capital.
When Bitcoin Moving Average Analysis Fails
Moving averages are trend-following tools. They fail in range-bound, choppy markets — and Bitcoin goes through extended consolidation phases where no moving average strategy produces meaningful edge.
The warning signs of a choppy regime: the 20-SMA and 50-SMA are flat and intertwined, price repeatedly crosses both averages in both directions within short periods, and candle bodies are small relative to wicks. In this environment, moving average crossovers generate whipsaws more than edge. Switching to a mean-reversion approach, or simply reducing position size and frequency, is the rational response.
Check overbought and oversold signals as a secondary filter. Our guide on RSI overbought and oversold levels explains how momentum extremes help identify when a moving average breakdown is genuine versus a brief market liquidity flush. Pairing MA signals with RSI trendline analysis — covered in depth in our RSI trendline strategy guide — adds another quality filter to eliminate low-probability setups.
Practical Bitcoin Moving Average Trading Framework
Step 1: Establish the Macro Regime
- Check Bitcoin's weekly chart: price above or below the 200-SMA?
- Are the 50-SMA and 20-SMA sloping up or down on the weekly?
- Bull regime: favor long setups, use dips to MAs as entries
- Bear regime: favor short setups, use rallies to MAs as distribution zones
Step 2: Identify the Setup on the Daily Chart
- Look for price testing a key moving average (20, 50, or 200-SMA) with volume declining into the test
- Confirm the test aligns with the macro regime from Step 1
- Check RSI for momentum confirmation — our RSI trading guide walks through this in detail
Step 3: Execute on the Lower Timeframe
- Drop to 4-hour chart and wait for confirmation candle that respects the level
- Enter after the confirmation closes, not before
- Define your invalidation level: the setup fails if price closes below the tested MA with volume expansion
New to applying RSI rules alongside this framework? Our 5 simple RSI rules for beginners provides a clean starting structure that pairs directly with moving average setups.
What to Watch For
- Price crosses below the 20-SMA on Bitcoin with volume expanding 1.5x or more above the 20-day average: this setup has historically preceded continued downside over the following 10 days — crypto showed the strongest follow-through of all asset classes in backtested data.
- Bitcoin reclaims the 50-SMA on the daily chart after 30+ days below it, while RSI simultaneously crosses above 50: this dual-confirmation pattern marks the beginning of extended recovery phases more reliably than the SMA reclaim alone.
- A Death Cross followed by a rally back toward the 200-SMA from below that fails to close above it: historically, this failed retest setup has marked high-probability continuation of the downtrend — watch the close, not the intraday tag.
- Weekly 20-SMA and 50-SMA both flattening and converging while daily price repeatedly crosses both in tight range: this pattern signals a low-edge choppy regime — reduce position size or pause moving average-based strategies entirely until the averages separate and slope clearly.
- RSI bullish divergence forming while Bitcoin tests the 200-SMA from above: when price makes a lower low at the 200-SMA but RSI forms a higher low, the probability of a meaningful bounce increases significantly — this confluence has preceded several of Bitcoin's largest single-week recovery moves historically.
How Stocks365 Uses This
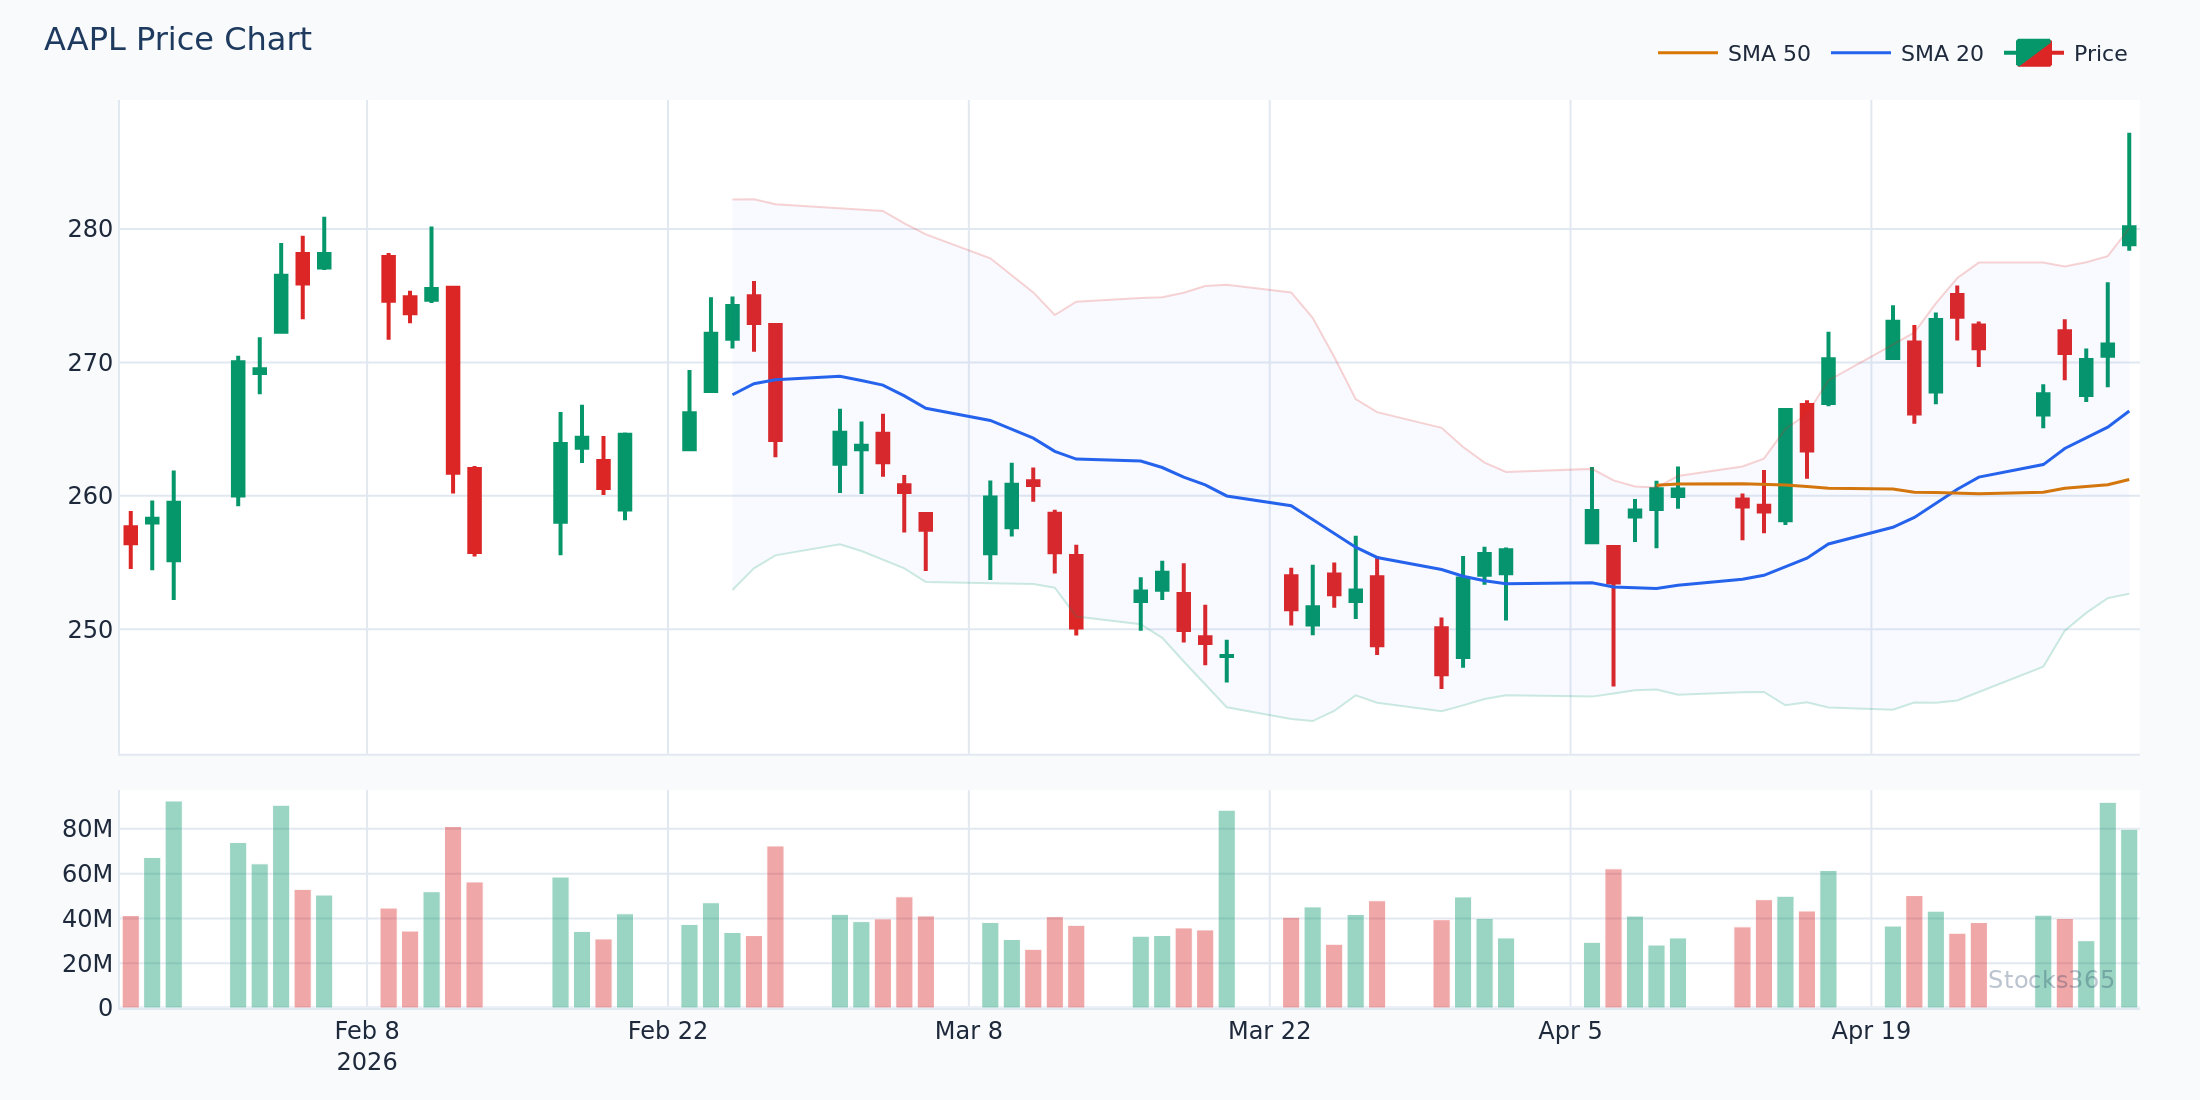
Stocks365 integrates moving average analysis as one of 12+ indicators within its Trust Score system. SMA positioning — specifically whether price is above or below the 20, 50, and 200-period SMAs across multiple timeframes — contributes directly to the trend regime scoring layer of the Trust Score. When Bitcoin's multi-timeframe MA structure aligns (all three averages sloping in the same direction with price on the correct side), the Trust Score reflects elevated trend agreement. When moving averages are mixed or flat, the regime scoring contribution decreases, signaling a lower-confidence environment. This prevents the system from generating strong signals in choppy, directionless phases where MA-based strategies historically underperform. You can see how Trust Scores apply to individual assets on our signals dashboard or review specific signal breakdowns like AAPL's signal page.
Key Takeaways
- Bitcoin's trending behavior makes it uniquely suited to moving average analysis — MAs carry more predictive weight on BTC than on mean-reverting assets like forex pairs.
- Stocks365 backtested data shows crypto leads all asset classes for Price Crosses Below SMA 20, with a 66.8% win rate — downside crosses in BTC carry more edge than upside crosses.
- The Golden Cross and Death Cross patterns work best as trend confirmation tools, not entry triggers — the edge comes from the pre-cross setup, not the cross itself.
- Multi-timeframe alignment (weekly macro + daily setup + 4-hour entry) dramatically improves signal quality compared to single-timeframe MA analysis.
- When Bitcoin's moving averages flatten and converge, reduce MA-based strategy exposure — the tool works in trending markets, not choppy ones.
- RSI momentum confirmation layered on top of SMA signals consistently improves win rates — use both together, not either in isolation.
Frequently Asked Questions
What is the best moving average for Bitcoin trading?
No single moving average is universally best — it depends on your timeframe and strategy. The 200-SMA on the weekly chart is the most reliable macro trend filter, distinguishing bull and bear market phases. The 50-SMA on the daily chart marks medium-term trend control and produces high-probability setups when reclaimed after extended periods below. The 20-SMA is most useful for short-term momentum analysis and entry timing. Most experienced Bitcoin traders use all three together as a layered system rather than relying on any single average.
How reliable are moving average crossovers on Bitcoin?
Moving average crossovers on Bitcoin have historically been more reliable than on most other asset classes due to Bitcoin's strong trending behavior. Stocks365 backtested data shows a 66.8% win rate for Price Crosses Below SMA 20 in crypto — the highest of any asset class tested. However, reliability drops significantly during range-bound, choppy market phases. The key filter is confirming that the crossover occurs in a trending regime (moving averages sloping clearly in one direction) before acting on the signal.
What is the Golden Cross and Death Cross in Bitcoin analysis?
The Golden Cross occurs when Bitcoin's 50-SMA crosses above the 200-SMA on the daily chart, historically signaling a transition to bull market conditions. The Death Cross is the opposite — the 50-SMA crossing below the 200-SMA — and has historically preceded extended bear market phases. The important nuance: both signals are lagging by nature. The most actionable setups come from the price action leading into these crosses, not from entering the moment the cross prints. The Golden Cross is best used as trend confirmation for positions already established, not as a standalone entry trigger.
Should I use simple (SMA) or exponential (EMA) moving averages for Bitcoin?
Both have merit, and the choice depends on your trading style. Simple Moving Averages (SMA) respond more slowly to recent price changes and create cleaner, more stable levels — better for identifying major structural support/resistance zones. Exponential Moving Averages (EMA) weight recent prices more heavily and respond faster, which helps with faster entry timing but generates more false signals in choppy markets. Many Bitcoin traders use SMA for the 50 and 200-period levels (structural analysis) and EMA for the 20-period level (short-term momentum). Consistency matters more than the specific type — pick one approach and backtest it systematically.
How do I avoid false signals from Bitcoin moving average analysis?
Three filters reduce false signals significantly. First, require a confirmed daily close above or below the moving average — intraday wicks don't count. Second, add volume confirmation: a meaningful crossover should come with above-average volume, not on thin, low-conviction trading. Third, check RSI momentum alignment — a price break above the 50-SMA carries more weight when RSI is simultaneously crossing above 50, confirming that momentum agrees with the directional move. Combining these three filters, rather than reacting to raw crossovers alone, eliminates the majority of low-quality signals.