
What Is the Bollinger Band %B Indicator?
The Bollinger Band %B indicator tells you exactly where price sits relative to the upper and lower Bollinger Bands — expressed as a precise numerical value rather than a visual estimate. John Bollinger himself considers %B one of the most powerful derivatives of his original band system. And yet, most traders ignore it entirely.
Here's the formula: %B = (Price − Lower Band) / (Upper Band − Lower Band). Simple math. Profound implications.
When %B reads 1.0, price is touching the upper band. When it reads 0.0, price is at the lower band. When it reads 0.5, price sits exactly at the 20-period moving average — the midline. Values above 1.0 mean price has pierced the upper band. Values below 0.0 mean price has dropped below the lower band.
This single number turns a visual, subjective reading into a quantifiable signal. That's the edge.
How Bollinger Band %B Differs From Standard Bollinger Bands
Standard Bollinger Bands show you a picture. Bollinger Band %B gives you a number. Both tools track the same underlying data, but %B lets you compare volatility positioning across different instruments, timeframes, and historical periods with mathematical precision.
Think of it this way: looking at a chart and saying "price seems close to the upper band" is a guess. Reading %B at 0.92 is a fact.
%B Values and Their Meaning
- %B above 1.0: Price above upper band — potential overbought zone or strong trend continuation
- %B between 0.8 and 1.0: Price in the upper quartile — bullish momentum territory
- %B at 0.5: Price at the middle band (20-SMA) — neutral, decision point
- %B between 0.2 and 0.0: Price in the lower quartile — bearish momentum territory
- %B below 0.0: Price below lower band — potential oversold zone or strong downtrend
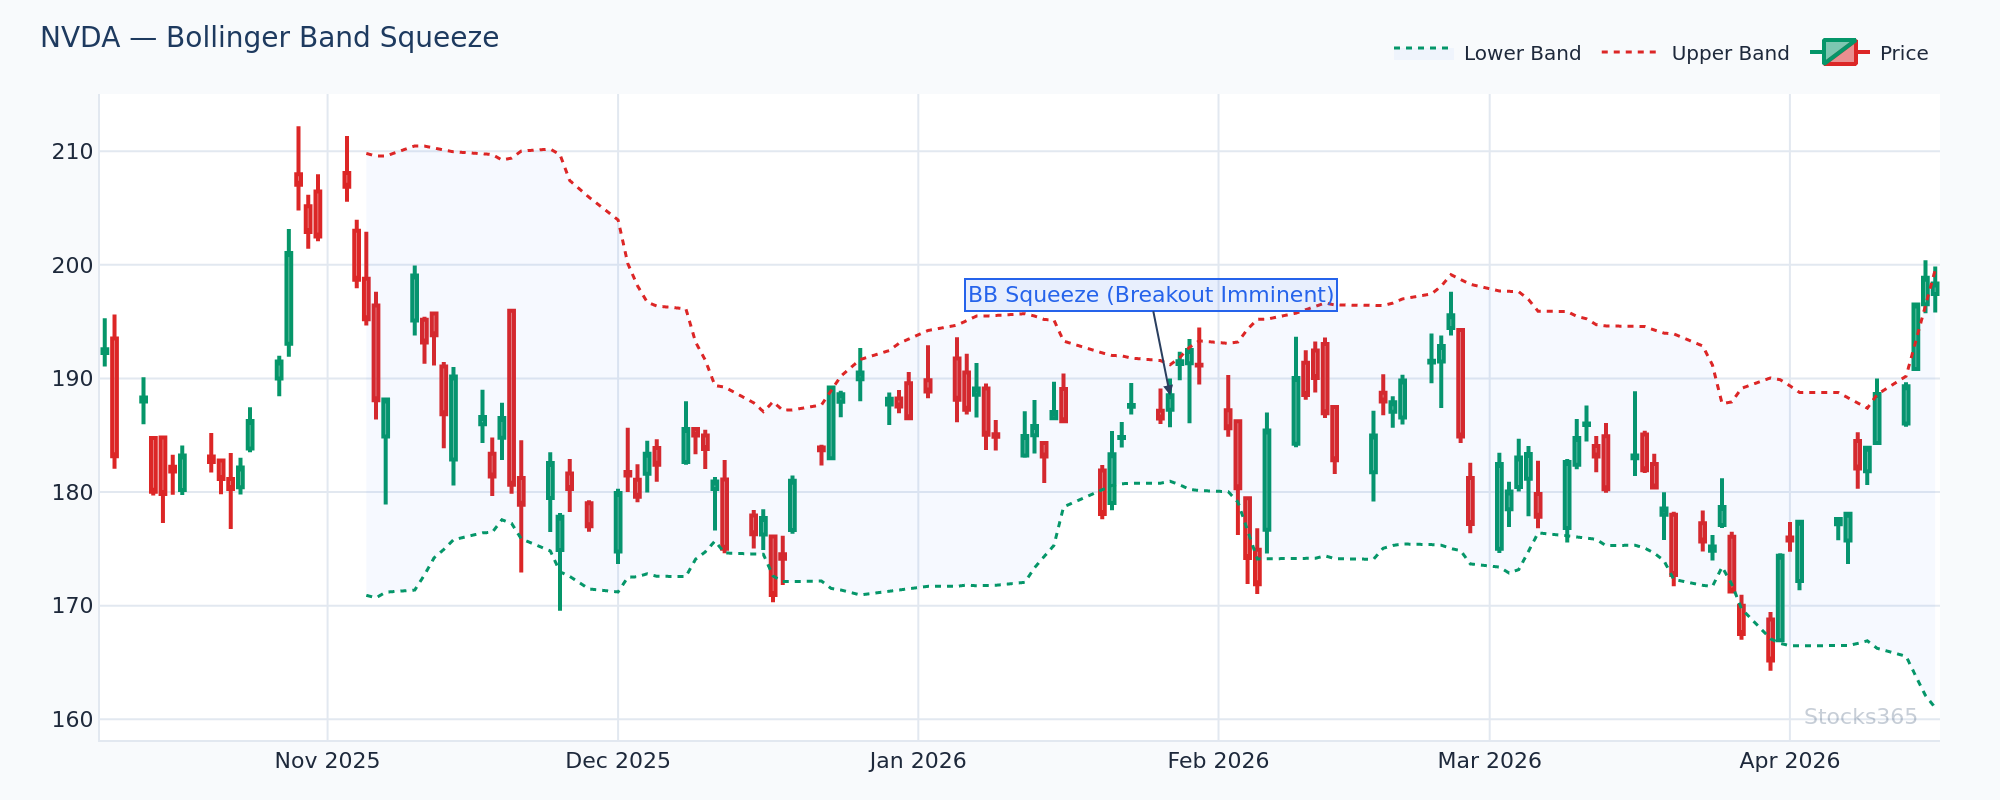
This chart shows NVDA during a band squeeze — notice how %B compresses toward 0.5 as the bands tighten. The critical signal comes when %B breaks decisively above 0.8 or below 0.2 after a prolonged squeeze, signaling that the expansion phase has begun. Confirmation arrives when volume surges alongside the %B move. A failure to hold the breakout level — %B snapping back toward 0.5 within two candles — invalidates the setup.
The Core Bollinger Band %B Trading Signals
There are four primary %B signals every serious trader needs to understand. Master these, and you'll read Bollinger Bands at a level most retail traders never reach.
1. %B Overbought and Oversold Readings
When %B rises above 1.0, price has moved outside the upper Bollinger Band. In a ranging market, this is a reliable mean-reversion trigger. In a trending market, it's a sign of strength — not a sell signal.
Here's what most traders get wrong: they treat %B above 1.0 as an automatic short signal. In strong uptrends, %B can stay above 0.8 for dozens of candles. The edge isn't the level itself — it's watching %B fail to sustain above 1.0 and roll back toward 0.5. That rollover is the signal. The initial breach above 1.0 is just context.
The same logic applies to the downside. %B below 0.0 in a downtrend confirms momentum, not a buy. Wait for the bounce confirmation — %B crossing back above 0.2 with narrowing candles and volume contraction.
2. %B Divergence — The Setup Most Traders Miss
%B divergence is arguably the most powerful signal in the entire Bollinger Band toolkit. It works like this: price makes a new high, but %B prints a lower high. That's bearish divergence. Price makes a new low, but %B prints a higher low — bullish divergence.
This signal works because it reveals diminishing momentum within the band structure. Price appears to be pushing to extremes, but the band system tells a different story — the move is losing energy relative to the bands.
If you're familiar with RSI divergence, this concept will feel familiar. For a deeper look at how divergence signals work across indicators, the RSI Divergence Explained: Master Bullish & Bearish Signals guide covers the mechanics in detail — and many of those principles apply directly to %B divergence setups.
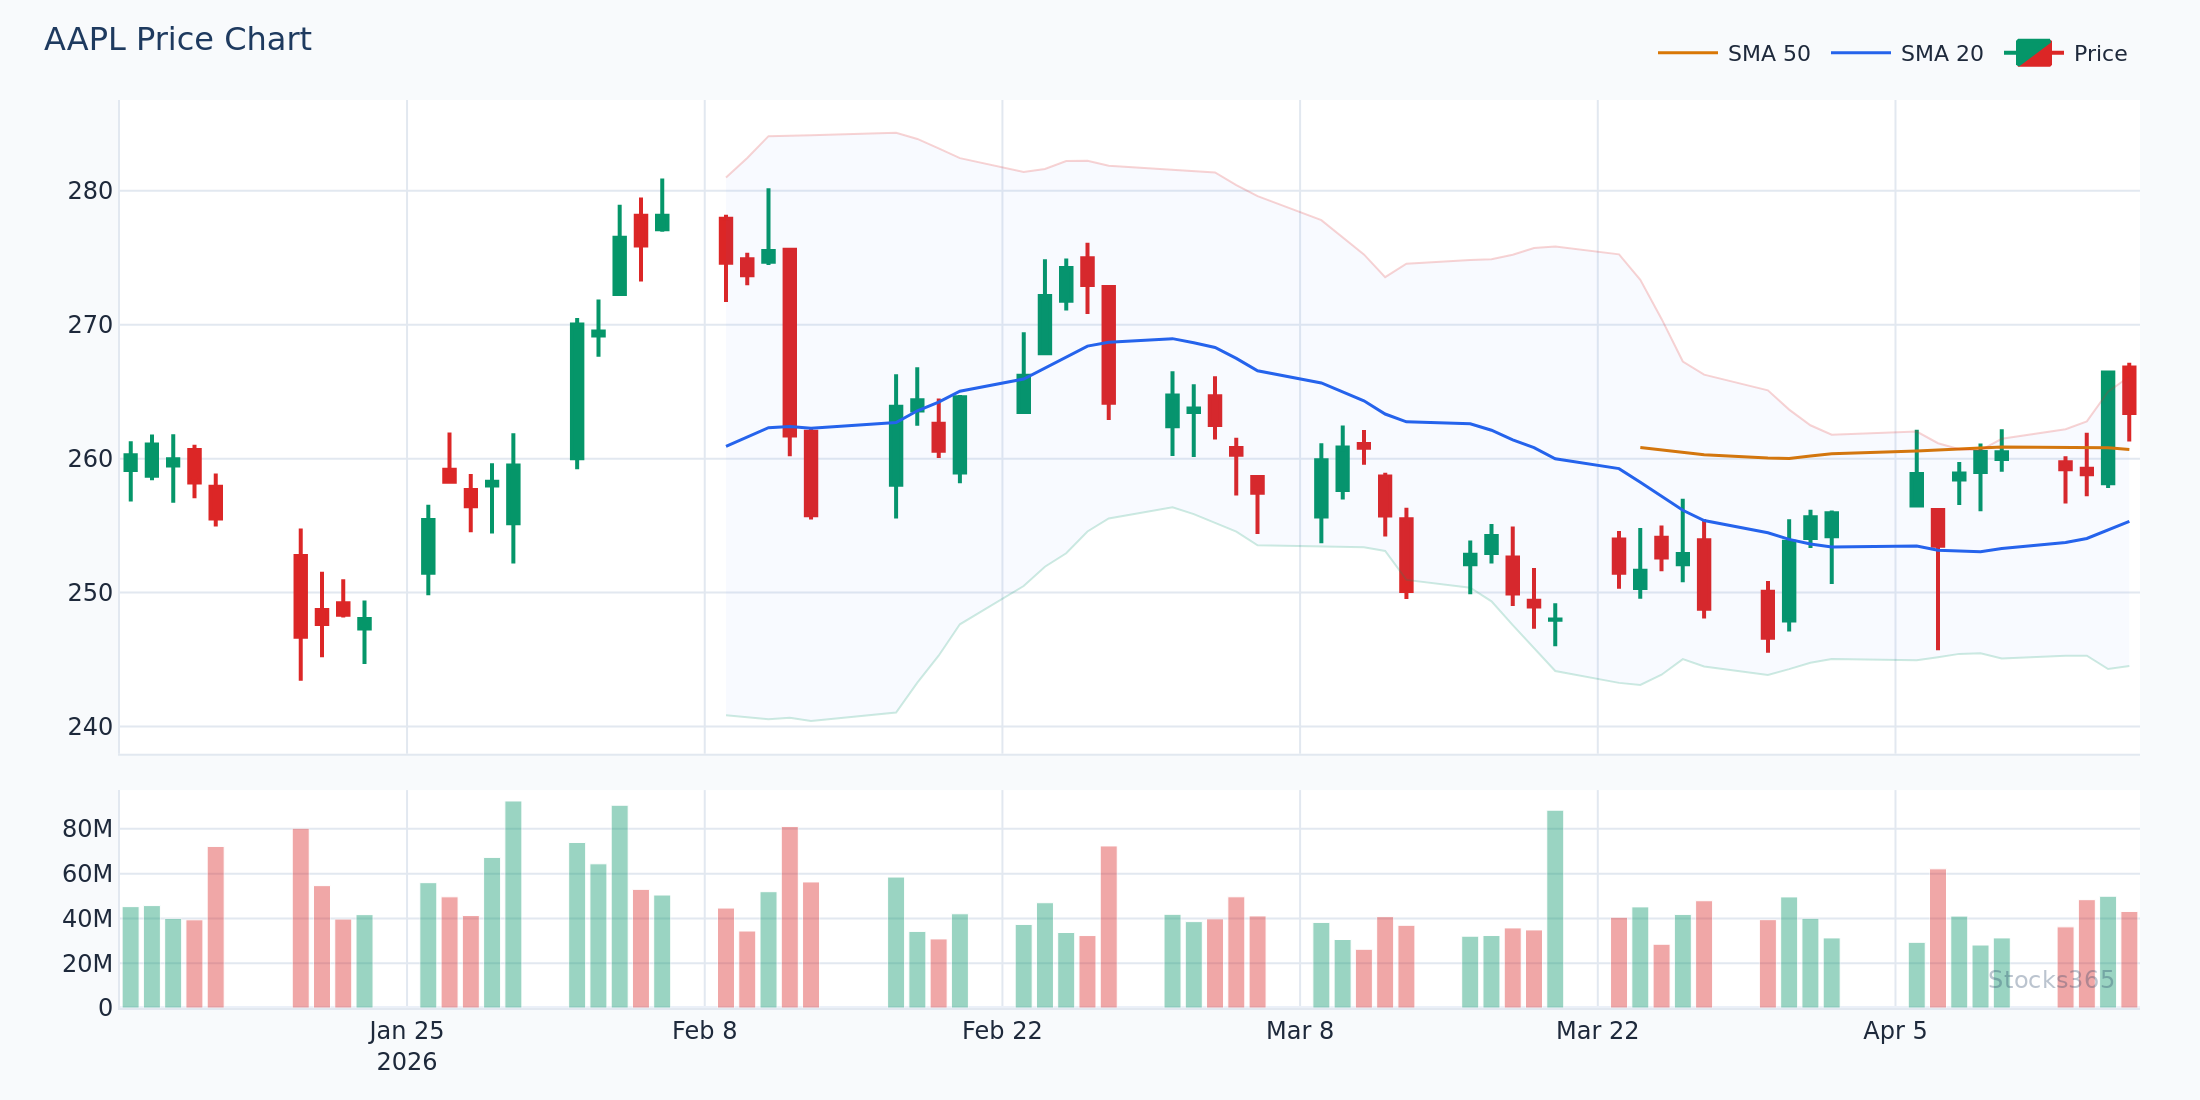
This AAPL setup illustrates textbook bearish %B divergence — price reaches a fresh high while %B peaks at a lower level than the prior swing, indicating the rally is running out of band-relative momentum. The pattern typically resolves with a pullback toward the 20-SMA or the lower band over the following 3–7 sessions. Invalidation occurs if %B immediately surges back above the prior high, confirming trend continuation rather than reversal.
3. %B Midline Crosses (The 0.5 Level)
The 0.5 level on %B corresponds exactly to the 20-period moving average — the Bollinger midline. Crosses above and below 0.5 act as trend filters.
- %B crossing above 0.5: Bullish regime — price reclaims the 20-SMA after a pullback
- %B crossing below 0.5: Bearish regime — price breaks below the 20-SMA after a rally
Use the 0.5 cross as a filter, not a trigger. Enter on the cross, hold while %B stays on the right side of 0.5, and exit when it crosses back. Clean. Mechanical. Repeatable.
4. %B During Bollinger Squeezes
A Bollinger Squeeze — when the bands compress to historically narrow width — is a volatility setup. %B adds precision to the breakout read. During a squeeze, %B naturally compresses toward 0.5. When the squeeze resolves, %B explodes toward 1.0 (bullish breakout) or collapses toward 0.0 (bearish breakdown).
The direction of %B's initial move out of the squeeze is your directional signal. Strength of the move — how quickly and decisively %B reaches 0.8+ or 0.2− — tells you the conviction behind the breakout.
Our analysis of 14,266 Bollinger Squeeze Breakout signals found a profit factor of 1.03 over a 10-day holding period, with crypto leading at 51.8% win rate versus forex lagging at 47.1%. The edge exists — but asset class selection matters. See the full dataset at Stocks365 Insights.
Combining Bollinger Band %B With Other Indicators
%B alone is powerful. %B combined with the right confirming indicators is elite-level analysis.
%B + RSI: The High-Probability Combo
This is the combination professional traders rely on most. When %B drops below 0.0 and RSI simultaneously drops below 30, you have a double-confirmed oversold reading. When %B rises above 1.0 and RSI climbs above 70, you have a double-confirmed overbought reading.
The key: look for divergence between the two. If %B makes a new low but RSI fails to confirm with a new low, the divergence across two independent indicators strengthens the reversal case considerably.
For a complete breakdown of how RSI calculation works and why the math matters for confluence setups like this, read How RSI Is Calculated: Formula Explained Step by Step. Understanding the formula reveals why RSI and %B diverge at key turning points.
New to RSI entirely? Start with What Is RSI? The Complete Beginner's Guide for the foundational concepts before layering in %B analysis.
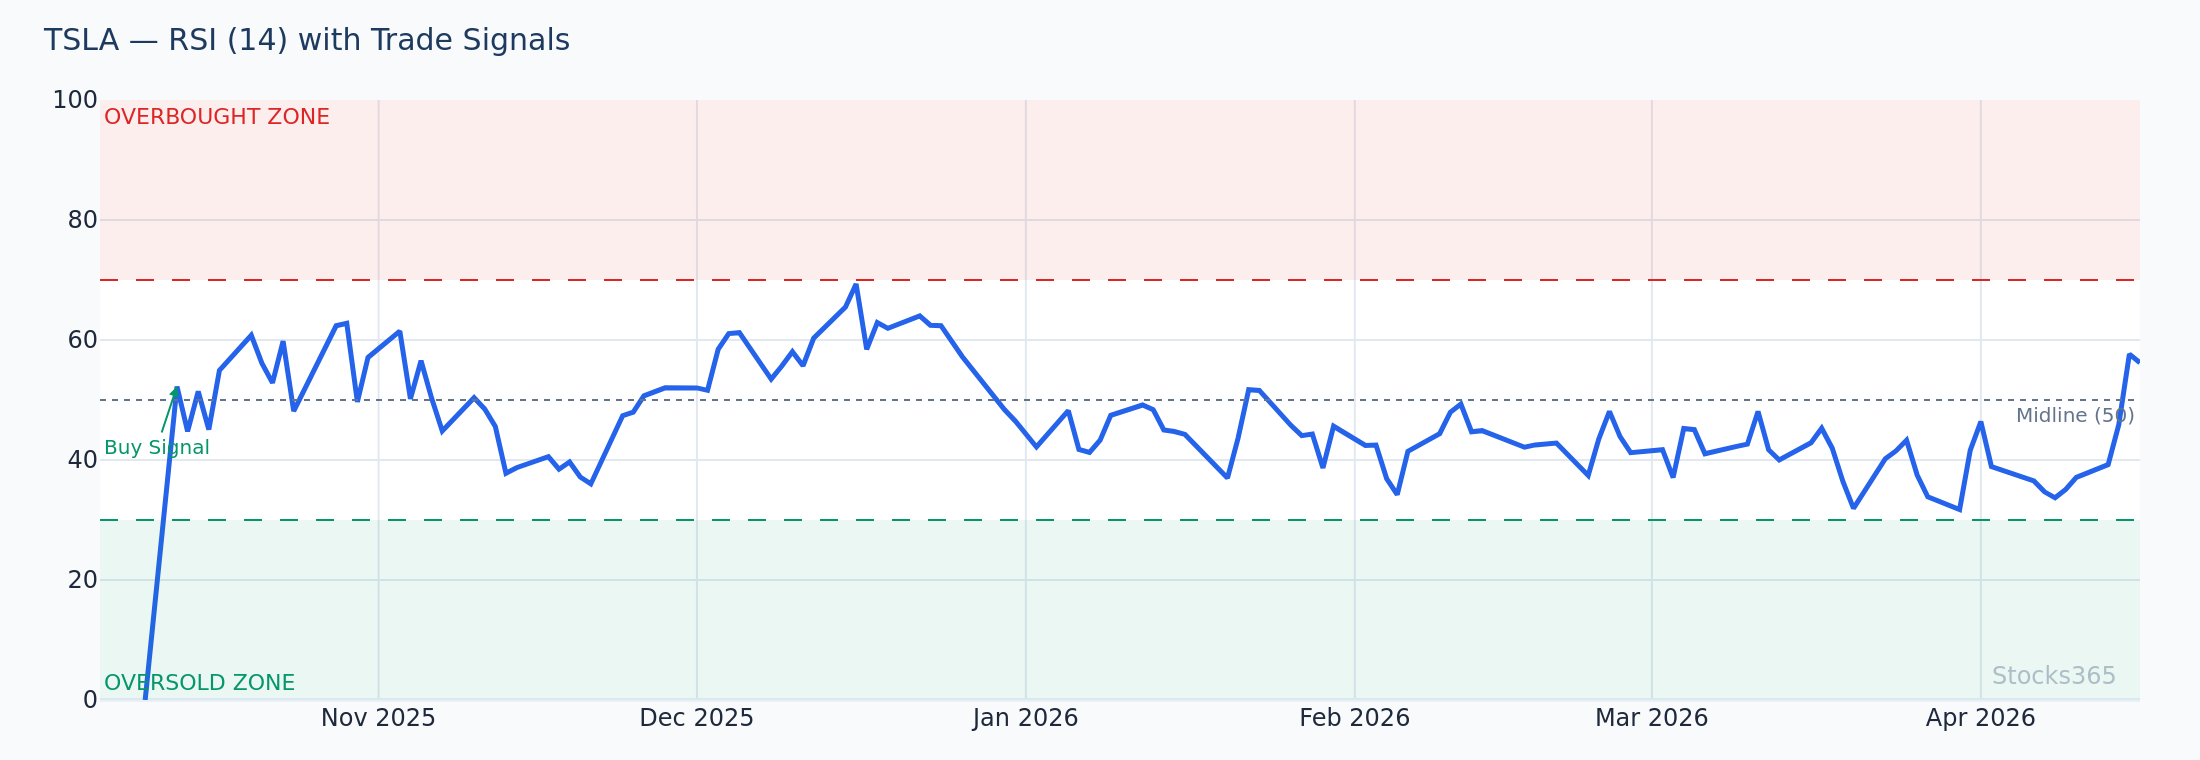
This TSLA chart shows the dual-confirmation setup in action — %B drops below 0.0 while RSI simultaneously reads below 30, creating a high-conviction oversold signal. Historically, this double confirmation reduces false positives compared to either indicator alone. The pattern resolves bullishly when %B crosses back above 0.2 and RSI reclaims the 40 level — that double recovery is the confirmation entry trigger.
%B + Stochastic Oscillator: Momentum Alignment
Combining %B with the Stochastic Oscillator creates a layered momentum read. When both indicators simultaneously reach overbought or oversold extremes, the signal carries more weight — but not necessarily more accuracy.
Stocks365 research across 3,026 BB + Stochastic Double Overbought signals found a 49.9% win rate with a profit factor of 0.91 over a 10-day holding period — with crypto showing the best performance at 58.0% and commodities the worst at 40.7%. Raw overbought readings alone don't produce an edge. Asset class selection and confirmation signals are what separate profitable setups from noise. Explore the complete breakdown at Stocks365 Insights.
For a deeper dive into how Stochastic compares to RSI as a %B companion, the RSI vs Stochastic Oscillator: The Essential Guide covers the mechanical differences that affect how each interacts with %B signals.
%B + Volume: The Confirmation Layer
Volume is the truth detector for %B signals. A %B breakout above 1.0 on double the average volume is a very different signal than the same %B reading on 50% of average volume. Low-volume %B extremes reverse quickly. High-volume %B extremes tend to persist or mark genuine inflection points.
Always check volume before acting on a %B signal. Always.
Advanced %B Patterns: W-Bottoms and M-Tops
John Bollinger identified specific multi-bar patterns using %B that have stood the test of decades of market data.
The W-Bottom Pattern Using %B
A W-Bottom forms across two lows. The first low sees %B drop below 0.0. Price rallies. Price then makes a second low — but %B prints above 0.0 on this second test. That higher %B reading on a price re-test is the bullish confirmation signal. The setup completes when price rallies back above the midpoint of the W formation and %B crosses above 0.5.
The M-Top Pattern Using %B
The mirror image of the W-Bottom. First high: %B rises above 1.0. Price pulls back. Price makes a second high — but %B prints below 1.0. That lower %B reading on a price re-test is the bearish signal. The pattern confirms when price breaks below the pullback low and %B crosses below 0.5.
These patterns are especially powerful when combined with hidden divergence on RSI. The Hidden RSI Divergence guide explains why these continuation and reversal signals so frequently align with %B M-Tops and W-Bottoms.
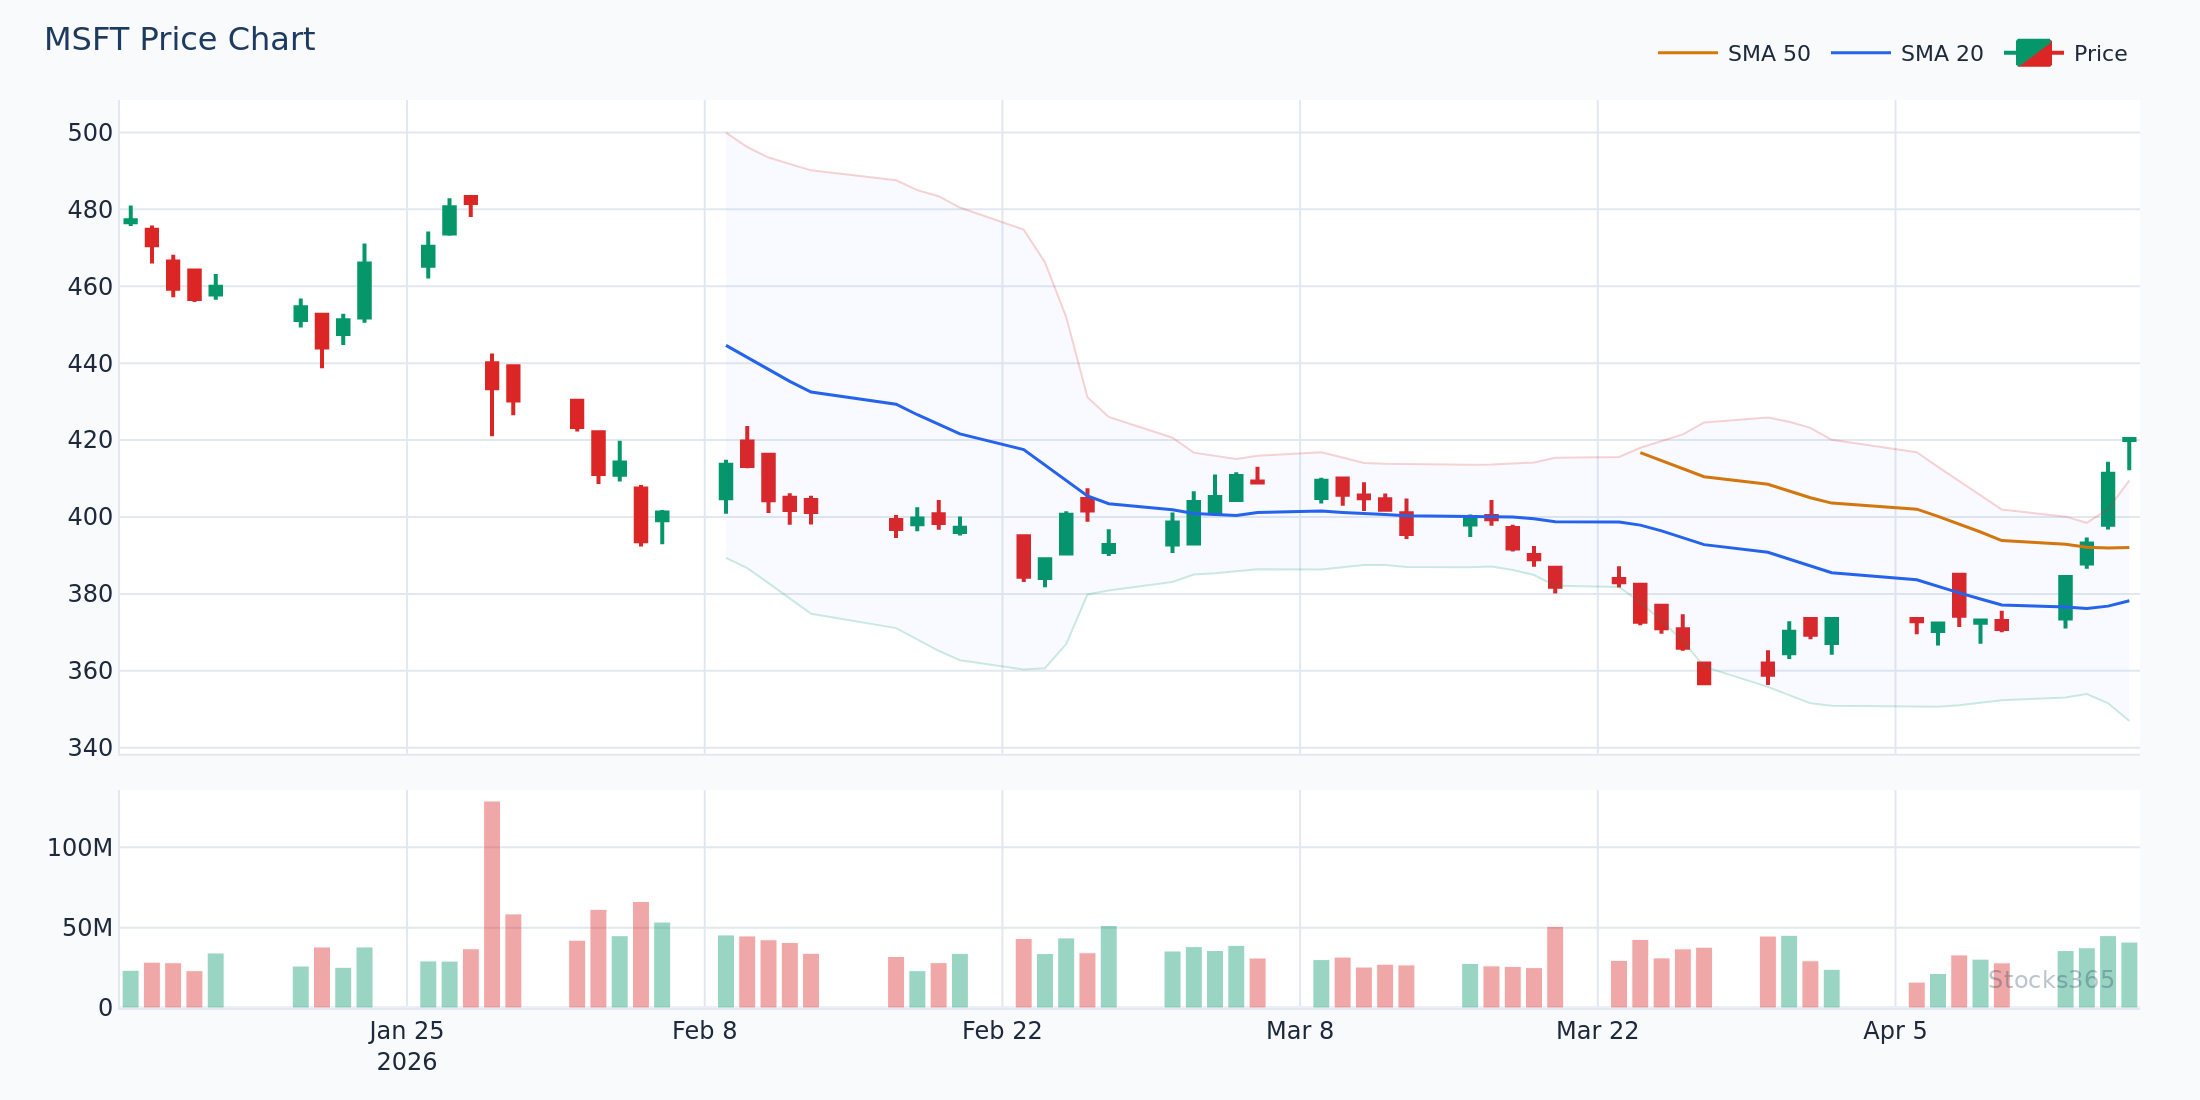
This MSFT chart shows a classic W-Bottom setup — the first trough pushes %B below 0.0, the second trough holds above 0.0 despite price re-testing near the prior low. The divergence between price and %B on the second trough is the actionable signal. Confirmation arrives when %B crosses back above 0.5 and the 20-SMA is reclaimed on above-average volume, invalidating the pattern if the second trough sees %B break even lower than the first.
Bollinger Band %B Settings and Customization
The default %B settings use a 20-period SMA with 2 standard deviations. These defaults work well across most timeframes and instruments. But adjustments matter in specific contexts.
Shorter Periods (10-period %B)
A shorter period makes %B more reactive. It reaches extremes more frequently, producing more signals — and more false signals. Use shorter-period %B for scalping setups on high-liquidity instruments where rapid mean reversion is the strategy.
Longer Periods (50-period %B)
A longer period smooths %B, filtering out noise. Extremes are rarer and more meaningful. This setting suits swing traders and position traders looking for high-conviction signals on weekly or daily timeframes.
The same logic applies to RSI period selection. For a parallel discussion on how period length changes signal quality, RSI Settings: Master the Best Period for Your Strategy covers the optimization framework in depth.
Standard Deviation Adjustments
Widening to 2.5 standard deviations means fewer %B touches at the extremes — but higher-quality signals when they occur. Narrowing to 1.5 standard deviations increases frequency of extreme readings, requiring more confirmation filters to maintain signal quality.
Practical %B Trading Setups
Theory is useless without application. Here are three concrete %B setups.
Setup 1: The %B Bounce From Oversold
Conditions: %B drops below 0.0. RSI drops below 30 simultaneously. Volume contracts on the final red candles. A bullish reversal candle forms (hammer, engulfing, doji with close near high). Entry: when %B crosses back above 0.1 on the next candle. Target: %B reaching 0.5 (midline). Stop: %B closing below the recent low print.
Setup 2: The %B Trend Continuation Pullback
Conditions: %B is in a sustained uptrend (consistently above 0.5 for 10+ periods). Price pulls back, dropping %B toward 0.4–0.5. Volume on the pullback is below average. Entry: when %B bounces from the 0.5 area and a bullish candle confirms. Target: re-test of the prior %B high. Stop: %B closing below 0.4.
Setup 3: The %B Squeeze Breakout
Conditions: Bollinger Band Width (the companion indicator) drops to multi-month lows. %B compresses between 0.4 and 0.6 for 5+ periods. A directional candle breaks the band. Entry: when %B closes above 0.8 (bullish) or below 0.2 (bearish). Target: %B sustaining above 1.0 or below 0.0 for continuation. Stop: %B reverting back inside the 0.4–0.6 range.
For a complete framework on using momentum indicators step-by-step in live trading, How to Use RSI in Trading: The Ultimate Step-by-Step Guide provides a structured approach that translates directly to %B-based trading workflows.
What to Watch For
- %B W-Bottom on large-cap tech after a 15%+ drawdown: When price makes a double-bottom but %B's second trough is higher than the first, and RSI simultaneously shows bullish divergence below 35, the probability of a sustained recovery increases sharply — watch for %B crossing back above 0.5 as the confirmation trigger.
- Squeeze breakout direction confirmation: When Bollinger Band Width falls to the 10th percentile of its 52-week range and %B then surges above 0.8 on above-average volume, the expansion phase often produces a 2–3 ATR move in the breakout direction — crypto instruments historically show the strongest follow-through.
- %B failure at 1.0 after three consecutive tests: When %B touches or exceeds 1.0 three times without price making a meaningful new high, and the Stochastic Oscillator simultaneously rolls over from overbought, a mean-reversion move toward the 0.5 level is the high-probability outcome.
- %B midline defense in uptrends: In strong trending instruments, watch for %B to bounce from 0.5 without breaking below it during pullbacks — this midline hold pattern is a trend-continuation signal, and entry on the bounce from 0.5 keeps the stop tight relative to the potential reward.
- %B divergence in the final legs of parabolic moves: When price makes successive new highs but each peak in %B is lower than the last, treat it as a warning that the trend is exhausting band-relative momentum — not a trigger to short immediately, but a signal to tighten profit-taking levels.
How Stocks365 Uses Bollinger Band %B
The Stocks365 trust score system integrates Bollinger Band %B as one of 12+ technical indicators that contribute to each instrument's signal quality score. Specifically, %B readings feed into the volatility scoring and momentum agreement components of the trust score.
When %B aligns with RSI, Stochastic, and volume confirmation in the same direction, the system registers a higher agreement score — reflecting that multiple independent indicators are pointing to the same conclusion. Extreme %B readings (above 1.0 or below 0.0) trigger a volatility flag that adjusts signal confidence based on whether the broader regime favors trend-following or mean-reversion strategies.
You can see live %B-influenced trust scores across instruments on the Stocks365 signals dashboard. For individual stock analysis incorporating %B signals, check pages like AAPL signals to see how %B contributes to the overall technical picture in real time. The goal: never trade a single indicator in isolation. %B is one voice in a chorus — the trust score tells you when the chorus is in agreement.
Frequently Asked Questions
What does Bollinger Band %B tell you?
Bollinger Band %B tells you precisely where the current price sits within the Bollinger Band structure, expressed as a value from 0.0 (lower band) to 1.0 (upper band). Values above 1.0 indicate price above the upper band; values below 0.0 indicate price below the lower band. This turns a visual estimate into a quantifiable, comparable metric.
What is a good %B reading to trade?
There's no single "good" reading in isolation — context determines everything. In trending markets, sustained %B above 0.8 signals trend strength, not overbought danger. In ranging markets, %B above 1.0 or below 0.0 are reliable mean-reversion triggers. The most powerful signals come from %B divergence and post-squeeze breakouts, not static level readings alone.
How is Bollinger Band %B different from the %K Stochastic?
Both express price position as a percentage within a range, but they measure different things. Stochastic %K measures price relative to the high-low range over a set period. Bollinger Band %B measures price relative to a statistically defined volatility envelope (standard deviation bands). %B adjusts dynamically to current volatility; %K does not.
Can %B be used on any timeframe?
Yes. %B works on any timeframe from 1-minute charts to monthly charts. Shorter timeframes produce more frequent but noisier signals. Longer timeframes produce fewer but higher-conviction signals. The optimal timeframe depends on your holding period and strategy type — scalpers favor sub-hourly; swing traders prefer daily or weekly %B readings.
How do I avoid false %B signals?
Use confirmation. A %B extreme alone is a data point. A %B extreme confirmed by RSI divergence, volume characteristics, and a candlestick reversal pattern is a trade setup. The RSI Overbought and Oversold Levels guide explains how to layer RSI confirmation onto extreme readings — the same framework applies directly to %B false signal filtering.
Key Takeaways
- %B quantifies position within the bands — 0.0 is the lower band, 1.0 is the upper band, 0.5 is the midline (20-SMA)
- Extremes are context-dependent — %B above 1.0 signals trend strength in uptrends and overbought danger in ranges
- %B divergence — price making new highs/lows while %B fails to confirm — is the highest-probability reversal signal in the system
- The 0.5 midline cross acts as a reliable trend filter for swing trading setups
- %B squeeze breakouts gain conviction when confirmed by volume surges and directional RSI momentum
- Combine %B with RSI for double-confirmation setups that reduce false positives significantly
- Asset class matters — crypto consistently shows the strongest %B-based signal performance; commodities and forex show the weakest
- W-Bottoms and M-Tops using %B are multi-bar patterns that offer high reward-to-risk entries with clear invalidation levels