
What Is the Bollinger Band Bounce Strategy?
The Bollinger Band bounce is one of the most reliable mean reversion strategies in technical analysis. Developed from John Bollinger's groundbreaking work in the 1980s, the core principle is elegantly simple: price tends to revert toward its statistical mean after touching extreme boundaries. When a stock's price touches or briefly pierces the upper or lower Bollinger Band, it often snaps back toward the 20-period moving average at the center — and skilled traders use that predictable behavior to their advantage.
In 2026, with algorithmic trading dominating intraday volume and volatility clustering across major indices, understanding how to trade the Bollinger Band bounce with discipline and confirmation has never been more valuable. This guide breaks down every component of the strategy — from the math behind the bands to precise entry triggers, stop placements, and real-world trade examples.
How Bollinger Bands Work: The Foundation You Need
Before executing a Bollinger Band bounce trade, you must understand the mechanics driving the bands. Bollinger Bands consist of three lines plotted on a price chart:
- Middle Band: A 20-period Simple Moving Average (SMA) — the statistical mean price
- Upper Band: Middle Band + (2 × standard deviation of price)
- Lower Band: Middle Band − (2 × standard deviation of price)
The standard deviation calculation makes the bands dynamic. When volatility expands, the bands widen. When the market quiets, the bands contract — a condition known as a squeeze. Statistically, approximately 95% of all price action occurs within the bands when using the default 2 standard deviation setting. This is exactly why a touch of the outer bands is a statistically significant event worth paying attention to.
"The bands are not buy and sell signals in themselves. The bands define relative high and low, and it is the combination of price action and indicators derived from the price that yields the trading signals." — John Bollinger
This quote is the single most important concept to internalize before trading the bounce. The band touch is a condition, not a signal. Confirmation is everything.
The Core Bollinger Band Bounce Setup
Lower Band Bounce (Bullish Mean Reversion)
The bullish Bollinger Band bounce occurs when price tags the lower band after a decline and then reverses higher toward the middle band. Here are the conditions that define a high-probability setup:
- Price closes at or below the lower Bollinger Band on a specific candle
- The subsequent candle reverses and closes back inside the bands
- The overall trend context (weekly timeframe) is either neutral or bullish
- Volume on the reversal candle is higher than the prior decline candles
- A momentum oscillator confirms oversold conditions (more on this below)
Upper Band Bounce (Bearish Mean Reversion)
The bearish version mirrors the bullish setup. When price surges to touch or pierce the upper band and then closes back below it, the expected move is a reversion toward the 20-period SMA. Look for:
- Price closes at or above the upper Bollinger Band
- The next candle reverses and closes back within the bands
- Trend context on higher timeframes is neutral or bearish
- Declining volume on the final push to the band
- Momentum oscillator showing overbought readings
Confirming the Bounce: Pairing Bollinger Bands with Momentum Indicators
Trading a raw Bollinger Band touch without confirmation is a common mistake that leads to being caught in breakout moves. The most powerful confirmation tools are momentum oscillators, which measure the strength behind price movement at the band boundary.
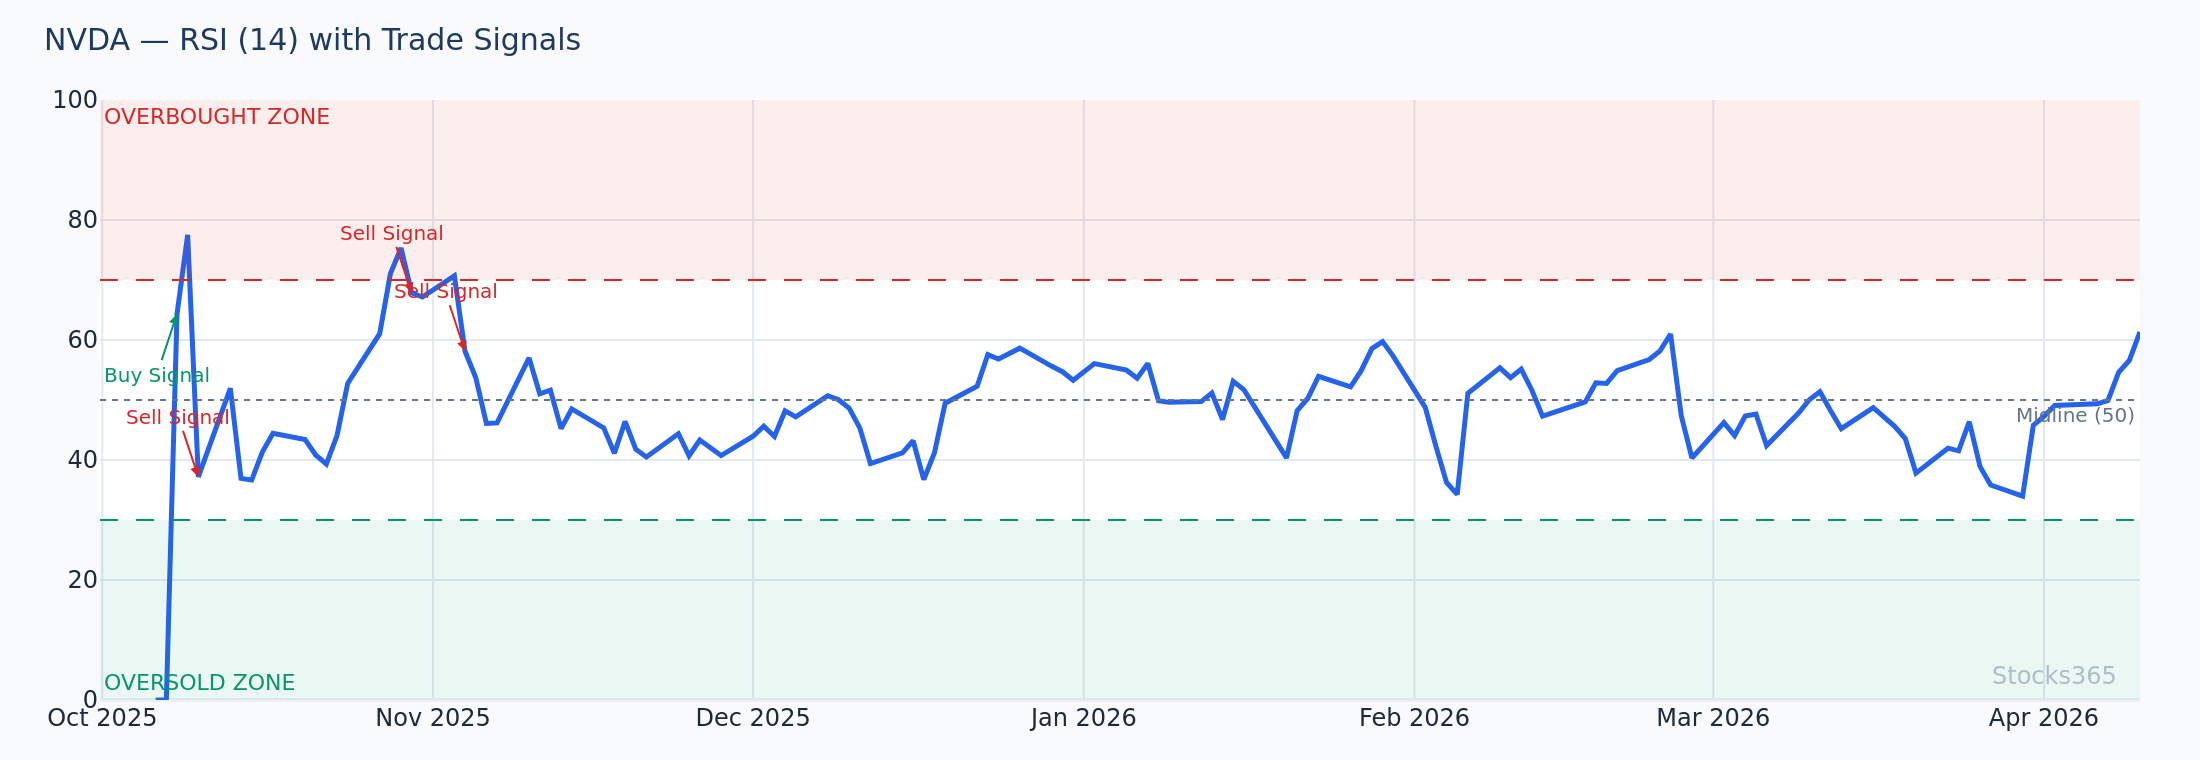
Using RSI to Confirm Bollinger Band Bounces
The Relative Strength Index (RSI) is arguably the best companion indicator for Bollinger Band bounce trading. When price touches the lower band and RSI simultaneously reads below 30 (oversold territory), the probability of a successful bounce increases dramatically. Conversely, an upper band touch paired with RSI above 70 signals a high-probability bearish reversion.
If you're new to RSI, the What Is RSI? The Complete Beginner's Guide on Stocks365 provides a thorough foundation. For understanding exactly how RSI levels generate actionable signals, explore the in-depth piece on RSI Overbought and Oversold Levels.
Even more powerful is spotting RSI divergence at the band boundary. If price makes a new low touching the lower Bollinger Band, but RSI prints a higher low, this bullish divergence signals fading bearish momentum — exactly the condition needed for a reliable bounce. The Stocks365 guide on RSI Divergence Explained walks through how to identify these setups precisely. For advanced traders, Hidden RSI Divergence offers additional layers of confirmation that most traders overlook entirely.
Using the Stochastic Oscillator as an Alternative
The Stochastic Oscillator is another effective confirmation tool for Bollinger Band bounce trades, particularly in shorter timeframes like the 15-minute or 1-hour charts. A Stochastic reading below 20 at the lower band or above 80 at the upper band adds statistical weight to the bounce thesis. For a detailed comparison of which oscillator fits your trading style, the Stocks365 article RSI vs Stochastic Oscillator: The Essential Guide is a must-read.
Real Trade Example: NVDA Lower Band Bounce
Let's walk through a practical, recent example using NVIDIA (NVDA) to illustrate how a textbook Bollinger Band bounce unfolds from entry to exit.
Setup Conditions (Daily Chart):
- NVDA had pulled back sharply over four consecutive sessions following an earnings-driven run
- Price tagged the lower Bollinger Band at $118.40, closing at $119.10 — just inside the band
- RSI (14-period) reached 28.6 — firmly in oversold territory
- Volume on the reversal candle was 1.8× the 20-day average
- The 20-period SMA (middle band) sat at $131.50
Trade Execution:
- Entry: $120.25 — triggered on the open of the candle following the lower band touch, after confirmation of the close back inside the bands
- Stop Loss: $116.80 — placed below the lower band extreme and the nearest swing low
- Target 1: $125.50 — midpoint between entry and the middle band (partial profit)
- Target 2: $131.50 — the 20-period SMA / middle band (full mean reversion target)
- Risk/Reward: Approximately 1:3.2 to the full target
The trade reached Target 1 within two sessions and hit the middle band in five trading days — a clean, high-probability mean reversion with well-defined risk.
Bollinger Band Bounce Strategy: Entry Rules and Risk Management
Entry Criteria Checklist
Discipline is what separates consistently profitable traders from those who blow up their accounts. Before entering any Bollinger Band bounce trade, run through this checklist:
- ✅ Price has touched or briefly closed outside the upper or lower Bollinger Band
- ✅ The following candle closes back inside the bands (the reversal confirmation candle)
- ✅ At least one momentum oscillator confirms overbought/oversold extreme
- ✅ The trade aligns with the broader trend context on the next higher timeframe
- ✅ Volume supports the reversal (expanding on the bounce candle, contracting on the exhaustion move)
- ✅ No major scheduled catalysts (earnings, Fed decisions) that could override mean reversion logic
Stop Loss Placement
Effective stop placement is non-negotiable. For a lower band bounce, place your stop below the low of the band-touch candle — not at the band itself. Markets frequently wick below the band before reversing, so a stop set exactly at the band will get triggered prematurely. A buffer of 0.5% to 1.5% below the candle low is standard practice.
For an upper band bounce, place your stop above the high of the band-touch candle with the same buffer logic applied.
Profit Targets for Mean Reversion Trades
The beauty of the Bollinger Band bounce is that it provides built-in, logical price targets:
- Conservative Target: The midpoint between the entry price and the middle band (20-period SMA) — captures roughly 50% of the mean reversion move
- Standard Target: The middle band (20-period SMA) itself — the statistical mean that price is reverting toward
- Aggressive Target: The opposite Bollinger Band — suitable only when a strong trend reversal signal is present (e.g., significant RSI divergence, major support/resistance flip)
Many experienced traders use a scaled exit approach: take 50% of the position off at the conservative target, move the stop to breakeven, and let the remaining 50% run to the middle band target. This approach locks in profits while giving the trade room to develop fully.
Common Mistakes Traders Make with Bollinger Band Bounce Setups
Mistake 1: Trading Against a Strong Trend
The Bollinger Band bounce is a mean reversion strategy, which means it performs best in ranging or mildly trending markets. During a powerful trending market, price can "walk the bands" — hugging the upper or lower band for extended periods without reverting. Always check the weekly chart trend before fading a band touch on the daily.
Mistake 2: Entering Without Confirmation
Jumping into a trade the moment price touches a band — before the reversal candle closes — is one of the most expensive habits in trading. A price touching the lower band does not guarantee a bounce. It needs to close back inside the band with supporting oscillator confirmation before the setup is valid.
Mistake 3: Using Wrong RSI Settings
The default 14-period RSI is well-suited for daily charts, but shorter or longer timeframes may require adjustment. Understanding how to optimize your oscillator for your specific trading timeframe is covered in depth in the Stocks365 guide on RSI Settings: Master the Best Period for Your Strategy. Additionally, How to Use RSI in Trading provides a comprehensive step-by-step framework for integrating RSI into any strategy, including Bollinger Band bounce trading.
Mistake 4: Ignoring the Broader Market Context
Individual stock signals don't exist in a vacuum. A lower band bounce setup on a single equity is far less reliable during a broad market selloff when the S&P 500 is in a confirmed downtrend. Always cross-reference your individual setups with the macro tape.
Advanced Technique: The Double Bollinger Band Bounce
A more refined version of the standard bounce setup, the double Bollinger Band bounce, involves waiting for price to test the same band level twice before entering. The logic is straightforward: a second test of the lower band that holds above the first test's low forms a double bottom pattern at a statistically extreme level. This confirms that sellers are losing conviction and strengthens the mean reversion case significantly.
For this setup, consider pairing it with the RSI calculation foundation explained in How RSI Is Calculated: Formula Explained Step by Step — understanding the math helps you gauge how momentum is shifting during that second test.
Using Stocks365 to Find Bollinger Band Bounce Opportunities
Manually scanning hundreds of charts for valid Bollinger Band bounce setups is time-consuming and prone to missed signals. The Stocks365 signals dashboard streamlines this process by applying systematic technical screening across thousands of instruments simultaneously. The platform's proprietary Trust Score system evaluates each signal across multiple confirmation factors — including band position, momentum oscillator readings, volume patterns, and trend context — to surface only the highest-conviction setups.
For example, when reviewing a specific setup on Apple, the AAPL signal page provides a real-time view of where price stands relative to its Bollinger Bands, current RSI reading, and an overall Trust Score that quantifies the strength of the setup. Rather than assembling all these data points manually, Stocks365 does the analytical heavy lifting — letting you focus on execution and risk management.
The Trust Score is particularly useful for Bollinger Band bounce traders because it penalizes setups that lack multi-factor confirmation, which is precisely where most retail traders get into trouble. A band touch with a low Trust Score is a warning that the bounce conditions are incomplete — a filter that can save you from several losing trades per month.
Key Takeaways
📊 Bollinger Band Bounce — Summary of Core Principles:
- The Bollinger Band bounce exploits the statistical tendency for price to mean-revert after touching the outer bands (2 standard deviations from the 20-period SMA)
- Never enter on the band touch alone — wait for the reversal candle to close back inside the bands
- Always confirm with a momentum oscillator: RSI below 30 (lower band) or above 70 (upper band) dramatically improves trade probability
- Place stops below the low of the band-touch candle (for long trades) with a 0.5–1.5% buffer
- Target the middle band (20-period SMA) as your primary mean reversion objective
- Avoid the setup in strong trending conditions — the strategy thrives in ranging and mildly trending markets
- The double bounce confirmation and RSI divergence are advanced filters that further elevate setup quality
- Use the Stocks365 Trust Score to prioritize setups with full multi-factor confirmation
Frequently Asked Questions
What is a Bollinger Band bounce?
A Bollinger Band bounce is a mean reversion trading setup that occurs when price touches or briefly breaches the upper or lower Bollinger Band and then reverses back toward the 20-period moving average (the middle band). It's based on the statistical principle that approximately 95% of price action occurs within the bands, making extreme touches a statistically significant — and often temporary — event.
What timeframe works best for Bollinger Band bounce trading?
The daily chart is the most popular and reliable timeframe for Bollinger Band bounce setups because it filters out short-term noise while still providing timely signals. However, the strategy works across multiple timeframes — swing traders often use the 4-hour chart, while day traders use 15-minute or 1-hour charts. The key is to use a higher timeframe for trend context and your chosen timeframe for the actual entry signal.
How do I confirm a Bollinger Band bounce with RSI?
Look for RSI (14-period default) reading below 30 at the lower band touch (confirming oversold conditions for a bullish bounce) or above 70 at the upper band (confirming overbought conditions for a bearish bounce). Even stronger is a bullish or bearish RSI divergence at the band boundary — where price makes a new extreme but RSI does not confirm it, signaling momentum exhaustion.
Can the Bollinger Band bounce strategy be used for short selling?
Yes. The bearish version of the setup — when price touches or briefly breaches the upper Bollinger Band and then closes back inside — signals a potential short trade targeting the middle band (20-period SMA). All the same confirmation rules apply: look for RSI above 70, a reversal candle closing back within the bands, and volume patterns that support the reversal thesis. Ensure the broader market trend doesn't strongly contradict the short thesis.
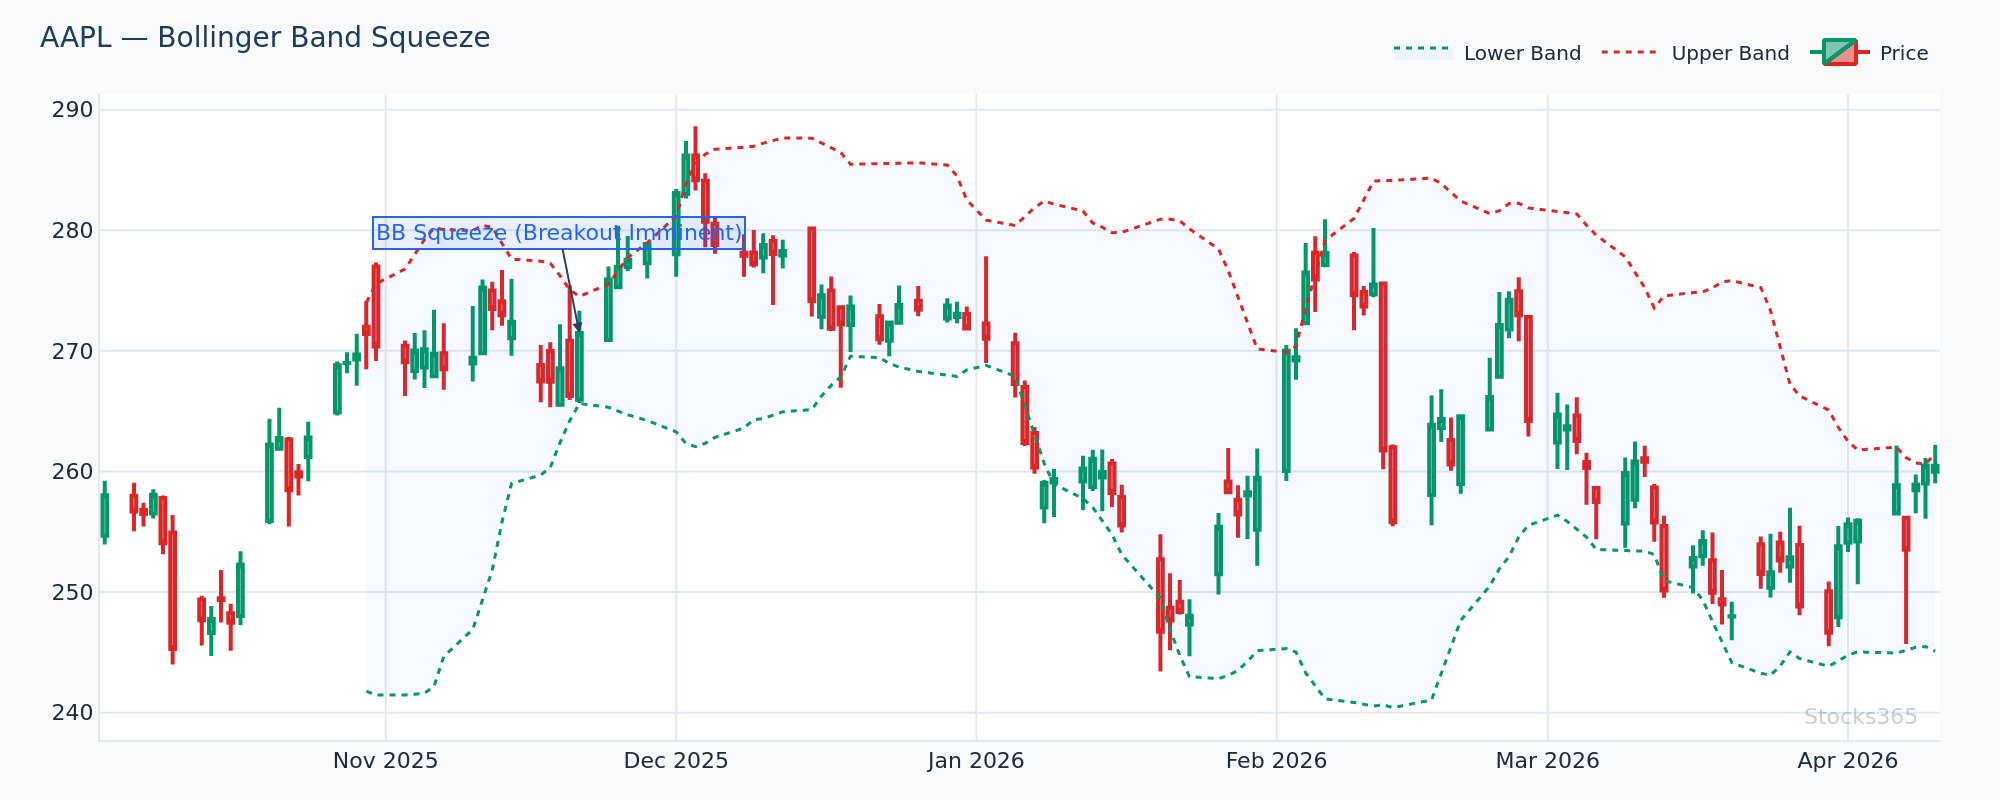
What is the difference between a Bollinger Band bounce and a Bollinger Band breakout?
These are opposite strategies. A Bollinger Band bounce (mean reversion) assumes that a band touch is a temporary extreme and price will revert toward the middle band. A Bollinger Band breakout (trend-following) assumes that a sustained push through the band signals the beginning of a new directional move. The key distinguishing factor is context: bounces are favored in ranging markets, while breakouts are favored following a band squeeze (a period of very tight bands indicating compressed volatility that typically precedes a significant directional move).