
Bollinger Bands Cheat Sheet: Everything You Need in One Place
Bollinger Bands are one of the most widely used technical indicators in trading. Developed by John Bollinger in the 1980s, they've stood the test of time because they adapt to market conditions dynamically. This cheat sheet gives you the core concepts, key signals, and practical setups — all in one place.
No filler. No fluff. Just the essentials.
What Are Bollinger Bands? The 60-Second Version
Bollinger Bands consist of three lines plotted on a price chart:
- Middle Band: A 20-period Simple Moving Average (20-SMA)
- Upper Band: 20-SMA + 2 standard deviations
- Lower Band: 20-SMA − 2 standard deviations
The bands expand when volatility increases and contract when volatility decreases. That dynamic behavior is what makes them powerful — they're self-adjusting to the market's current rhythm.
Statistically, price stays within the bands roughly 95% of the time when using 2 standard deviations. That other 5%? That's where the edge lives.
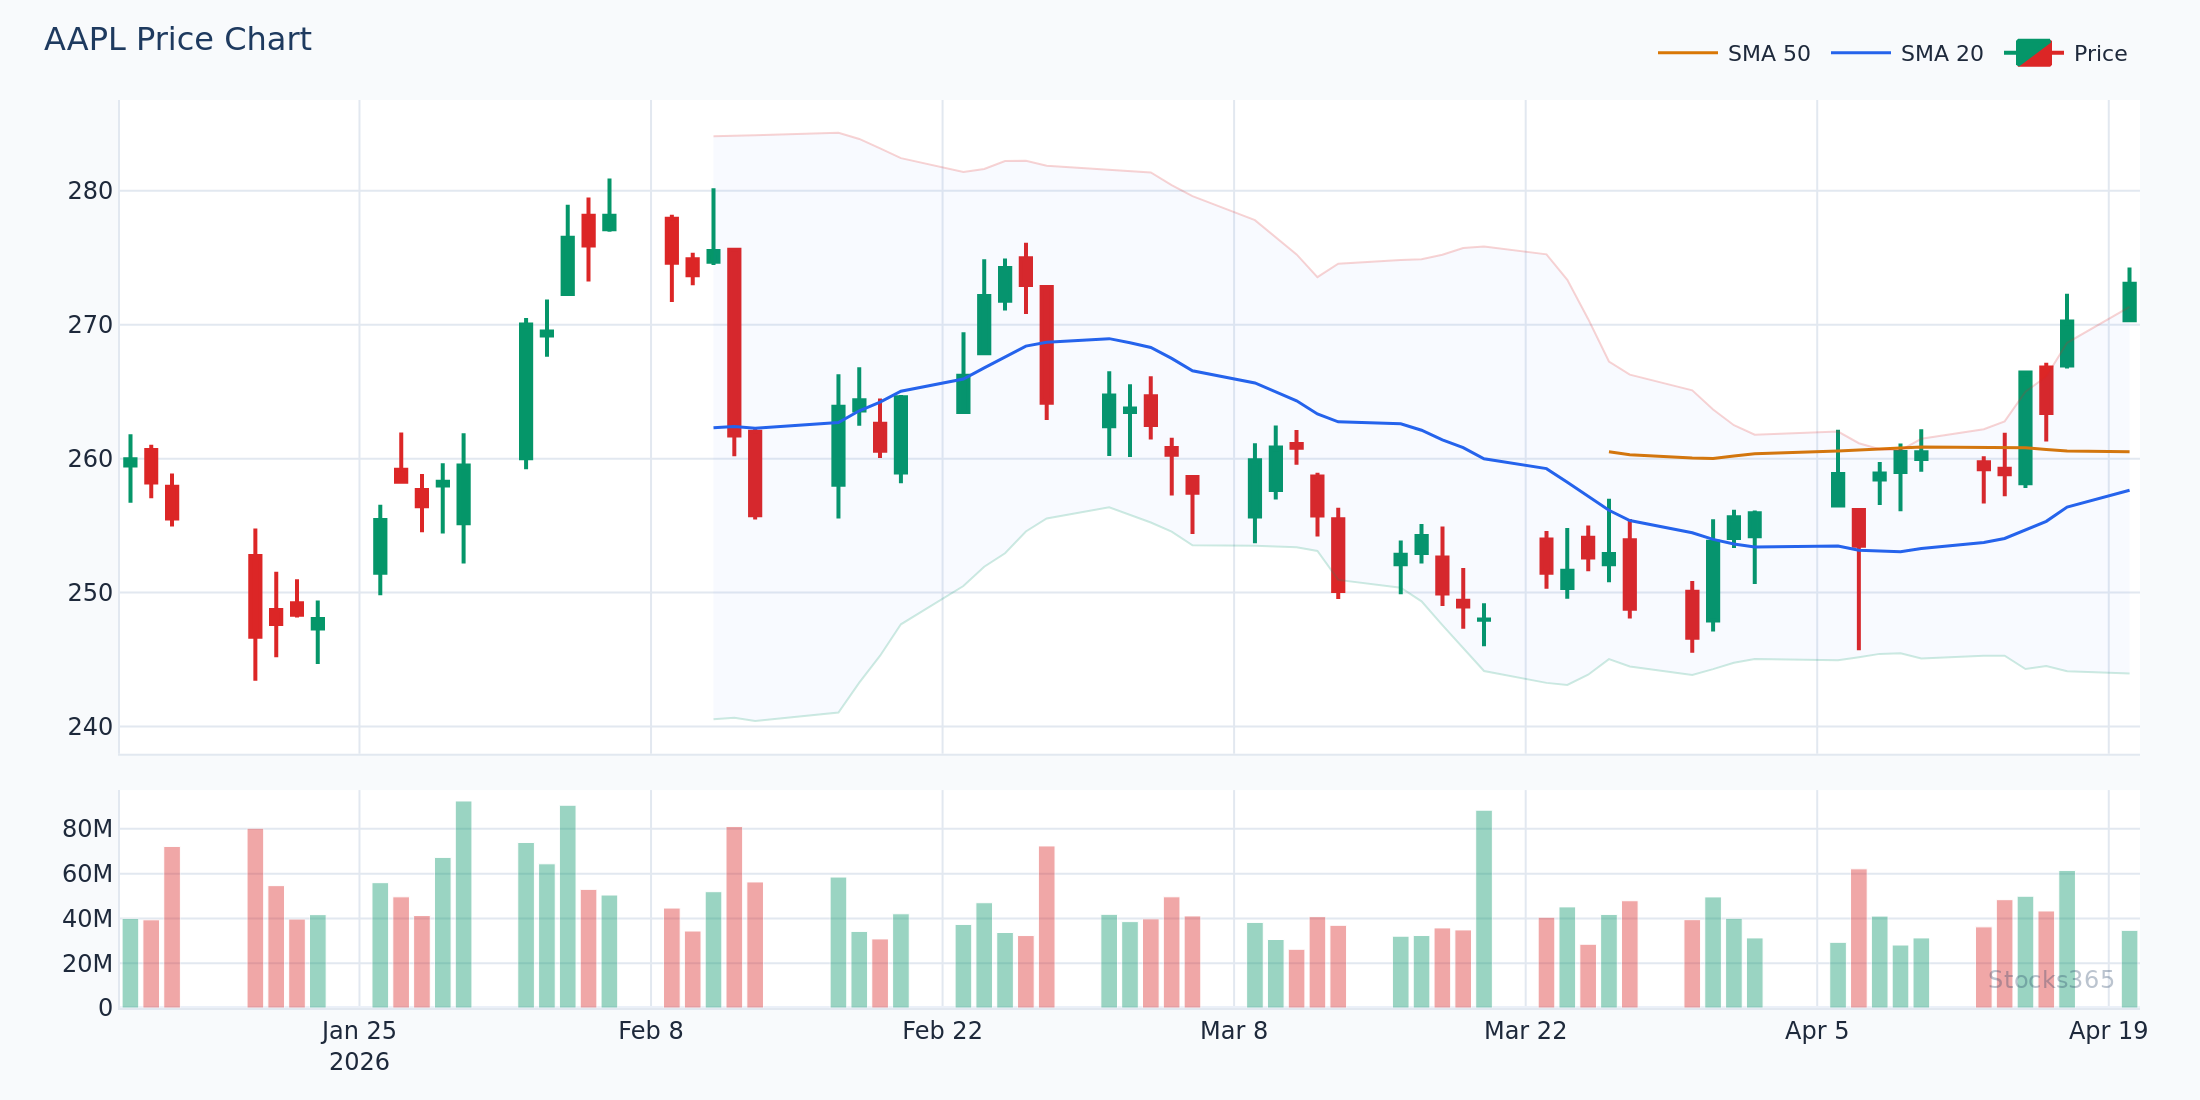
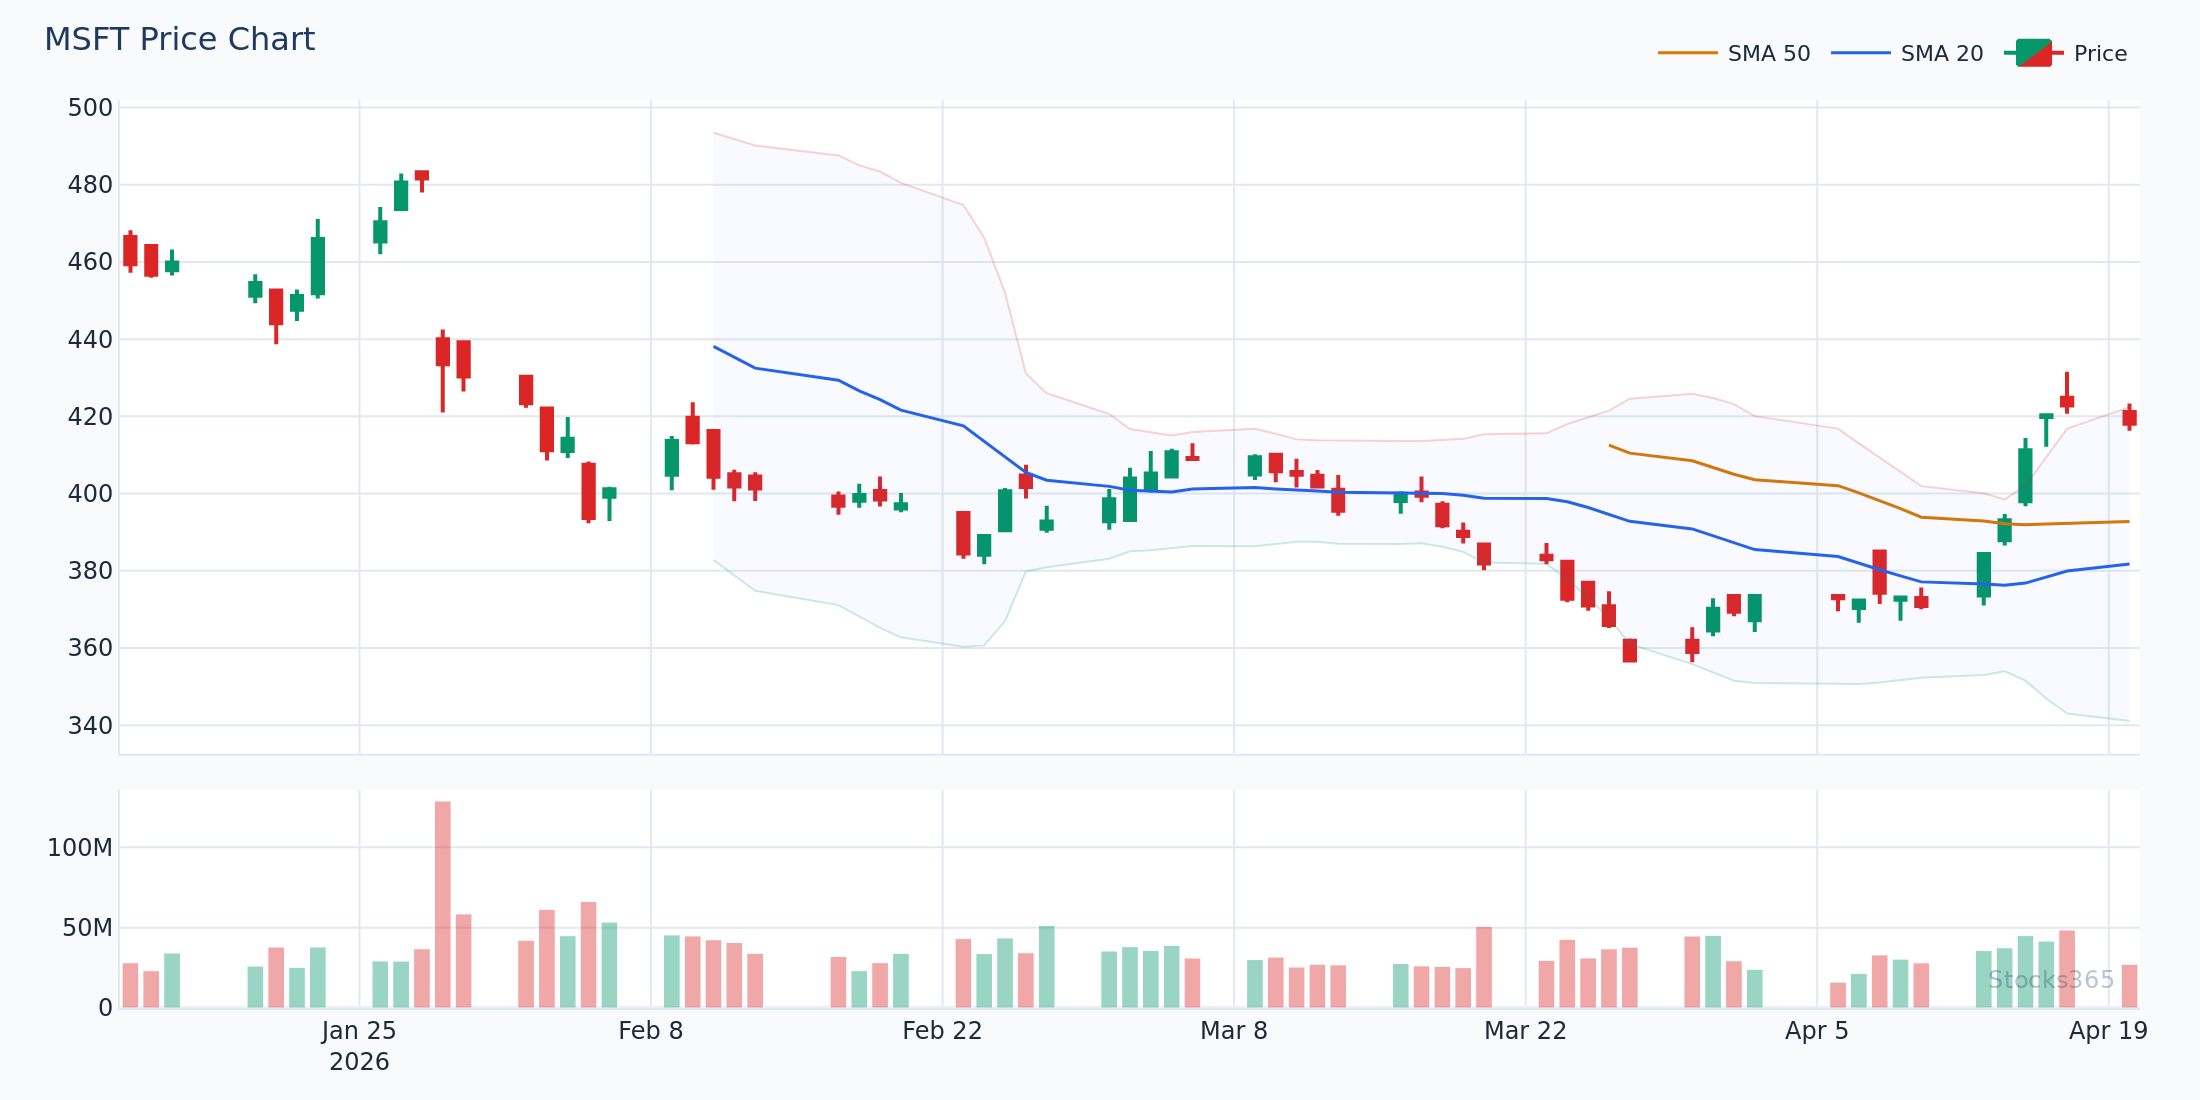
This chart shows the full structure of Bollinger Bands in action. Notice how the bands widen during volatile periods and squeeze tightly during consolidation phases. When price touches the upper band after a prolonged squeeze, watch for either a breakout continuation or a sharp mean reversion — the next candle's close relative to the band edge confirms which is occurring. A squeeze followed by a close outside the band on strong volume typically signals the breakout direction is real.
Bollinger Bands Quick Reference: Core Settings
Standard Settings (Default)
- Period: 20
- Standard Deviations: 2.0
- Moving Average Type: Simple (SMA)
- Best for: Swing trading, daily charts
Modified Settings by Trading Style
- Scalping / Short-term (5–15 min charts): Period 10, 1.5 SD
- Day trading (1-hour charts): Period 20, 2.0 SD
- Swing trading (daily charts): Period 20, 2.0 SD
- Position trading (weekly charts): Period 20, 2.5 SD
- High-volatility assets (crypto): Period 20, 2.5–3.0 SD
Crypto moves differently. Standard 2.0 SD settings get violated constantly. Widening to 2.5 or 3.0 SD keeps the bands meaningful in high-volatility environments.
The 5 Core Bollinger Bands Signals
1. The Squeeze — Low Volatility Precedes High Volatility
The Bollinger Squeeze occurs when the upper and lower bands contract to their narrowest point in weeks or months. Bandwidth — the distance between bands — drops to a multi-month low. This signals that a significant move is coming. The direction isn't known yet. That's the key nuance most traders miss.
Wait for the breakout candle. Don't guess direction before it happens.
The setup:
- Bandwidth drops below its 20th percentile (relative to the last 6 months)
- Price coils tightly around the 20-SMA
- Volume contracts alongside price — confirming compression
- Breakout triggers when price closes decisively outside the band on elevated volume
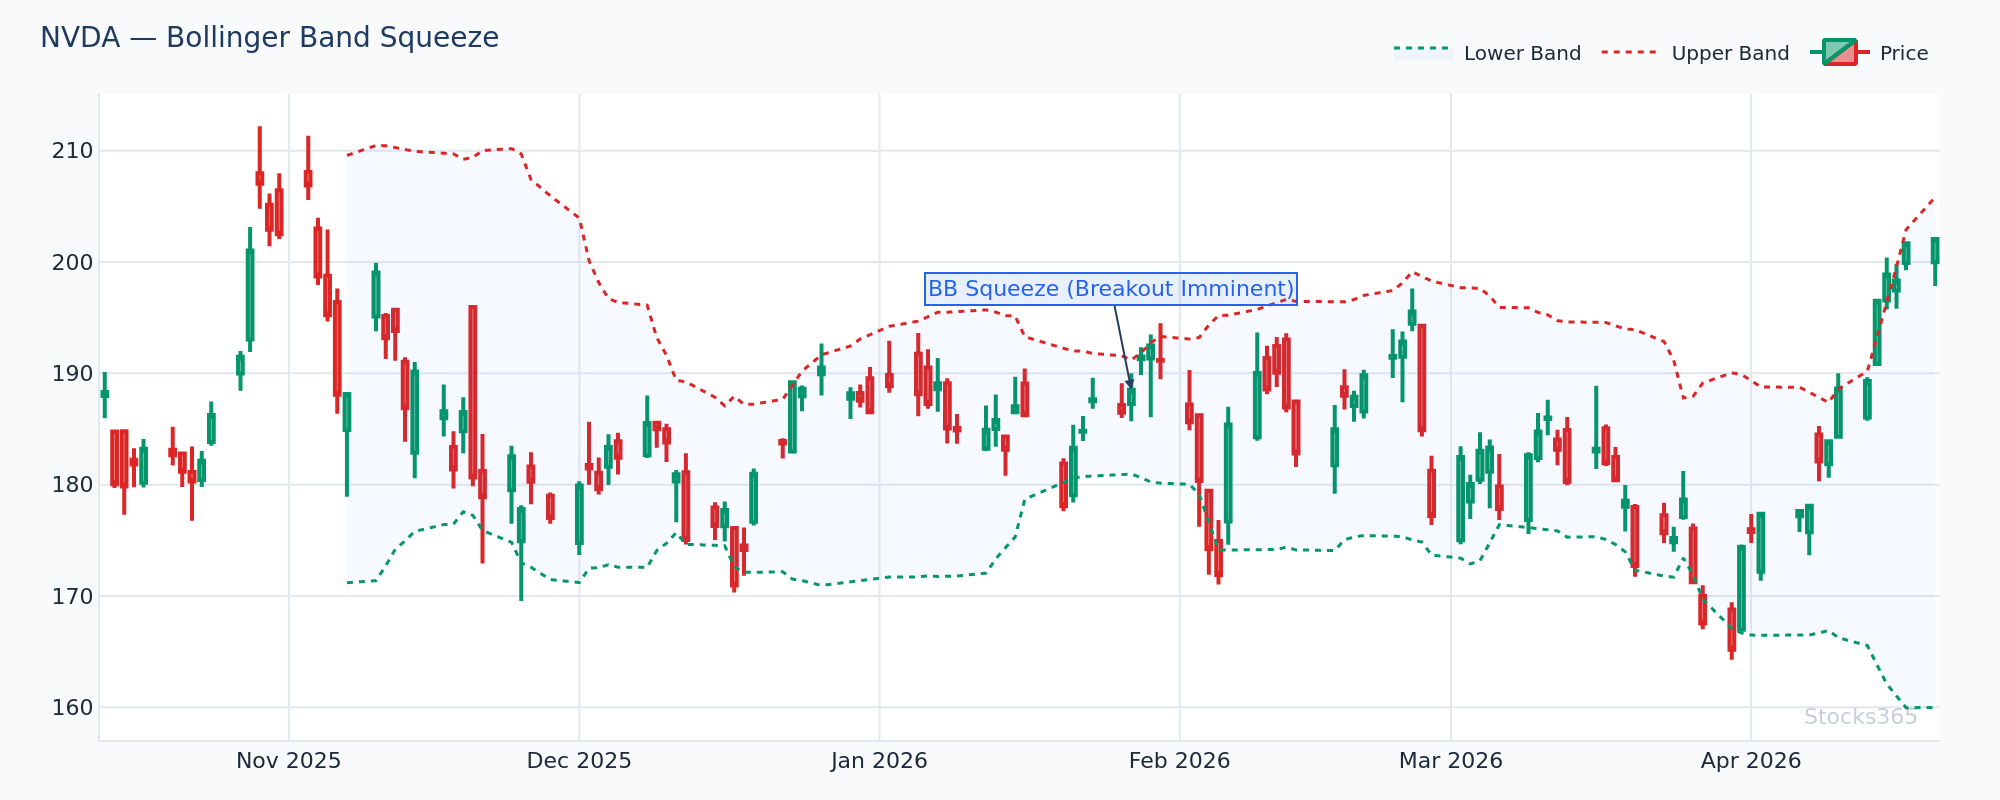
The squeeze shown here is the setup traders live for. Bands have contracted to near their tightest levels over the prior three months, and price is compressing around the 20-SMA. When this setup resolves, it typically does so with force — the expansion phase often produces a move of 2–3 ATR (Average True Range) in the breakout direction. Invalidation occurs if price breaks briefly then immediately reverses back inside the bands within 1–2 candles.
2. Upper Band Touch — Overbought Warning or Breakout Signal?
Price touching or piercing the upper band means one of two things: the asset is in a strong uptrend, or it's overextended. Context is everything here.
In a trending market, price can walk the upper band for days — touching it repeatedly as the trend accelerates. In a ranging market, an upper band touch is a fade signal.
Trend context check: Is the 20-SMA sloping upward? Is price making higher highs? Then upper band touches are continuation signals, not reversal triggers.
3. Lower Band Touch — Oversold Opportunity or Falling Knife?
Same logic applies in reverse. Lower band touches in downtrends mean the trend is strong — not that it's over. In ranging markets, a lower band touch with a bullish reversal candle (hammer, engulfing) is a high-probability bounce setup.
Confirm with volume. A lower band touch on declining volume is far stronger than one on expanding volume (which suggests panic selling continuation).
4. The %B Indicator — Precise Band Position Measurement
%B tells you exactly where price sits relative to the bands:
- %B = 1.0: Price is at the upper band
- %B = 0.5: Price is at the middle band (20-SMA)
- %B = 0.0: Price is at the lower band
- %B > 1.0: Price has broken above the upper band
- %B < 0.0: Price has broken below the lower band
%B above 0.8 combined with weakening momentum is a classic distribution warning. %B below 0.2 combined with a bullish divergence is a classic accumulation signal.
5. Mean Reversion — The Middle Band Pull
After price touches the upper or lower band, it has a natural tendency to revert toward the 20-SMA. This mean reversion principle is the foundation of many Bollinger Band trading strategies.
The middle band acts as a dynamic support/resistance level. In uptrends, pullbacks to the 20-SMA are buy opportunities. In downtrends, bounces to the 20-SMA are short opportunities.
Here's What Most Traders Get Wrong
Most traders treat an upper band touch as an automatic sell signal. They see price hit the upper band and immediately assume a reversal is imminent. In strongly trending markets, this thinking gets you killed.
During a genuine trend, price walks the upper band for extended periods. The 20-SMA keeps rising. Each pullback is shallow. Shorting every upper band touch in that environment means fighting the trend repeatedly — and losing. The real edge is waiting for the failure pattern: price touches the upper band, then the next candle closes back inside the band on expanded volume. That's the reversal signal. The touch alone means nothing without the follow-through confirmation.
Don't trade the touch. Trade the reaction.
Combining Bollinger Bands With Other Indicators
Bollinger Bands + RSI: The Classic Combo
Bollinger Bands measure volatility and price position. RSI measures momentum. Together, they create a multi-dimensional view of market conditions that neither provides alone.
The setup most traders use:
- Price touches lower Bollinger Band
- RSI drops below 30 (oversold)
- Bullish reversal candle forms at the band
- RSI begins turning upward from oversold territory
- Entry on the candle close above the low of the reversal candle
For the short setup, reverse all conditions. Price at upper band, RSI above 70, bearish reversal candle. The confluence matters — a single signal in isolation is weak. Two aligned signals are meaningful.
Adding RSI divergence to this setup makes it even stronger. When price makes a new low at the lower band but RSI makes a higher low, that divergence signals fading bearish momentum. Combined with a lower band touch, it's one of the cleaner setups available.
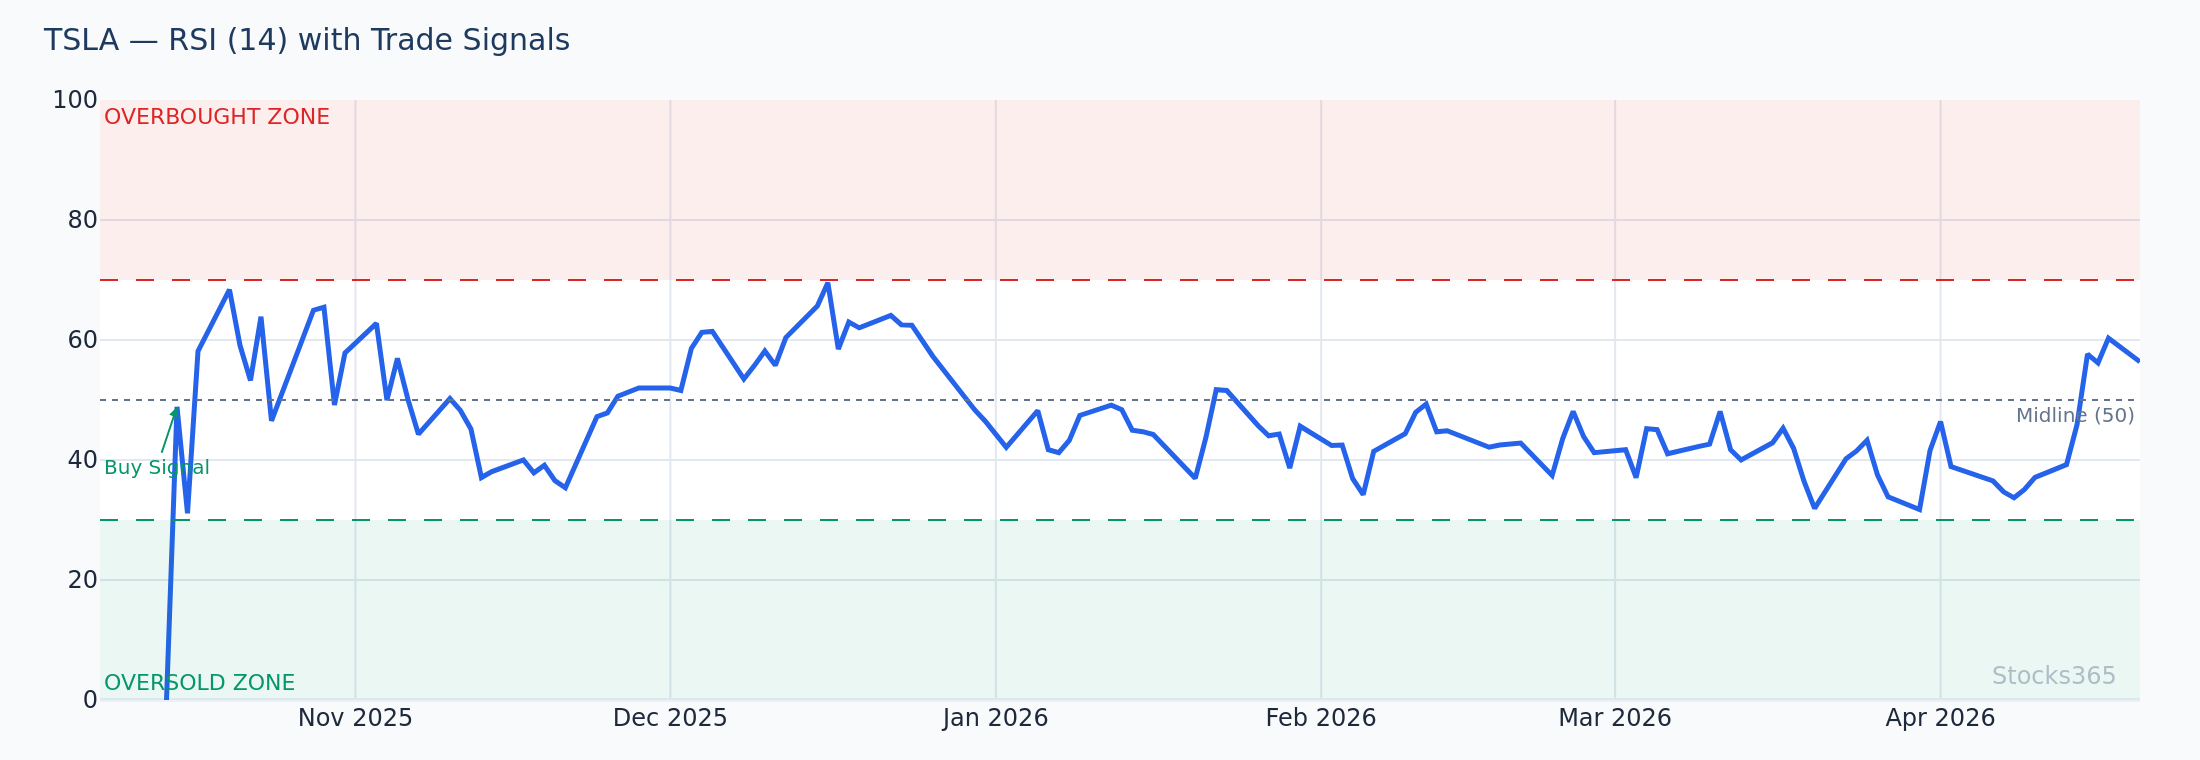
This chart illustrates the power of combining RSI with Bollinger Bands. Price is touching the lower band while RSI is showing a bullish divergence — higher lows in momentum while price makes lower lows. When the two signals align like this, the probability of a meaningful bounce increases significantly. Confirmation arrives when price closes back above the lower band and RSI crosses back above 30 — that double confirmation is the entry trigger, not the initial signal.
Bollinger Bands + Volume
Volume is the one indicator that validates everything else. A Bollinger squeeze breakout on 2x average volume is a completely different signal than the same breakout on below-average volume.
- Breakout on high volume: Trend continuation likely
- Breakout on low volume: False breakout risk — wait for confirmation
- Band touch on declining volume: Exhaustion move, reversal likely
- Band touch on surging volume: Momentum continuation signal
Bollinger Bands + Stochastic Oscillator
The Stochastic Oscillator adds another momentum layer. When price touches the upper band and Stochastic is above 80, the double overbought condition creates a mean reversion trade opportunity. The same applies in reverse at the lower band with Stochastic below 20.
For a deeper look at combining momentum oscillators, the comparison of RSI vs Stochastic breaks down which works better in different market conditions.
Bollinger Bands by Asset Class: What the Data Shows
Not all assets respond to Bollinger Band signals equally. The standard settings work across markets, but the signal quality varies significantly depending on what you're trading.
Our analysis of 14,266 Bollinger Squeeze Breakout signals found a profit factor of 1.03 across all asset classes — meaning squeeze breakouts are one of the more reliable Bollinger Band setups when measured at scale. Crypto led with a 51.8% win rate, while forex lagged at 47.1%. The squeeze works best in assets prone to explosive directional moves after consolidation — which is exactly what characterizes crypto markets. View the full dataset at Stocks365 Insights.
Asset class considerations at a glance:
- Equities: Standard 20-period, 2.0 SD settings work well on daily charts
- Crypto: Widen to 2.5–3.0 SD; squeeze setups show strongest edge
- Forex: Mean reversion setups work better than breakout setups in ranging pairs
- Commodities: Band touches are less reliable; combine with seasonal factors
- ETFs: Broader bands (2.5 SD) filter out noise in diversified instruments
The Bollinger Band Walk — Reading Trend Strength
One of the most underappreciated Bollinger Band concepts is the band walk. During strong trends, price doesn't just touch the band — it walks along it for multiple candles.
Identifying a band walk:
- Three or more consecutive candle closes at or above the upper band
- The 20-SMA is clearly sloping in the trend direction
- Pullbacks are shallow — price stays above the 20-SMA during corrections
- Volume remains elevated throughout
When you see a band walk, the trade isn't the reversal. The trade is buying the pullback to the 20-SMA. That's the trend-following mindset Bollinger Bands reward.
This chart demonstrates a textbook upper band walk during a trending phase. Price closes at or near the upper band across multiple consecutive sessions while the 20-SMA continues to slope upward — confirming trend health. The optimal entry in this environment isn't at the upper band touch but rather on the pullback toward the 20-SMA, where risk-reward improves significantly. The band walk ends when price closes below the 20-SMA on above-average volume, which signals a potential regime change.
Bollinger Bands Cheat Sheet: Signal Summary Table
Quick reference for every major setup:
- Squeeze (bandwidth at multi-month low): Prepare for breakout — direction TBD
- Squeeze breakout above upper band + high volume: Bullish continuation
- Squeeze breakout below lower band + high volume: Bearish continuation
- Upper band touch in uptrend: Continuation — don't fade the trend
- Upper band touch in range: Short setup — watch for reversal candle
- Lower band touch in downtrend: Continuation — don't buy the dip blindly
- Lower band touch in range: Long setup — watch for reversal candle
- %B crosses above 0.5 from below: Momentum shifting bullish
- %B crosses below 0.5 from above: Momentum shifting bearish
- Price closes back inside bands after breakout: False breakout — reverse
- Band walk (3+ closes at upper band): Strong uptrend — buy pullbacks to 20-SMA
- Band walk (3+ closes at lower band): Strong downtrend — sell bounces to 20-SMA
Common Bollinger Bands Mistakes to Avoid
Mistake 1: Using Bands in Isolation
Bollinger Bands are context tools, not standalone signal generators. Always confirm signals with at least one additional indicator — volume, RSI, or price action patterns. A band touch with no confirmation is just a data point.
Mistake 2: Ignoring the Trend Direction
Mean reversion setups fail in trending markets. Before fading a band touch, identify the prevailing trend. The 20-SMA slope tells you everything — upward slope means trade long, downward slope means trade short, flat slope means range-trading rules apply.
Mistake 3: Over-Optimizing Settings
Changing settings on every asset to maximize backtested performance is curve fitting. Stick to standard settings (20, 2.0) for most markets and only adjust for structurally different assets like high-volatility crypto. Consistency beats over-optimization.
Mistake 4: Treating Every Squeeze as a Major Breakout
Not every squeeze leads to a massive move. Some squeezes resolve with modest 1-ATR moves. Size positions according to the volatility environment, not the hope of a massive expansion. Let the market show you the magnitude — don't pre-assume it.
If you want to deepen your understanding of momentum divergence signals that complement Bollinger Band setups, hidden RSI divergence is one of the most underused confirmation tools available.
What to Watch For
- Bollinger squeeze setups on tech stocks and crypto: When bandwidth drops below its 20th percentile relative to the prior six months and price coils around the 20-SMA, the next breakout candle on elevated volume often signals a 2–3 ATR expansion. These are the highest-conviction setups the indicator produces.
- Lower band touches after a multi-week downtrend with RSI bullish divergence: When price prints a new low at the lower band but RSI fails to confirm the new low, the divergence combined with the band touch creates a high-probability mean reversion setup. Confirm with a bullish reversal candle before entry.
- Upper band walks on large-cap equities during earnings season: When price walks the upper band across three or more sessions with the 20-SMA rising, avoid the short. Instead, watch for the first pullback to the 20-SMA as the optimal re-entry for trend continuation.
- False breakouts after squeezes: Price breaks above the upper band on a squeeze, then closes back inside within two candles. This failure pattern is a high-probability reversal signal in the opposite direction — especially when volume was below average on the initial break.
- Crypto squeeze breakouts when bandwidth compresses to six-month lows: Crypto assets show the strongest squeeze breakout characteristics of any asset class. When bandwidth reaches extreme compression on a major crypto asset, the subsequent expansion tends to be more decisive and sustained than in equities or forex.
How Stocks365 Uses This
Stocks365 Trust Score Integration
Bollinger Band signals are one of 12+ indicators integrated into the Stocks365 Trust Score system. Specifically, Bollinger Band positioning contributes to the volatility regime scoring and signal agreement layers within the Trust Score framework.
When a Bollinger Squeeze precedes a breakout signal, the Trust Score weights that signal differently than a random band touch — recognizing the structural compression that preceded it. Band position (%B) feeds into the agreement scoring: signals with multiple indicators aligned (for example, lower band touch + RSI oversold + bullish volume divergence) receive a higher Trust Score than single-indicator signals.
You can see live Bollinger Band signal data across thousands of instruments on the Stocks365 Signals Dashboard, and individual asset setups such as AAPL signals show real-time band positioning alongside the full Trust Score breakdown. Stocks365 research across 3,255 upper band touch signals found a win rate of 49.6% and a profit factor of 0.88 over a 10-day holding period — confirming that upper band touches alone are marginal edges, which is precisely why the Trust Score requires multi-indicator confluence before elevating signal confidence. See the complete dataset at Stocks365 Insights.
Key Takeaways
Bollinger Bands Cheat Sheet — Quick Summary
- Bollinger Bands use a 20-SMA center with upper and lower bands at 2 standard deviations — standard settings work for most markets
- The Squeeze (bandwidth compression) is the highest-probability setup — wait for the confirmed breakout candle before entering
- Upper and lower band touches are context-dependent — trend direction determines whether to trade continuation or reversal
- Band walks signal strong trends — trade pullbacks to the 20-SMA, not the band touch itself
- Combine with RSI, volume, and candlestick patterns for confirmation — band signals alone carry limited edge
- Crypto responds strongest to squeeze breakouts; forex responds better to mean reversion setups
- False breakouts (price closes back inside the band after breaking out) are high-probability reversal signals
- %B precisely measures where price sits within the bands — use it to quantify overbought/oversold conditions
Frequently Asked Questions
What are the best Bollinger Bands settings for day trading?
For day trading on 1-hour charts, the standard 20-period, 2.0 standard deviation settings work well. For shorter timeframes like 5–15 minute charts, reduce the period to 10 and lower the standard deviation to 1.5 to keep the bands responsive to faster price action. Avoid over-optimizing settings for specific assets — consistency across settings builds more reliable pattern recognition over time.
How reliable is the Bollinger Squeeze as a trading signal?
The squeeze is one of the more statistically supported Bollinger Band setups. The key is waiting for the confirmed breakout direction rather than trying to predict it during compression. Volume confirmation on the breakout candle significantly improves the signal's reliability. Squeezes that resolve on above-average volume in a clear direction tend to produce more sustained moves than those that break out on weak volume.
Can Bollinger Bands be used on all timeframes?
Yes. Bollinger Bands work across all timeframes from 1-minute charts to monthly charts. The signals they generate are most reliable on higher timeframes (daily and above) because shorter timeframes contain more noise. When using Bollinger Bands on intraday charts, always align your analysis with the higher-timeframe trend — a lower band touch on a 15-minute chart carries more weight if the daily chart is in an uptrend.
What's the difference between Bollinger Bands and Keltner Channels?
Bollinger Bands use standard deviation to set band width, making them volatility-responsive. Keltner Channels use Average True Range (ATR), making them smoother and less reactive to sudden volatility spikes. Many traders use both together — when Bollinger Bands contract inside Keltner Channels, it signals an extreme squeeze (sometimes called a "Squeeze Pro" setup) that often precedes significant moves.
Should I combine Bollinger Bands with RSI for better signals?
Combining Bollinger Bands with RSI is one of the most effective pairings in technical analysis. Bollinger Bands identify price position and volatility; RSI identifies momentum strength. When both align — for example, a lower band touch coinciding with RSI below 30 and turning upward — the signal quality improves substantially compared to either indicator used alone. For more on how RSI is calculated and why it complements price-based indicators, the underlying math explains the complementary nature of the two tools.