
What Are Bollinger Bands? Understanding the Basics
Bollinger Bands are one of the most widely used technical indicators in trading. Developed by John Bollinger in the 1980s, they give traders a dynamic view of price volatility — expanding when markets are wild, contracting when they go quiet. The concept is simple. The execution, less so.
At their core, Bollinger Bands consist of three lines plotted directly on a price chart:
- Middle Band: A 20-period Simple Moving Average (SMA) of closing prices
- Upper Band: The middle band plus two standard deviations
- Lower Band: The middle band minus two standard deviations
That middle band is the anchor. The upper and lower bands stretch and compress based on how volatile price action is over the lookback period. When volatility spikes, the bands widen. When price consolidates, the bands tighten into what traders call a squeeze.
Our analysis of 14,266 Bollinger Squeeze Breakout signals across multiple asset classes shows a profit factor of 1.03 — meaning this is one of the few Bollinger Band setups that edges into positive expected value territory over a 10-day holding period. That matters. Most retail traders never dig this deep into the numbers. You can explore the full methodology on our research dashboard.
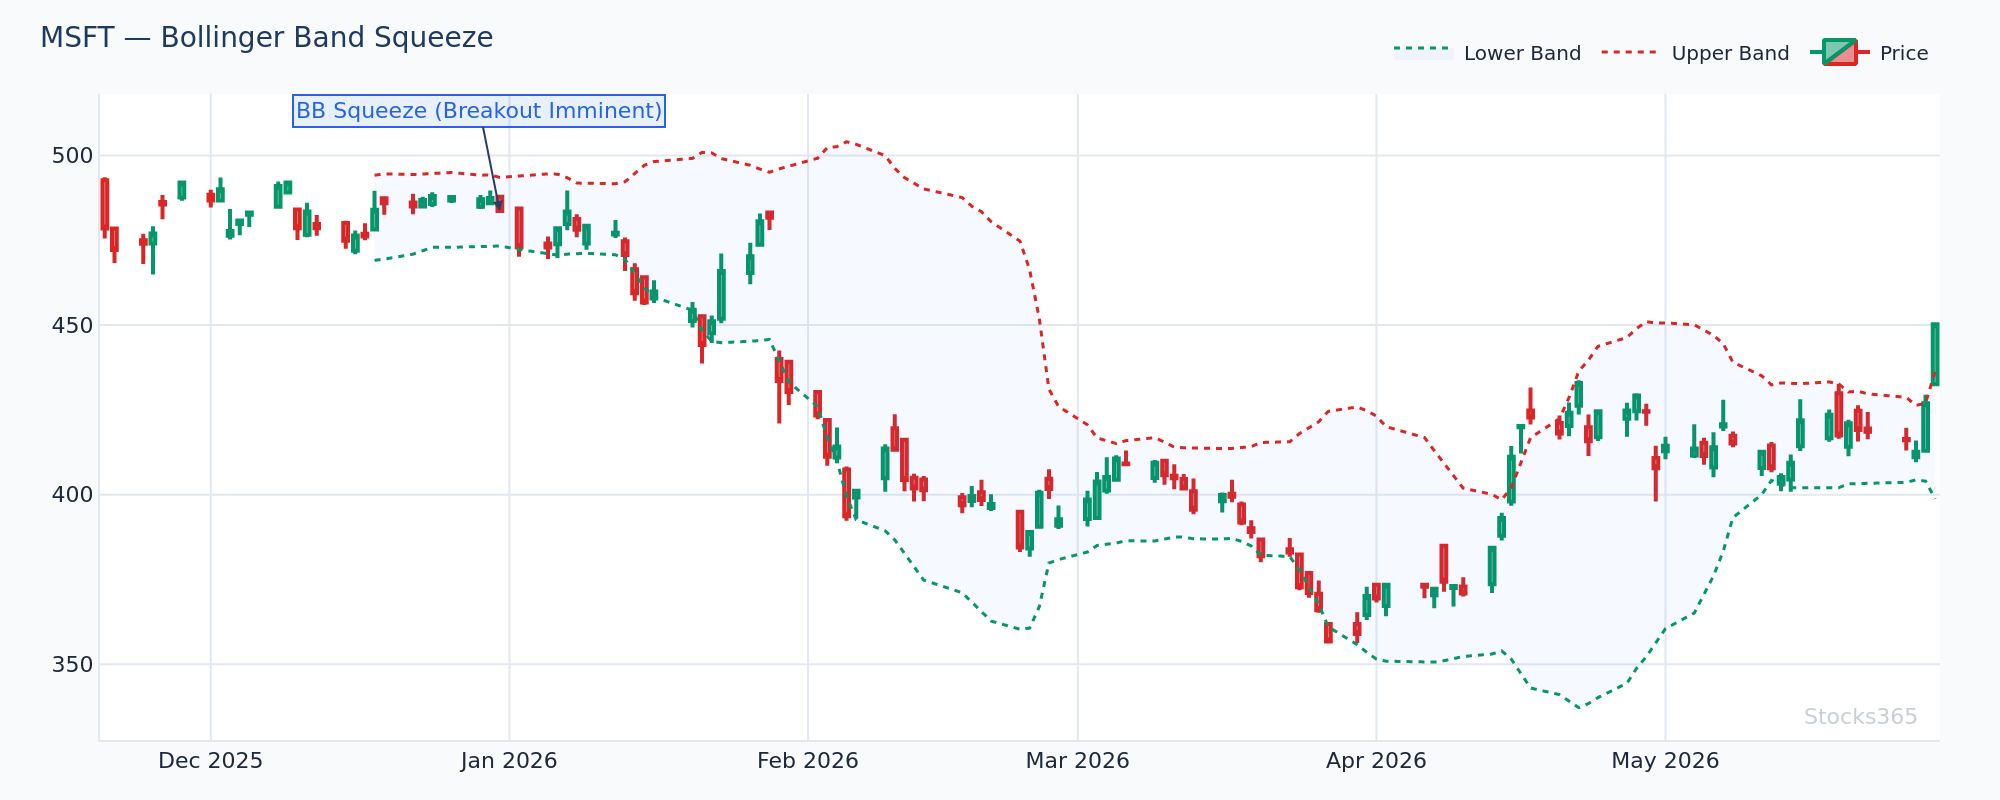
This chart shows MSFT's bands narrowing significantly, with price coiling inside a tight range. When band width compresses to multi-month lows, the market is building pressure. A decisive close above the upper band — especially on expanding volume — typically confirms the breakout direction. A false break that reverses back inside the bands within one to two candles invalidates the setup.
How Bollinger Bands Are Calculated
You don't need to calculate this manually — every modern charting platform does it for you. But understanding the math makes you a better trader.
The Formula
The standard setup uses a 20-period SMA as the middle band. Standard deviation measures how spread out price has been from that average. Multiply that by 2, add it to the SMA for the upper band, subtract it for the lower band. That's it.
The default settings — 20 periods, 2 standard deviations — capture approximately 95% of price action within the bands under normal market conditions. Roughly 5% of price moves pierce the outer bands. Those extremes are where traders focus their attention.
Most platforms let you adjust the period and standard deviation multiplier. Shorter periods (like 10) make the bands more reactive. Wider multipliers (like 2.5) create wider bands that price breaks through less often. For beginners, stick with the defaults until you understand what you're changing and why.
Reading Bollinger Bands: What Each Part Tells You
The Squeeze: The Calm Before the Storm
The Bollinger Squeeze is the setup most experienced traders watch for. When the bands compress — band width dropping to its lowest levels in months — it signals that volatility has collapsed. Markets don't stay quiet forever. The squeeze is a coiled spring.
The breakout direction isn't guaranteed by the squeeze itself. That's where confirmation matters. Watch for price to close convincingly beyond either band, with volume surging above the 20-day average. A weak, low-volume break is noise. A strong, high-volume break is signal.
For a deeper look at how moving averages interact with this kind of trend confirmation, read our guide on the Triple Moving Average Strategy for Trend Confirmation.
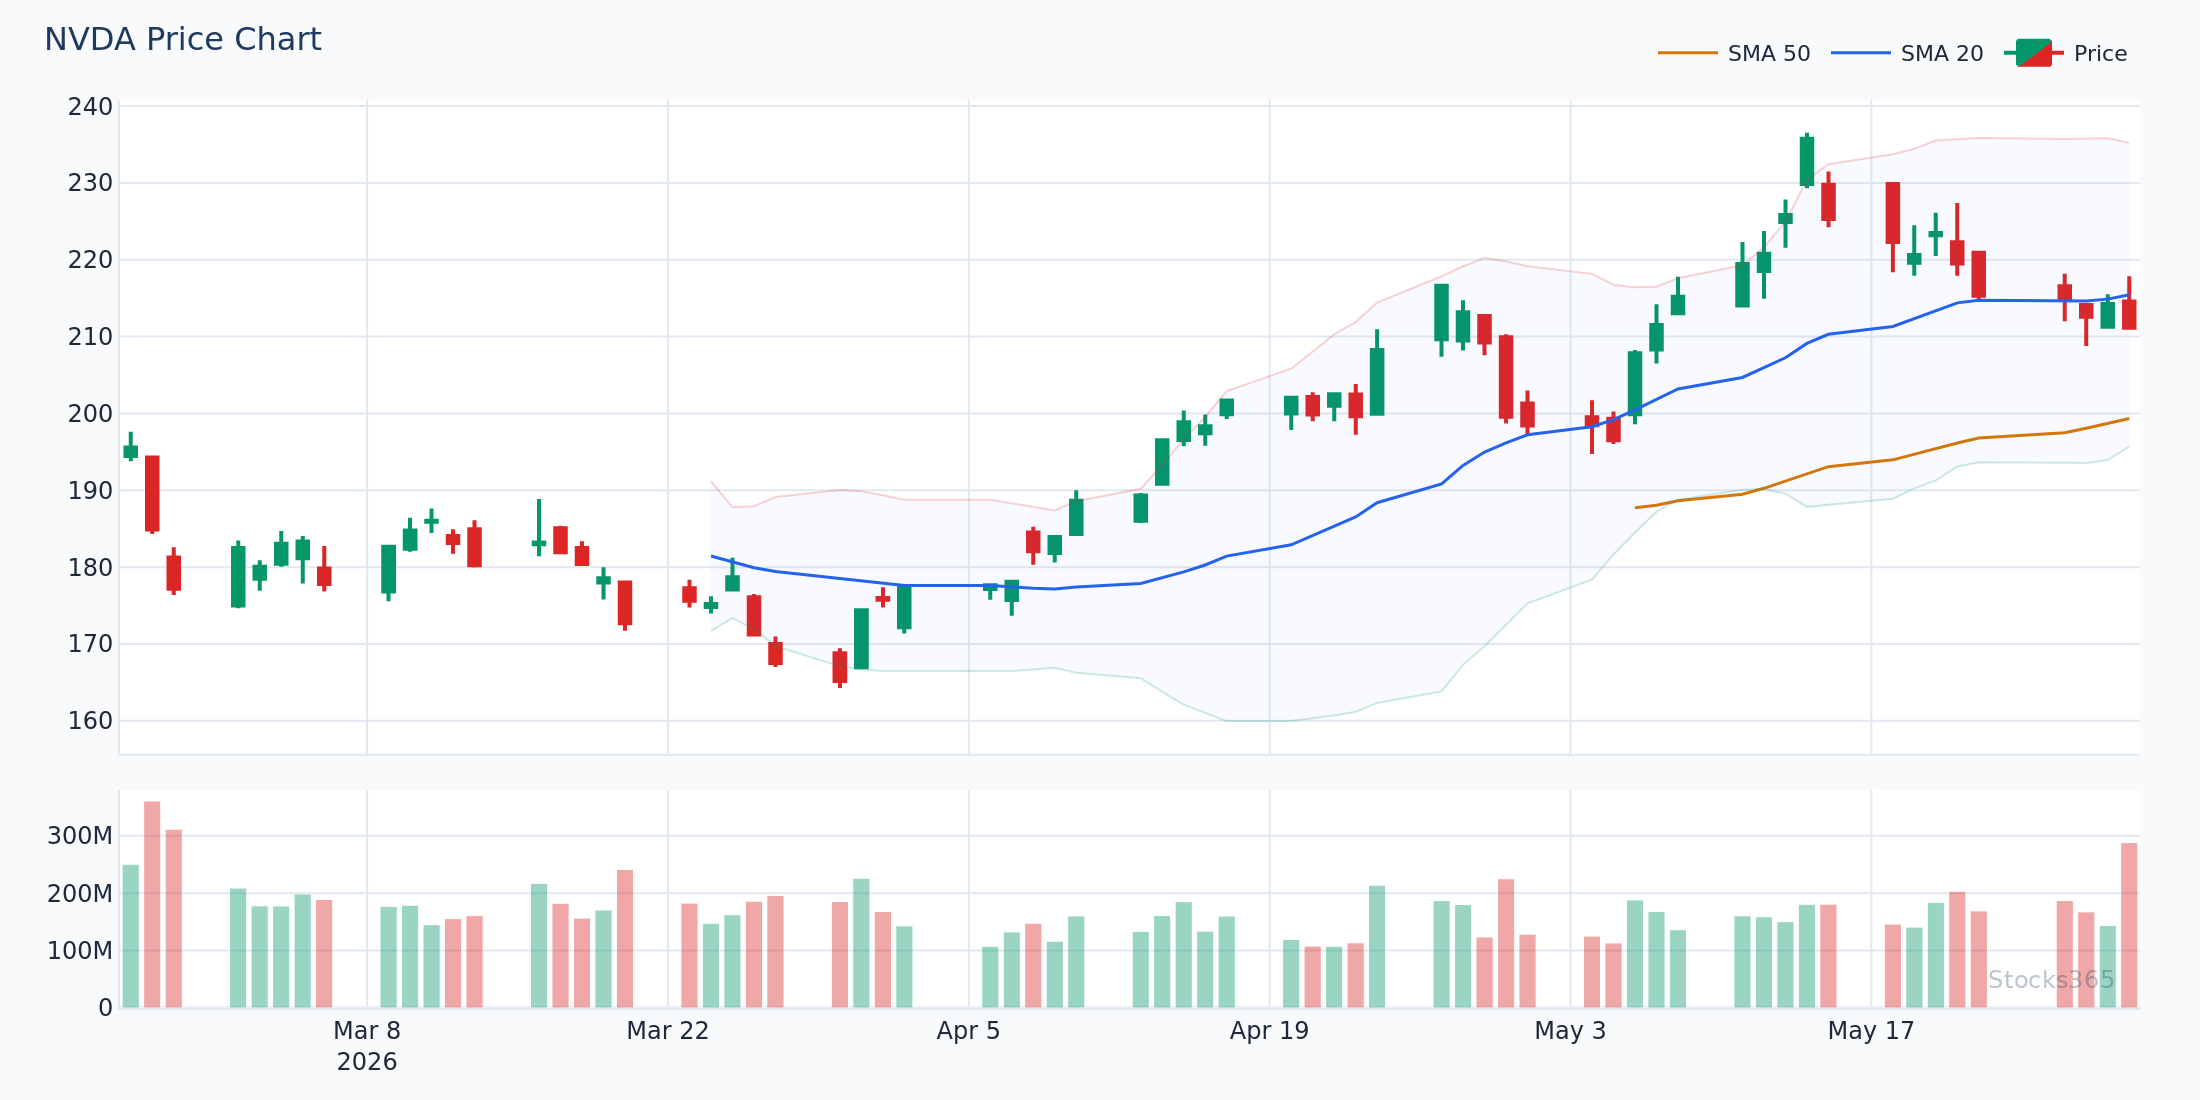
This NVDA chart illustrates the full squeeze-to-expansion cycle. The bands narrow for several weeks as price chops sideways, then a high-volume candle drives price through the upper band. The middle band (20-SMA) begins sloping upward — a secondary confirmation. If price pulls back to retest the middle band and holds, that's your entry trigger.
Upper and Lower Band Touches: Not What You Think
Here's what most traders get wrong: touching the upper band is not automatically a sell signal. In a strong trending market, price can walk the upper band for days — even weeks — closing above it repeatedly while momentum continues. Treating every upper band touch as overbought is how traders get stopped out of the best trends early.
The real signal is what happens after the touch. A single wick to the upper band that immediately reverses, combined with a bearish candlestick pattern and weakening RSI, is meaningful. A clean close above the upper band with expanding volume is continuation. Context is everything.
Our backtesting confirms this nuance. Across 3,255 upper band touch signals, the raw win rate sits at just 49.6% with a profit factor of 0.88 over a 10-day holding period — a negative edge when traded mechanically. The setup works best in crypto (56.7% win rate) and worst in commodities (41.5%). The lesson: asset class context changes the odds dramatically.
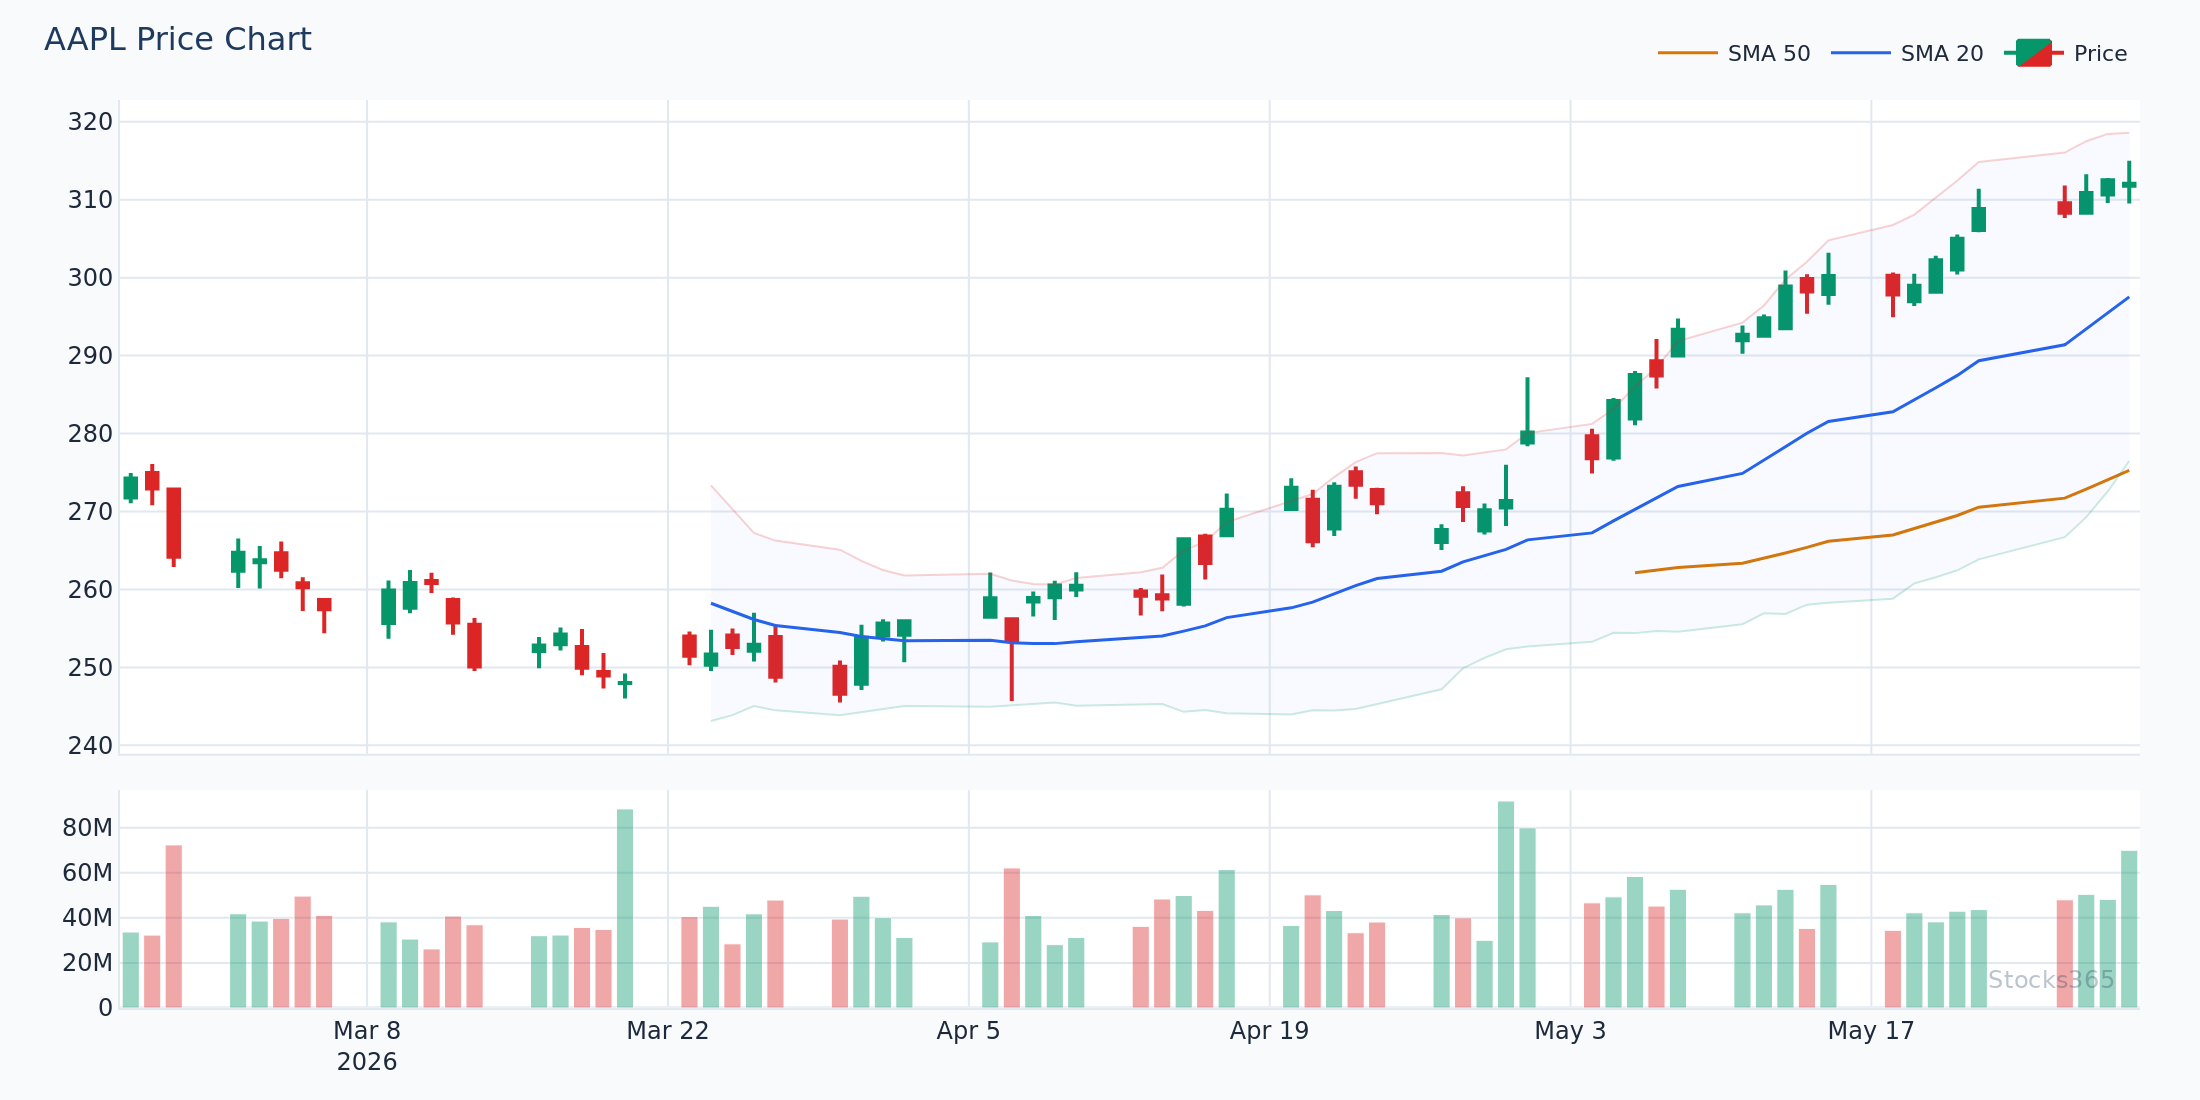
This AAPL chart shows two distinct scenarios at the upper band: one where price walks the band higher through multiple sessions, and one where a single wick reversal signals exhaustion. The difference is volume and follow-through. Sustained closes above the band with rising volume confirm the band walk; a sharp rejection candle on declining volume suggests a mean reversion toward the middle band is likely.
The Middle Band: The Most Underrated Line on the Chart
Most beginners obsess over the outer bands and ignore the middle. That's a mistake. The 20-SMA middle band acts as dynamic support in uptrends and dynamic resistance in downtrends. Price repeatedly bouncing off the middle band in an uptrend is one of the cleanest continuation patterns in technical analysis.
When price breaks and closes below the middle band during an uptrend, that's the first warning sign — not a sell signal by itself, but a reason to tighten stops and reduce conviction. For more on how moving averages function as dynamic support and resistance, see our data-driven breakdown: Do Moving Averages Actually Work?
Bollinger Bands Trading Strategies
Strategy 1: The Squeeze Breakout
This is the highest-probability Bollinger Band setup in our backtested data. The mechanics:
- Band width drops to the lowest level in the past 6 months (use the Bollinger Band Width indicator to track this objectively)
- Price consolidates in a tight range near the middle band
- A breakout candle closes beyond either outer band with volume at least 1.5x the 20-day average
- The middle band begins sloping in the direction of the breakout
Entry: on the close of the breakout candle, or on a retest of the breakout level. Stop: below the recent consolidation low (for long entries). Target: initial move of 2-3 ATR from the breakout point is common in expansion phases.
Strategy 2: Mean Reversion to the Middle Band
In range-bound or mildly trending markets, price tends to revert from the outer bands toward the middle. The setup:
- Price reaches the lower band with a wick or reversal candle
- RSI simultaneously shows oversold conditions (below 30) or positive divergence
- A bullish confirmation candle forms — engulfing, hammer, or strong close off the lows
- Target: middle band reversion, with a secondary target at the upper band
This works cleanly on high-liquidity large-caps and indices. It fails consistently in strong downtrends — where price crawls the lower band just as it can walk the upper band in uptrends. Pair it with trend context before fading a move. Our RSI Trendline Strategy pairs exceptionally well with this setup for confirmation timing.
Strategy 3: Double Confirmation with Stochastic
Combining Bollinger Band touches with the Stochastic Oscillator is a popular approach to improve signal quality. When price touches the upper band AND the Stochastic is in overbought territory (above 80), both indicators are flagging potential exhaustion simultaneously.
Sounds compelling. The data tells a more complicated story. Across 3,026 BB + Stochastic double overbought signals, the win rate is 49.9% with a profit factor of 0.91 — marginal negative edge overall. Crypto again shows the best results at 58.0%; commodities are the weakest at 40.7%. This combination works in crypto, struggles everywhere else.
For a thorough walkthrough of the Stochastic Oscillator on its own merits, read: How to Read the Stochastic Oscillator: Step-by-Step.
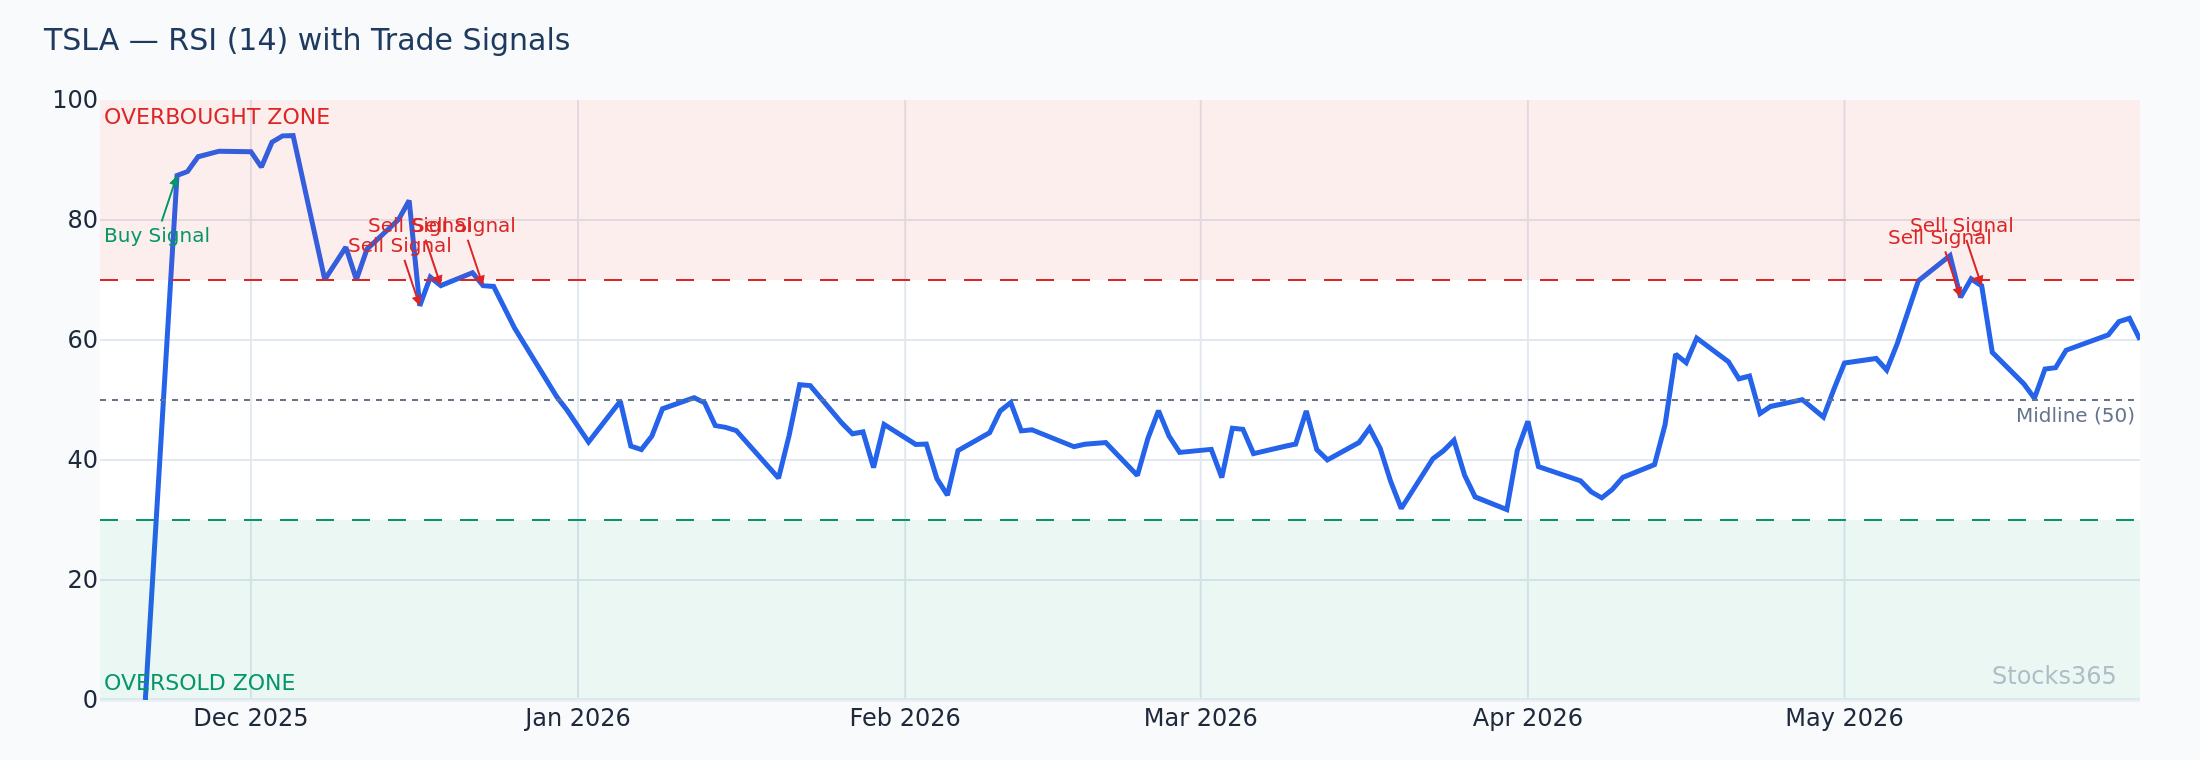
This TSLA chart combines the upper Bollinger Band with RSI divergence — price makes a higher high at the band while RSI makes a lower high. That divergence is the tell. When the confirmation candle closes back below the upper band following that divergence pattern, the mean reversion setup is active. The setup is invalidated if price closes above the prior high with RSI confirming.
Bollinger Bands Across Different Markets
Stocks
Bollinger Bands work well on high-liquidity individual stocks and broad indices. Squeeze breakouts on large-cap tech names — particularly during earnings-driven volatility compression periods — have historically produced clean directional moves. For a deep dive into a real-world case study, read our Bollinger Bands Case Study: Apple Stock Decoded.
Forex
Forex markets are mean-reverting by nature — major pairs rarely trend as persistently as individual growth stocks. That makes the mean reversion strategies more applicable in forex. The squeeze breakout, however, shows its weakest performance in forex (47.1% win rate in our data), likely because currency pairs frequently produce false breakouts before reversing. Pairing with MACD for momentum confirmation helps filter noise. See: MACD in Forex Trading: Master Currency Pair Strategies.
Crypto
Crypto is the standout. Across every Bollinger Band signal type in our research, crypto consistently shows the highest win rates — squeeze breakouts at 51.8%, upper band touches at 56.7%, double overbought at 58.0%. The reason is structural: crypto markets exhibit stronger trend persistence and more dramatic volatility expansions after squeezes. The bands were essentially built for this kind of behavior.
Commodities
Avoid mechanical Bollinger Band strategies in commodities. Every setup type shows negative edge, with upper band touches bottoming out at 41.5% win rate. Commodities are driven by supply shocks, geopolitical catalysts, and seasonal factors that technical indicators struggle to capture. Use Bollinger Bands as context in commodities — not as entry triggers.
Bollinger Bands vs. Other Volatility Indicators
Bollinger Bands aren't the only volatility tool. The Volume-Weighted Moving Average (VWMA) offers a different lens — weighting the moving average by volume to show where the real institutional interest lies. The two tools complement each other well: Bollinger Bands define the volatility envelope, VWMA identifies the true fair value anchor.
For trend-based signals, combining Bollinger Bands with the Golden Cross or Death Cross framework helps confirm whether a squeeze breakout is occurring in a bullish or bearish macro regime — which dramatically affects how you manage the trade.
Common Bollinger Bands Mistakes
Beginner traders make the same errors repeatedly. Here are the ones that cost the most:
- Trading the band touch alone: A price touching the upper or lower band without confirmation is not a signal. It's an observation. The confirmation — reversal candle, volume shift, momentum divergence — is the actual entry trigger.
- Ignoring the trend: Mean reversion works in choppy markets. In strong trends, it gets you run over. Always establish the broader trend context before fading a band touch.
- Overcomplicating it: Adding five indicators on top of Bollinger Bands doesn't improve results — it creates analysis paralysis. One confirmation is usually enough.
- Changing settings constantly: Optimizing the period or standard deviation to fit historical data is curve-fitting. Default settings (20, 2) exist because they work across a broad range of conditions.
Ignore the noise. Focus on the setup.
What to Watch For
- Squeeze setups on large-cap tech during low-volatility periods: When band width drops below the 20th percentile of its 6-month range on a stock like AAPL, MSFT, or GOOGL, watch for a directional breakout. The subsequent expansion phase often produces a 2–3 ATR move within 10 trading days.
- Crypto squeeze breakouts with volume confirmation: In crypto, a Bollinger Squeeze breakout accompanied by volume surging above 2x the 20-day average has a meaningfully higher follow-through rate than low-volume breaks. Wait for the volume to confirm before committing.
- Middle band rejections in established uptrends: When a stock in a clear uptrend (price above a rising 50-SMA) pulls back to touch the middle Bollinger Band (20-SMA) and bounces, that's a continuation pattern. Multiple successful middle band bounces in sequence signal strong trend health.
- RSI divergence at the upper band in forex: When EUR/USD or GBP/USD touches the upper Bollinger Band while RSI shows a lower high relative to the previous upper band touch, the divergence setup is active. This combination in forex has historically preceded near-term consolidation or reversal.
- Avoid band touch signals in commodities without macro catalyst: Given the 41.5% win rate on upper band touches in commodities, only act on these setups if there's a clear macro or supply/demand catalyst driving the move — pure technical signals in commodities have weak historical edge.
How Stocks365 Uses This
📊 How Stocks365 Integrates Bollinger Bands
Bollinger Bands are one of 12+ indicators that feed into the Stocks365 Trust Score system. Specifically, Bollinger Band signals contribute to two scoring dimensions:
- Volatility Regime Scoring: Band width percentile rankings help Stocks365 classify whether a signal is occurring in a high-volatility or low-volatility regime — context that directly affects signal confidence weighting.
- Agreement Scoring: When a Bollinger Band squeeze breakout aligns with directional signals from momentum indicators (MACD, RSI) and volume-based tools, the Trust Score increases — reflecting multi-indicator confluence rather than a single trigger.
This is why two signals with identical Bollinger Band setups can have different Trust Scores. The band tells part of the story. The full score requires agreement across the system.
You can see Trust Scores in action on any live signal — for example, check the AAPL signal page or browse all active signals on the Stocks365 signals dashboard.
Key Takeaways
📌 Bollinger Bands: Key Takeaways
- Bollinger Bands consist of a 20-SMA middle band plus upper and lower bands set 2 standard deviations away
- The Bollinger Squeeze signals compressed volatility and potential breakout — the highest-edge setup in our backtested data
- Upper band touches are not automatic sell signals — in trending markets, price walks the band repeatedly
- Asset class matters enormously: crypto shows the strongest results; commodities the weakest, across all Bollinger Band signal types
- The middle band (20-SMA) acts as dynamic support/resistance and is often more useful than the outer bands in trending markets
- Mechanical Bollinger Band strategies have marginal or negative edge without additional confirmation — confluence is key
- Stocks365 uses Bollinger Band signals within its Trust Score volatility and agreement scoring layers for smarter signal weighting