
Bollinger Bands Day Trading: How to Use Them for Intraday Setups
Bollinger Bands are one of the most widely used tools in technical analysis — but most day traders use them wrong. They react to band touches instead of reading what the bands are actually telling them. The result? A string of false entries and preventable losses.
This guide cuts through the noise. You'll learn exactly how to use Bollinger Bands for day trading, which intraday setups produce the cleanest signals, when to stay out, and how to combine bands with other indicators for genuine edge.
Stocks365 backtested over 14,000 Bollinger squeeze breakout signals across multiple asset classes and found a profit factor of 1.03 — meaning the strategy does carry a measurable edge, but only when applied correctly. Setup selection matters more than the indicator itself. Here's how to do it right.
What Are Bollinger Bands and Why Day Traders Use Them
Bollinger Bands consist of three lines plotted around price: a middle band (the 20-period simple moving average), an upper band (2 standard deviations above the SMA), and a lower band (2 standard deviations below). As volatility expands, the bands widen. As volatility contracts, they tighten.
For a deeper breakdown of the math and construction, read our guide on How Bollinger Bands Work: Master the Math Behind It.
Day traders value Bollinger Bands for three core reasons:
- Volatility context: Bands tell you whether price is in an expansion or contraction phase — critical for choosing between breakout and mean-reversion strategies.
- Dynamic support and resistance: The upper and lower bands shift with price, making them more responsive than static horizontal levels.
- Squeeze detection: Periods of extreme band narrowing (the Bollinger Squeeze) often precede explosive intraday moves.
On intraday timeframes — the 5-minute, 15-minute, and 1-hour charts — these properties become especially powerful because volatility cycles compress into hours rather than days.
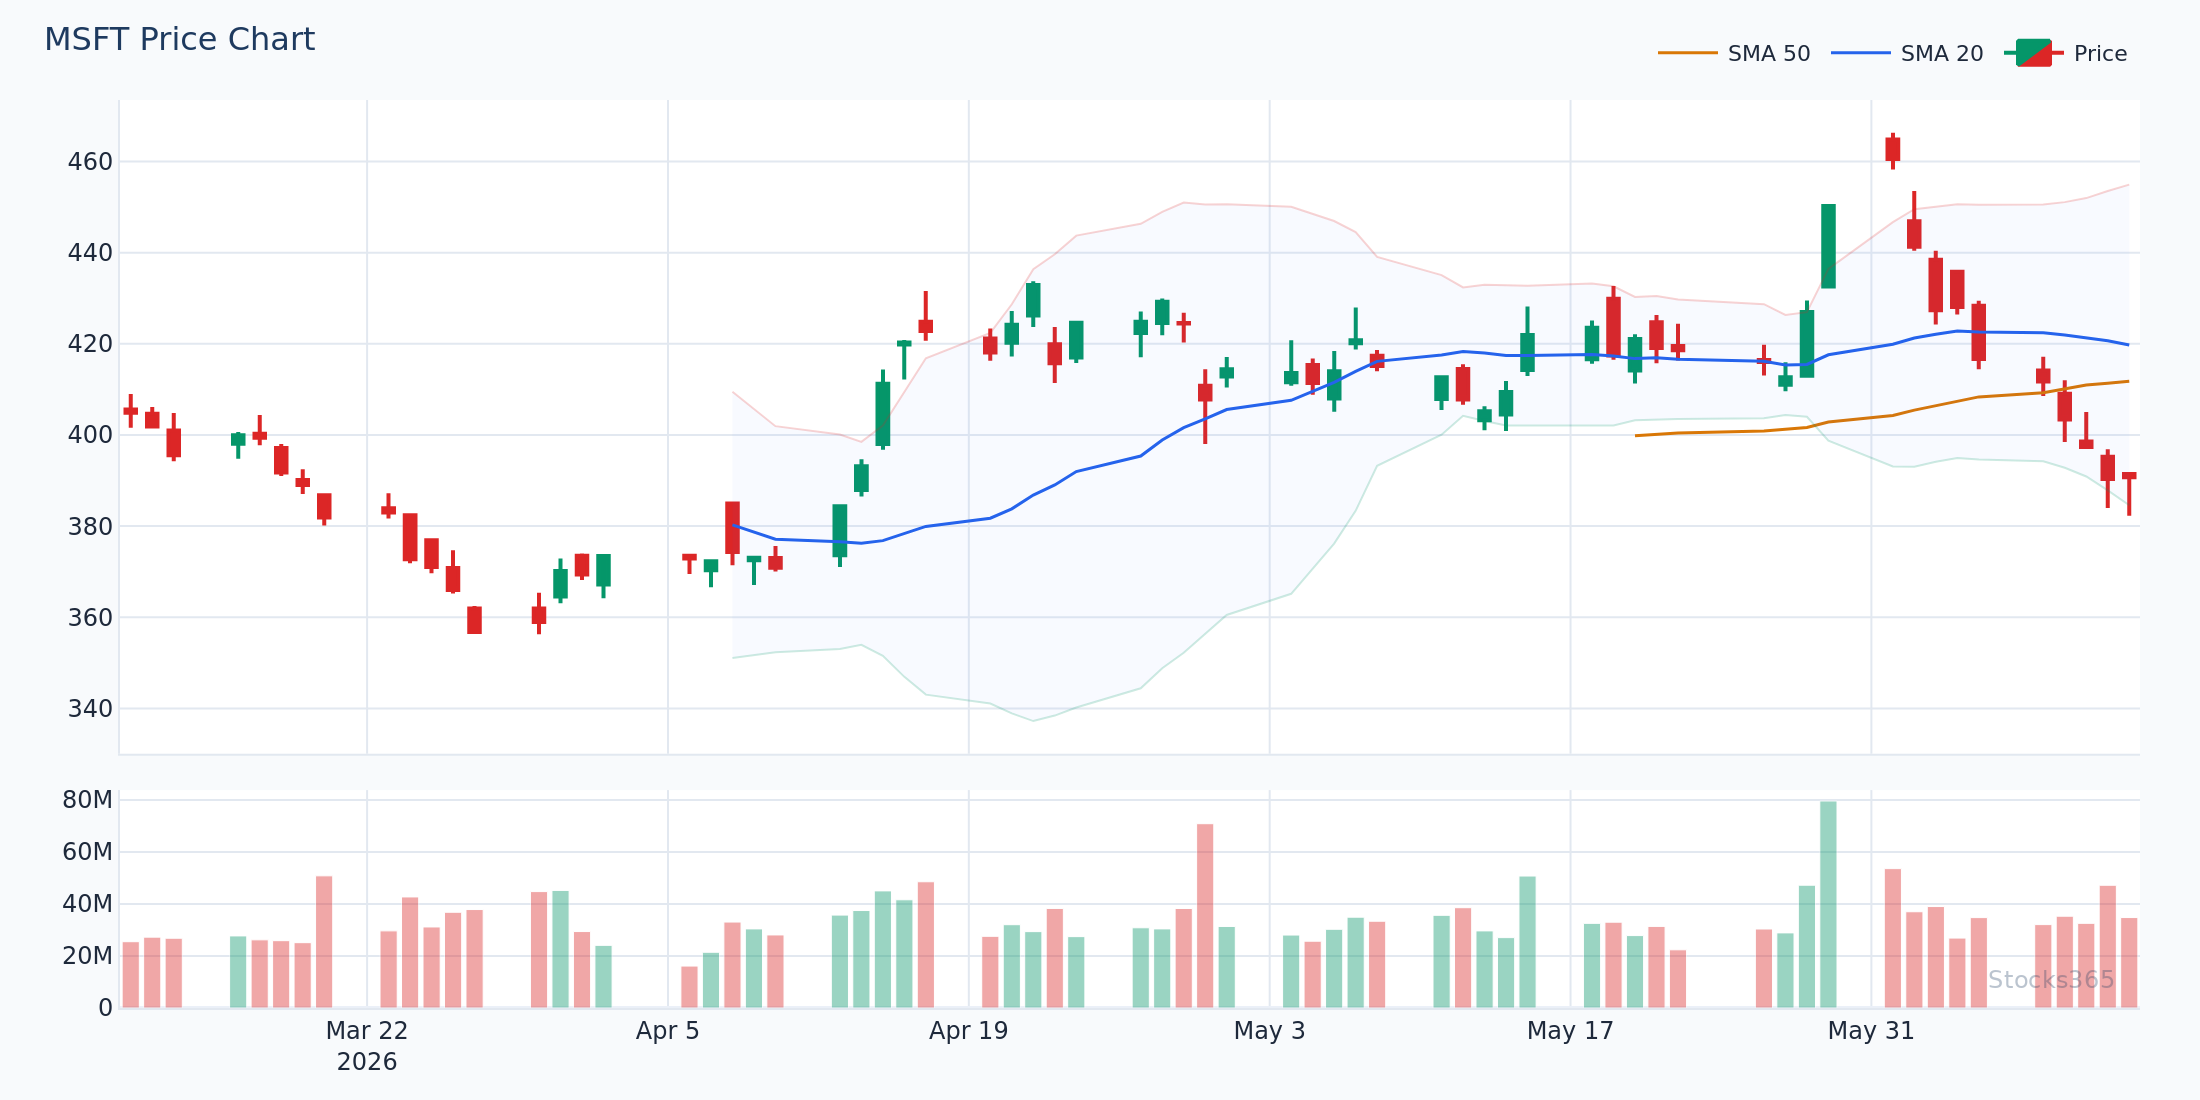
This chart shows price coiling inside narrowing bands before a sharp directional breakout. When the upper band begins to slope upward and price prints consecutive closes above the 20-SMA, the expansion phase is confirmed. A breakdown back inside the bands within 1-2 candles typically invalidates the move.
The Core Bollinger Bands Day Trading Setups
1. The Bollinger Squeeze Breakout
The squeeze is the most powerful intraday setup Bollinger Bands produce. When band width drops to historically low levels — below the 20th percentile of recent readings — volatility is coiled. The breakout that follows tends to be fast and directional.
Here's how to trade it intraday:
- Identify a squeeze on the 15-minute or 1-hour chart using Bollinger Band Width (BBW) or the %B indicator dropping near zero.
- Wait for a candle to close outside the band — not just pierce it. A close matters.
- Confirm with volume. A breakout candle with 1.5x to 2x average volume is a strong signal. Low-volume breaks fail far more often.
- Enter on the next candle's open with a stop below (or above) the middle band.
Our Bollinger Band Squeeze: Master Low Volatility Setups guide covers the detection logic and band width thresholds in detail.
One thing to know: squeeze breakouts in crypto have historically outperformed all other asset classes in our data. Worth keeping on your watchlist during high-activity sessions.
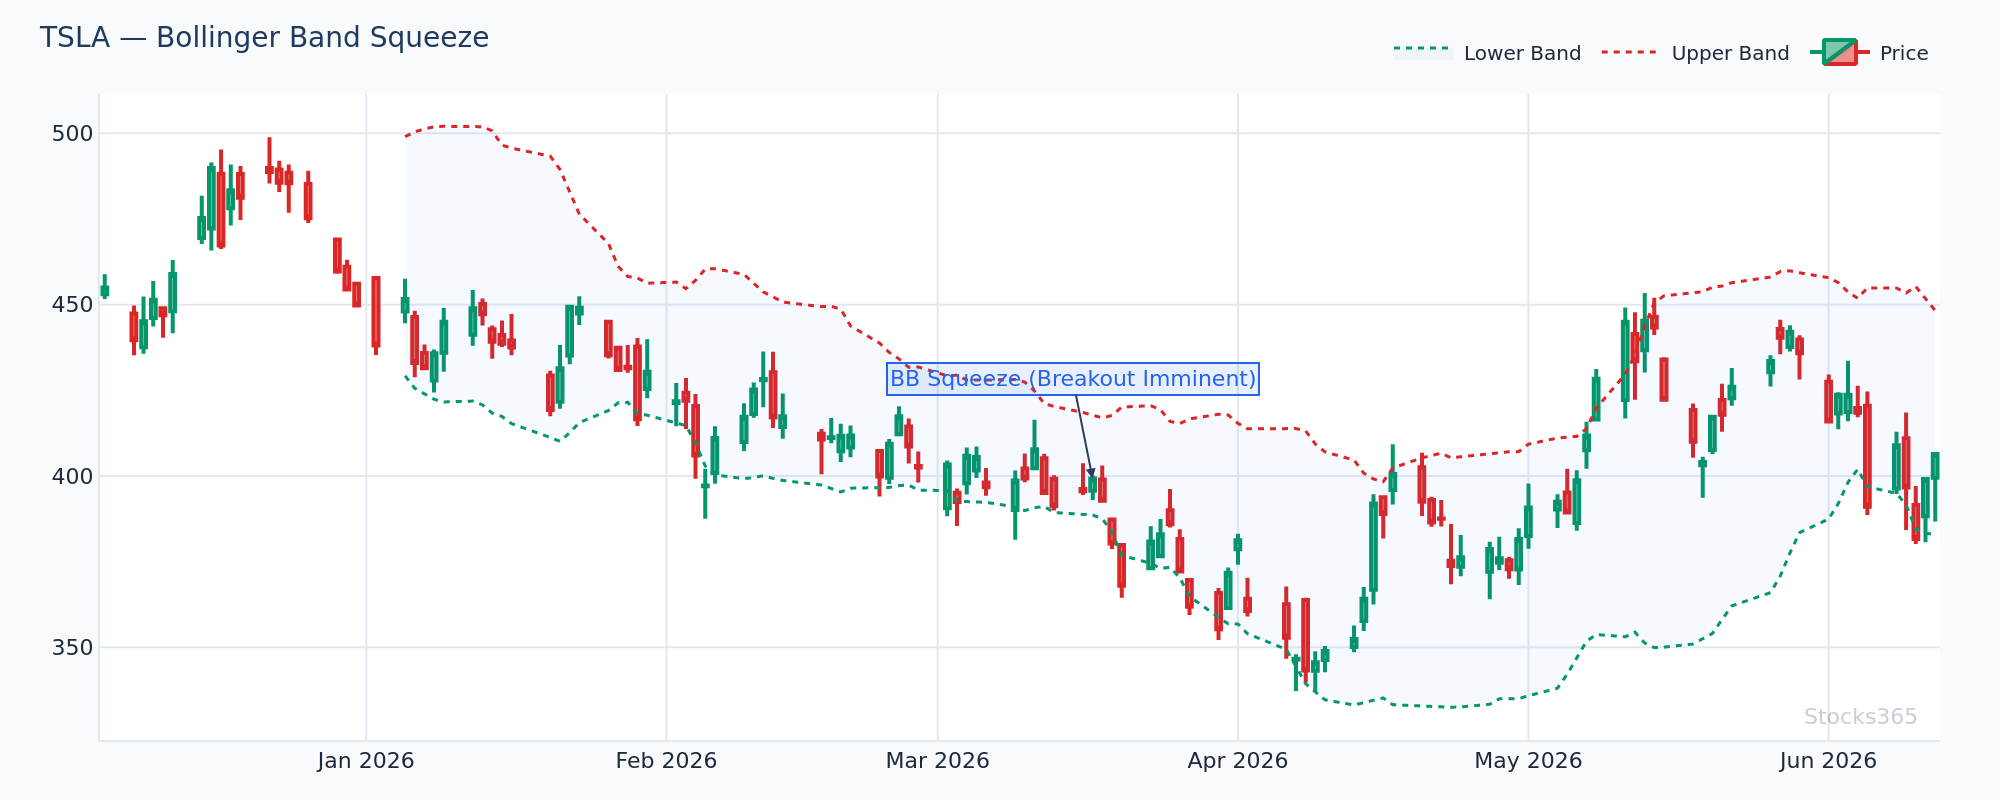
Here, band width compresses to multi-session lows as price consolidates tightly around the 20-SMA. The first close above the upper band — accompanied by elevated volume — signals the breakout phase. If price reverses and closes back below the middle band within two candles, the breakout has failed and the trade is off.
2. Upper and Lower Band Touches (Mean Reversion)
Price touching the upper band doesn't mean sell. Price touching the lower band doesn't mean buy. Full stop.
Here's what most traders get wrong: They treat a Bollinger Band touch as an automatic reversal signal. In trending markets, price can walk the upper band for an entire session — touching or exceeding it on every candle — while traders keep shorting into momentum and getting stopped out repeatedly. The real signal isn't the touch. It's what happens after the touch. Watch for a candle that touches the upper band and then closes back inside, with momentum indicators rolling over simultaneously. That's your mean reversion setup.
Our analysis of 3,255 upper band touch signals found a win rate of 49.6% with a profit factor of 0.88 over a 10-day holding period — meaning blind band-touch trading without confirmation is a losing strategy. The edge comes from filtering. Add momentum confirmation, session timing, and trend context, and the picture changes.
For intraday mean reversion, the setup looks like this:
- Price closes outside the upper or lower band (not just wicks).
- The next candle reverses and closes back inside the band.
- RSI is above 70 (for upper band) or below 30 (for lower band) and curling back toward the midline.
- The broader trend on the higher timeframe (1-hour or 4-hour) is either sideways or mildly counter to the touch direction.
When all four conditions align, the trade toward the 20-SMA midline has significantly higher probability. For RSI confirmation techniques, see our RSI Indicator: The Complete Trading Guide for 2026.
3. Bollinger Band Riding (Trend Continuation)
Strong trending stocks don't bounce off the upper band. They ride it.
When price breaks above the upper band with conviction — strong volume, wide-range candles, higher lows on each retest — that's a trend continuation signal, not a reversal. The strategy here is to enter pullbacks to the 20-SMA midline rather than fading the strength.
The setup on a 15-minute chart:
- Price is in a clear intraday uptrend, making higher highs and higher lows.
- Upper band is sloping upward, not flat.
- Price pulls back to touch the 20-SMA (middle band) — a natural intraday reset.
- A bullish candle forms at or near the 20-SMA, with RSI holding above 50.
- Enter long with a stop below the lower band or the most recent swing low.
This is one of the cleanest intraday setups when market conditions cooperate. The 20-SMA acts as a dynamic floor in trending sessions.
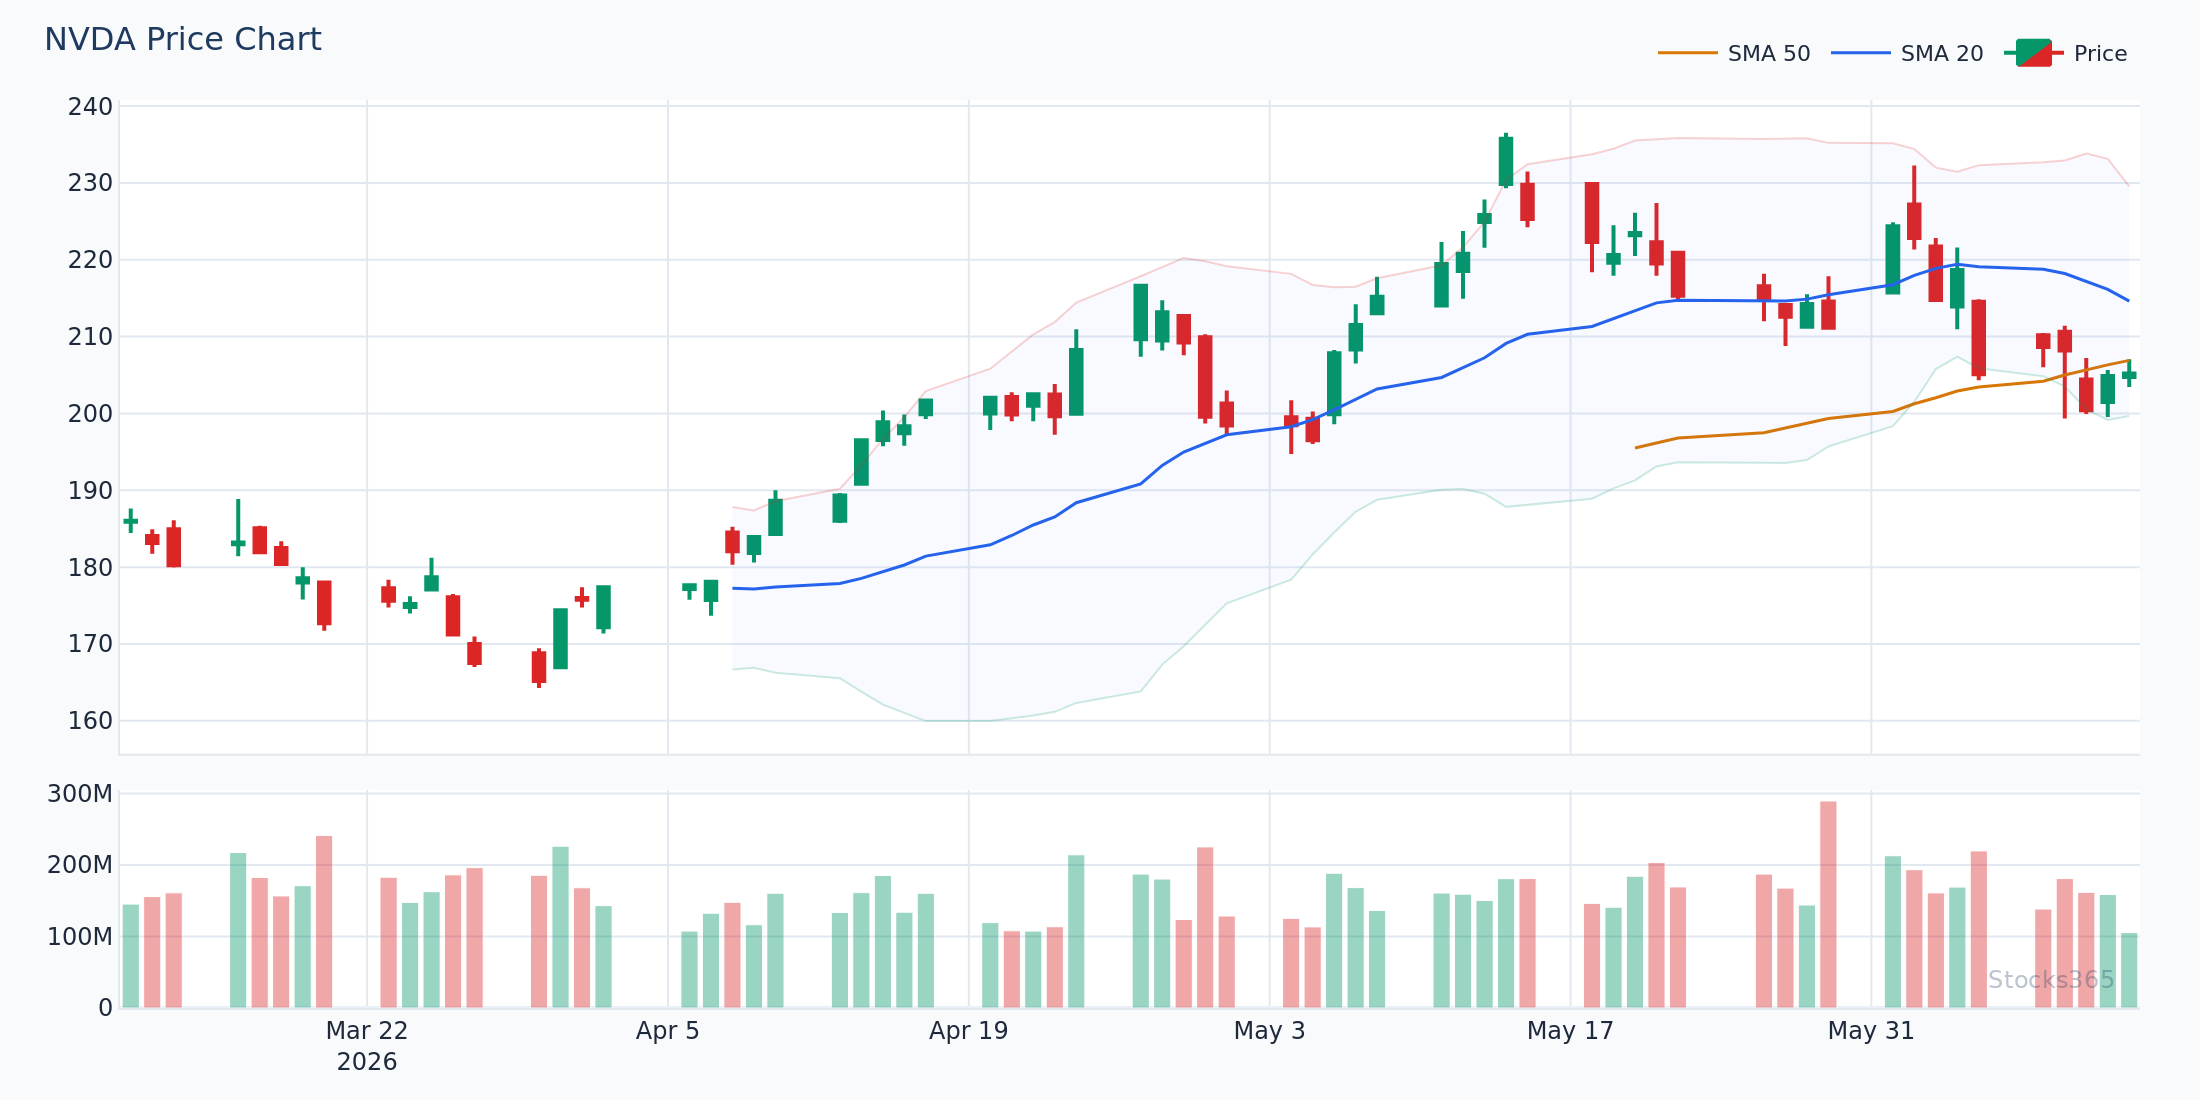
The chart illustrates multiple clean entries as price pulls back to the rising 20-SMA before continuing higher. Each touch of the middle band that holds as support confirms the trend structure. A close below the lower band would signal that the trend has broken and exits are warranted.
Combining Bollinger Bands With Other Indicators for Day Trading
Bollinger Bands + RSI
RSI is the most natural companion to Bollinger Bands for intraday trading. Bands measure volatility and price position; RSI measures momentum. Together, they filter out a significant portion of false signals.
The classic pairing:
- Oversold reversal: Price closes outside the lower band + RSI drops below 30 and curls upward. Enter long when RSI crosses back above 30.
- Overbought reversal: Price closes outside the upper band + RSI rises above 70 and curls downward. Enter short when RSI crosses back below 70.
- Trend continuation: Price pulls back to 20-SMA + RSI holds above 50 without reaching oversold. Enter long on next bullish candle.
For trendline-based RSI entries that work on intraday charts, check out our RSI Trendline Strategy: Master Drawing Lines for Better Signals.
Bollinger Bands + Stochastic Oscillator
The Stochastic Oscillator adds a cycle-timing element that works especially well on the 5-minute and 15-minute charts. When both indicators agree on overbought or oversold conditions, the signal is stronger — but it still requires careful filtering.
Stocks365 backtested 3,026 BB + Stochastic double-overbought signals and found a 49.9% win rate with a profit factor of 0.91. The strategy is marginally unprofitable on average — but that average includes all market conditions and asset classes. Crypto showed a 58.0% win rate with this double-confirmation setup, while commodities came in at just 40.7%. Asset selection is everything with this pairing.
For a deeper dive on reading Stochastic signals, visit How to Read the Stochastic Oscillator: Step-by-Step, and for the fast vs. slow distinction that changes how signals fire intraday, see Fast vs Slow Stochastic Oscillator: Key Differences.
Bollinger Bands + Volume
Volume is non-negotiable for day trading. No volume confirmation? No trade.
For squeeze breakouts, require volume to exceed 1.5x the 20-period average on the breakout candle. For mean reversion trades at band extremes, look for volume to be declining (exhaustion) into the touch, followed by a surge on the reversal candle. Low-volume band touches that reverse quickly are usually just noise — price will revisit the extreme again.
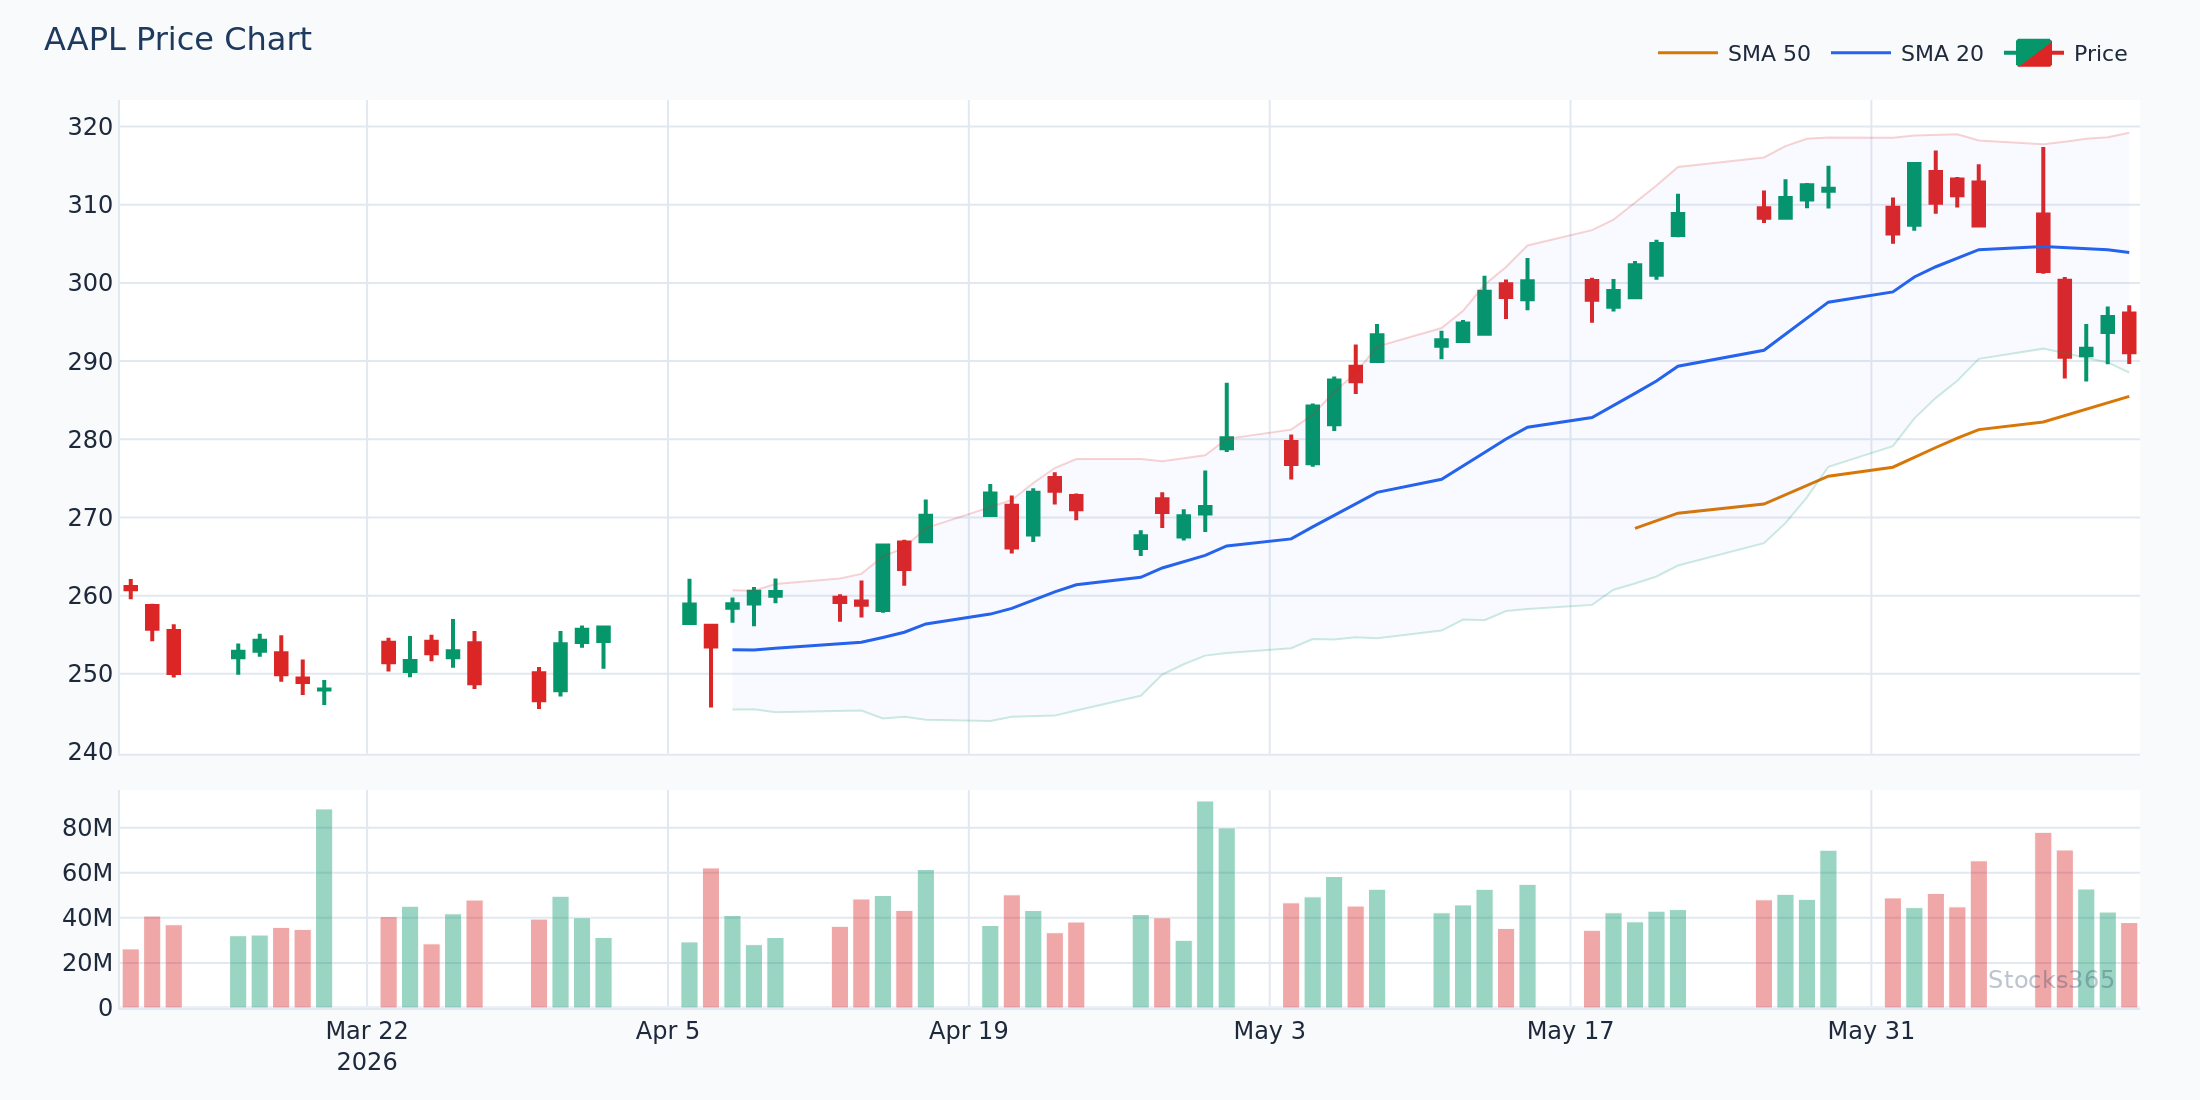
This setup shows price consolidating in a tight range as volume dries up, bands compress, and then a breakout candle forms with volume spiking well above average. The volume expansion is what separates a genuine breakout from a fakeout. If the next one or two candles show declining volume and price fails to extend, the breakout is likely failing and a reversal back inside the bands is probable.
Bollinger Bands Day Trading: Timeframe Selection
Timeframe matters enormously for intraday Bollinger Band setups. Here's the breakdown:
- 5-minute chart: Best for scalping band extremes during the first and last hour of the session. Noise is highest here — filter aggressively with volume and momentum indicators. False signals are frequent.
- 15-minute chart: The sweet spot for most intraday Bollinger Band strategies. Enough data per candle to reduce noise while still generating multiple setups per session.
- 1-hour chart: Ideal for identifying the session's dominant trend and squeeze setups. Use the hourly band structure to frame your 15-minute entries. High timeframe context always wins.
Always align your trade direction with the 1-hour trend. Fading a strong hourly trend on a 5-minute band touch is one of the fastest ways to lose money.
When Bollinger Bands Day Trading Setups Fail
Bollinger Bands perform best in two conditions: clearly trending markets and clearly rangebound markets. They struggle — and produce the most false signals — in choppy, low-conviction environments where price oscillates randomly between the bands without direction.
Signs the market conditions are unfavorable for Bollinger Band setups:
- Band width is moderate — not at a historical extreme (squeeze or expansion). Middle conditions produce middle-quality signals.
- Price crosses the 20-SMA multiple times in quick succession without following through in either direction.
- Volume is consistently below average across multiple candles. No participation, no sustained move.
- News-driven, erratic price action with no technical structure. Bands expand and contract chaotically.
On those days? Step back. The setup isn't there. Forcing trades against unfavorable conditions is where accounts bleed slowly.
For reference on how market regime affects signal quality across all indicator types, our Golden Cross vs Death Cross: The Complete Market Guide covers macro trend identification that provides the broader context for intraday setups.
Bollinger Bands Buy and Sell Signals for Day Traders
Understanding how to read entry and exit signals from Bollinger Bands is fundamental. For a comprehensive breakdown of the full signal framework — including buy signals, sell signals, and the nuances that determine signal quality — see our Bollinger Bands Buy and Sell Signals Explained: Master Guide.
For day trading specifically, the cleanest buy signals come from:
- Lower band touch + reversal candle + rising RSI from below 30
- 20-SMA support hold in an established intraday uptrend
- Squeeze breakout above the upper band with volume confirmation
The cleanest sell signals come from:
- Upper band touch + reversal candle + falling RSI from above 70
- Failed breakout above the upper band — price closes back inside within 1-2 candles
- Squeeze breakout below the lower band with volume expansion
Exit rules matter as much as entries. For intraday band-riding trades, exit when price crosses back through the 20-SMA with a closing candle. For mean reversion trades, the target is typically the opposite band or the 20-SMA midline, depending on trend context.
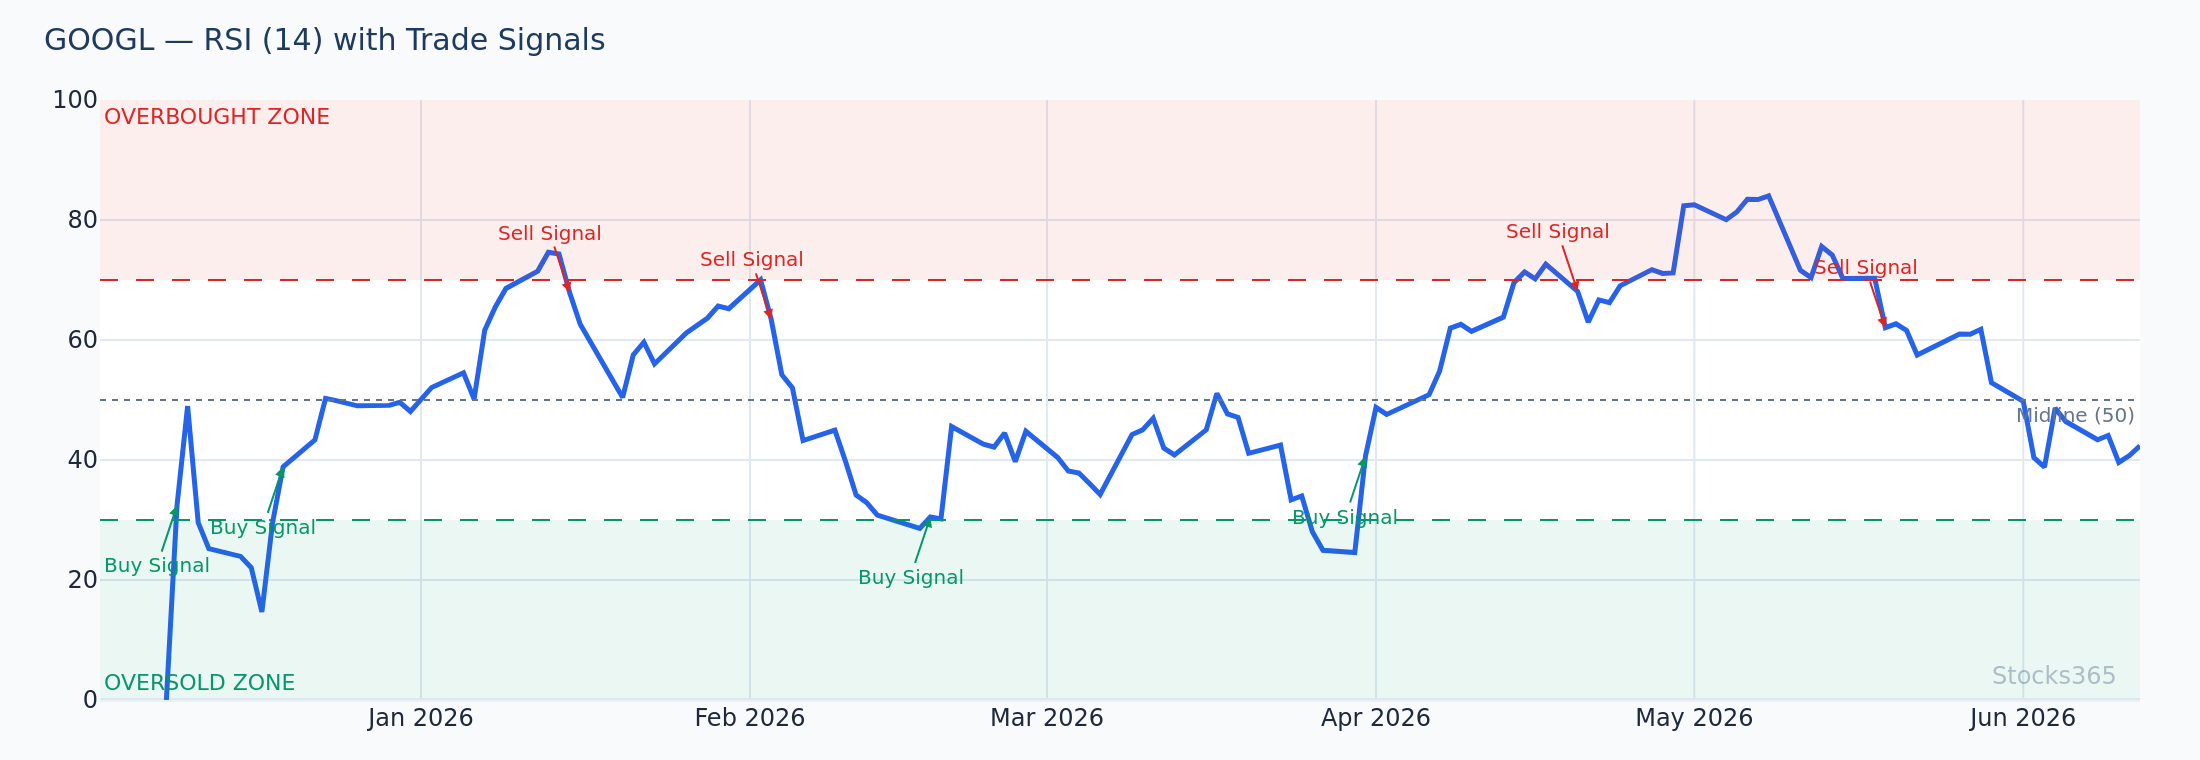
This chart shows price making a lower low at the bottom band while RSI makes a higher low — classic bullish divergence. This divergence, paired with the band touch and a subsequent bullish reversal candle, signals that selling momentum is exhausting. Confirmation comes when price closes back above the 20-SMA; failure occurs if price continues to close below the lower band on subsequent candles without any bounce structure forming.
What to Watch For
- Squeeze setups on high-beta tech stocks during the 9:30–10:30 AM session: When band width drops below the 20th percentile on the 15-minute chart in the pre-breakout window, the subsequent directional move often produces a 2-3 ATR expansion within the first two hours of trading.
- Upper band walks during momentum earnings days: When a stock gaps up on strong earnings and immediately begins riding the upper band with rising RSI, pullbacks to the 20-SMA offer trend-continuation entries rather than reversal shorts.
- Double confirmation on crypto intraday setups: BB + Stochastic double-oversold readings on the 15-minute crypto chart have historically shown the strongest win rates in our data. Wait for both indicators to agree before entering.
- Failed breakouts as reversal signals: A candle that closes above the upper band followed by a sharp close back inside the band within 1-2 candles is often a stronger reversal signal than a simple band touch. The failure traps breakout buyers and accelerates the reversal toward the midline.
- Pre-market squeeze detection: When band width on the 1-hour chart reaches multi-week lows heading into a catalyst (Fed announcement, earnings, economic data release), the intraday breakout that follows often produces the session's biggest directional move.
How Stocks365 Uses This
Bollinger Bands are one of 12+ indicators integrated into the Stocks365 Trust Score system. Specifically, Bollinger Band positioning contributes to the volatility scoring component — the system evaluates current band width relative to historical percentiles to classify each signal as occurring in a squeeze, expansion, or neutral regime. This regime classification directly influences signal weighting: squeeze breakout signals in high-volatility expansion phases receive elevated trust scores, while band-touch signals in choppy, mid-range conditions are downweighted. When you view a signal on the Stocks365 signals dashboard or check an individual stock signal like AAPL's signal page, the Trust Score reflects this Bollinger Band regime context alongside momentum, trend, and volume agreement scores. The result is a composite signal quality rating that goes far beyond any single indicator — giving you the full picture before you enter a trade.
Key Takeaways
- Band touches alone are not signals. Confirmation from price action, volume, and momentum indicators is required before entering any position.
- The Bollinger Squeeze is the most powerful intraday setup. Band width at historical lows followed by a confirmed breakout with volume is the cleanest entry the bands produce.
- Crypto responds best to Bollinger Band setups across multiple strategy types in our backtested data — higher win rates than stocks, forex, or commodities.
- Trending conditions call for band-riding strategies; rangebound conditions call for mean reversion. Misidentifying market regime is the primary reason Bollinger Band trades fail.
- The 15-minute chart is the optimal intraday timeframe for most Bollinger Band setups — enough signal clarity without the noise of tick or 5-minute charts.
- RSI is the strongest confirmation indicator to pair with Bollinger Bands for day trading. Together they address both price position (bands) and momentum direction (RSI).
- Use our research dashboard to explore backtested Bollinger Band signal performance across asset classes before committing to a setup.