
Bollinger Bands Day Trading: How to Read Intraday Setups Like a Pro
Most traders slap Bollinger Bands on a chart and wait for price to touch the outer band. Then they wonder why they keep losing money. That's not a strategy — that's guessing with extra steps.
Bollinger Bands day trading is a discipline. It requires understanding why the bands expand and contract, what that tells you about market energy, and exactly when to pull the trigger. This guide covers the real intraday setups — the ones professional desks actually use.
What Are Bollinger Bands? A Quick Refresher for Day Traders
Bollinger Bands consist of three lines plotted on a price chart: a 20-period simple moving average in the middle, with an upper and lower band set two standard deviations away from that average. John Bollinger developed the indicator in the 1980s, but it remains one of the most powerful volatility tools available in 2026.
Here's what each component tells you:
- Middle Band (20 SMA): The short-term trend baseline. Price above it = bullish bias. Price below = bearish.
- Upper Band: Statistically extreme high. About 95% of price action stays within the bands.
- Lower Band: Statistically extreme low. A touch here doesn't mean buy — context matters.
- Band Width: The distance between upper and lower bands. Narrow = low volatility brewing. Wide = volatile market in motion.
For day trading, the default setting (20 periods, 2 standard deviations) works well on 5-minute and 15-minute charts. Some aggressive scalpers drop to a 10-period setting on 1-minute charts — but that increases noise dramatically.
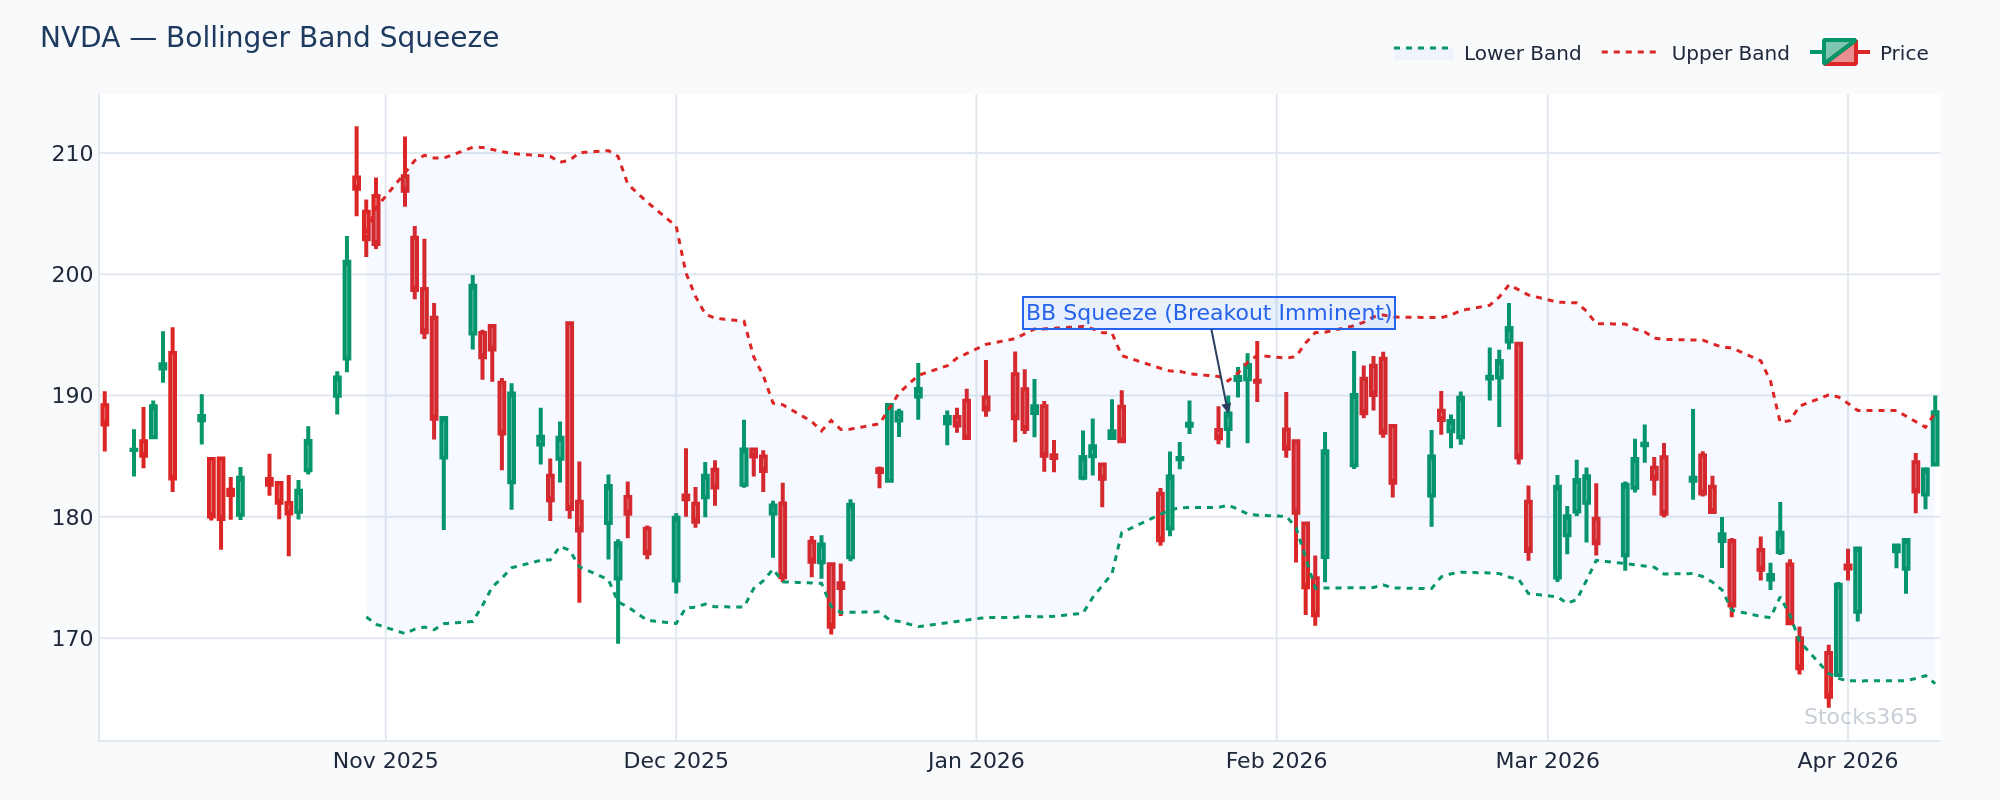
This chart shows NVDA's bands compressing tightly over several 15-minute candles — the classic pre-breakout coil. When bands get this narrow, a volatility expansion is loading. The direction isn't confirmed yet; watch for the first decisive candle to close outside the squeeze zone. A close back inside the bands after the initial breakout candle invalidates the setup immediately.
The 3 Core Bollinger Bands Day Trading Setups
Setup 1: The Bollinger Band Squeeze — The Breakout Play
The squeeze is the highest-probability Bollinger Bands day trading setup. Full stop.
When the bands compress to their narrowest point in 20+ bars, volatility is historically low. Markets breathe — periods of compression are always followed by expansion. The trader's job is to identify the squeeze, then wait for confirmation of direction before entering.
Exact entry criteria:
- Band width drops to the lowest level in at least 20 bars on your chart
- Price coils inside the bands for 4+ consecutive candles
- A candle closes decisively outside the upper or lower band
- Volume spikes at least 1.5x the 10-bar average on the breakout candle
Real example: AAPL trading at $227.40 on a 15-minute chart. Bands narrow between $226.80 and $228.00 for six candles. Then a 15-minute candle closes at $229.10 — outside the upper band — on double the average volume. That's your entry signal. Stop goes just below the middle band at $227.40. First target: $230.80 (1.5x the band width projected from breakout point).
Don't chase. If you miss the breakout candle, wait for a pullback to the middle band. That's the second entry opportunity, and it's often cleaner.
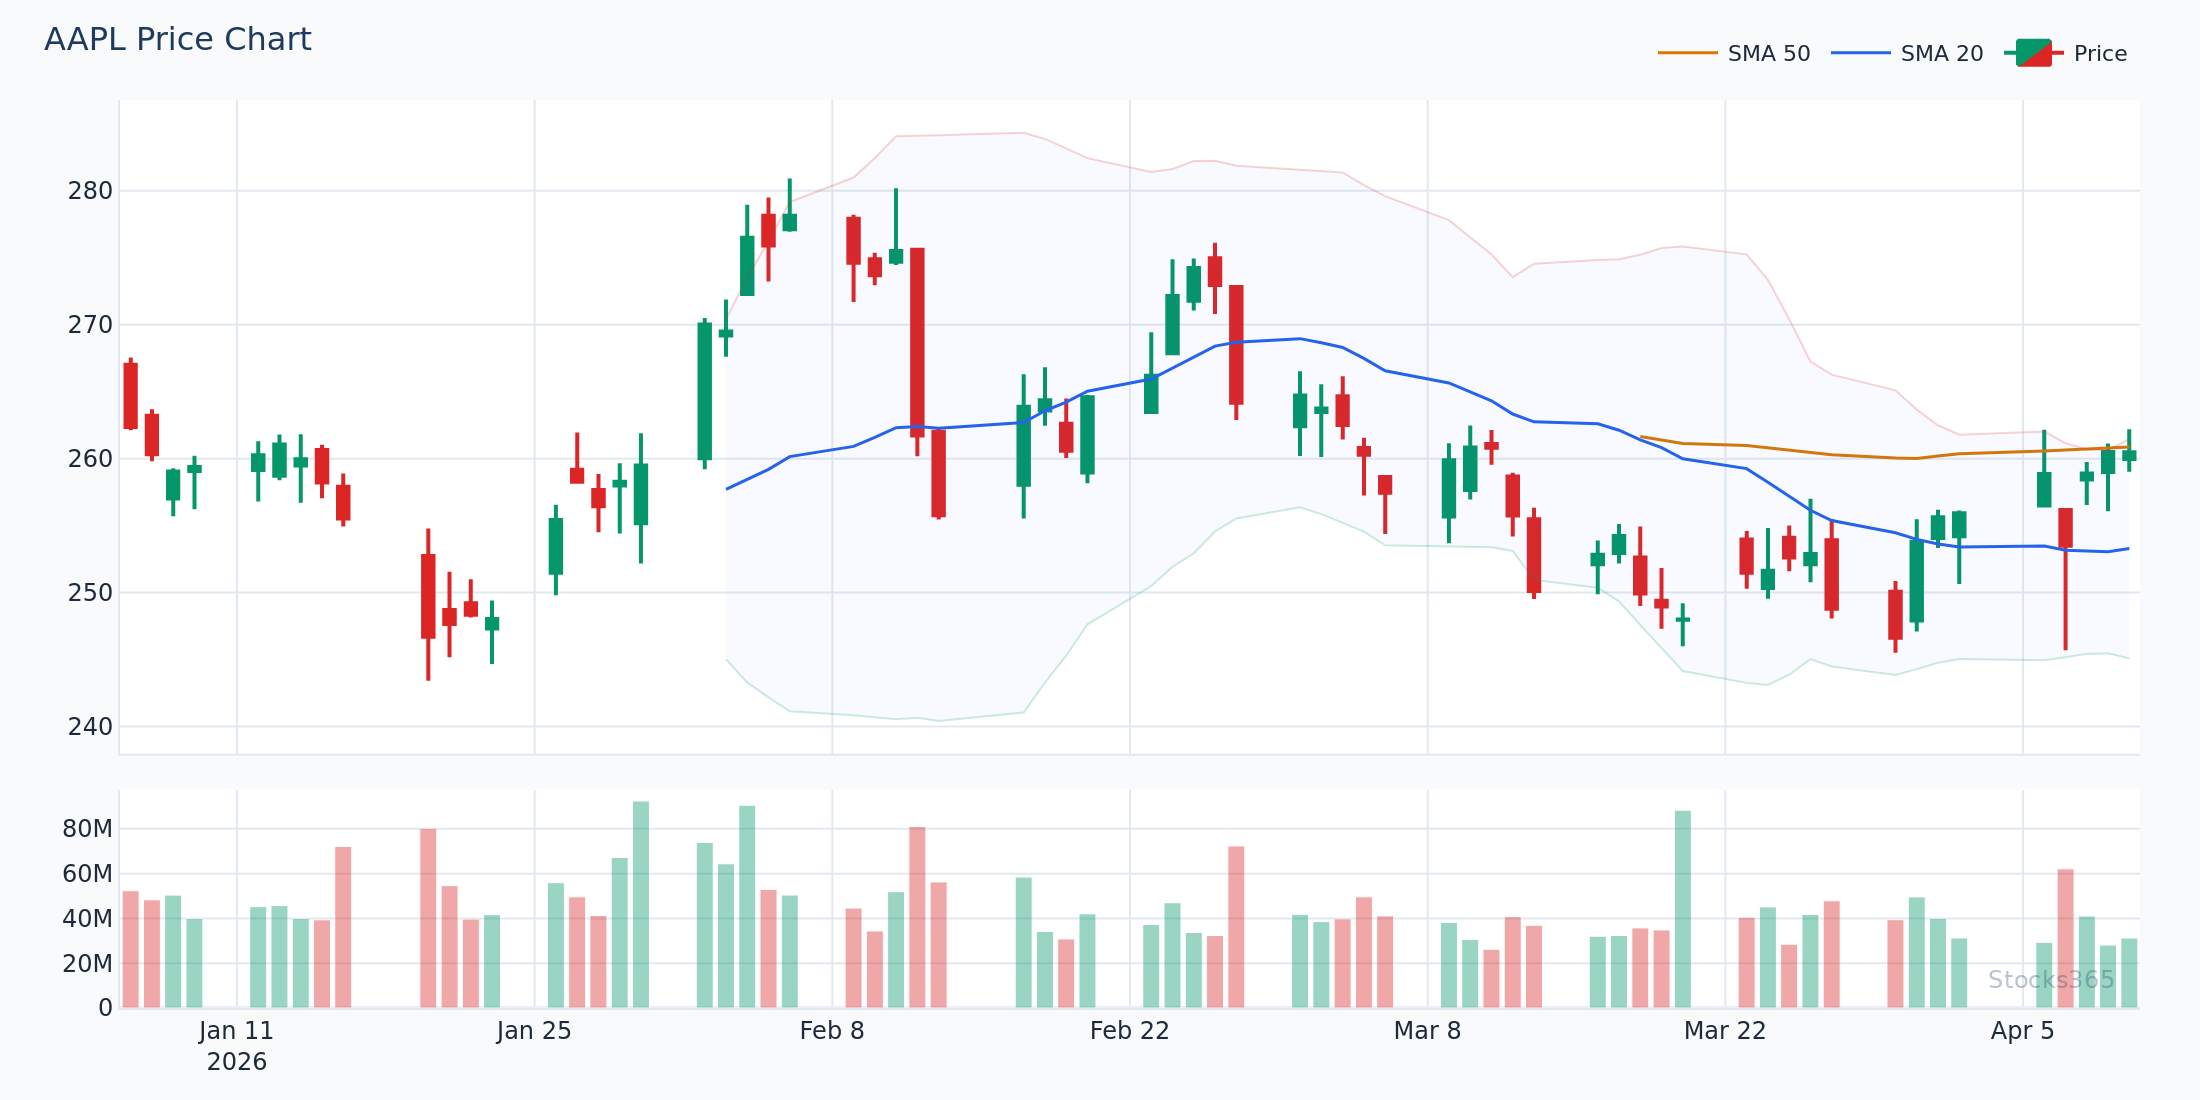
The candlestick chart here shows the compression zone clearly — multiple small-range candles clustered near the middle band before the explosive breakout. This pattern typically resolves with a move equal to the band width at the squeeze's narrowest point. The setup fails if price immediately reverses back into the squeeze zone within two candles of the breakout.
Setup 2: The Band Ride — Trending Intraday Momentum
When a stock is trending hard, price walks along the outer band. Candle after candle touches or exceeds the upper band in an uptrend. This is not overbought. This is momentum.
Here's what most traders get wrong: they see price repeatedly touching the upper Bollinger Band and immediately think it's a sell signal. In a strong trending market, price can ride the upper band for 10, 15, even 20 consecutive candles. Selling every touch during a band ride is one of the most expensive mistakes in day trading. The real edge is staying in the trend until the band ride breaks — when price closes back below the middle band, that's your exit signal, not the first upper band touch.
Band ride entry rules:
- Price closes above the upper band on two consecutive candles — trend is confirmed
- Middle band is sloping upward (for uptrend rides)
- Enter on the first pullback to the middle band during the ride
- Exit when a candle closes below the middle band
Real example: TSLA running from $285.00 opens strong, closes two consecutive 5-minute candles above the upper band at $288.50 and $289.20. Middle band slopes up at $286.00. Price dips back to $286.40 — middle band touch. That's the entry. Target: continuation toward $292-$294 range. Stop: close below the middle band.
Setup 3: The Mean Reversion Play — Fading Extremes in Range-Bound Markets
Mean reversion only works in one specific condition: confirmed range-bound, low-trend environments. Get this context wrong and you'll be fighting momentum all day.
In a ranging market, price oscillates between the upper and lower bands with the middle band acting as a magnet. Each touch of the outer band is a potential reversal point — but only with confirming signals.
Confirming signals for mean reversion entries:
- Middle band is flat (not sloping more than 15-20 degrees)
- Price touches the lower band with a hammer or bullish engulfing candle
- RSI is below 35 and turning up — cross-confirmation matters here
- Volume on the reversal candle is above average
Pairing Bollinger Bands with momentum oscillators dramatically improves the accuracy of mean reversion trades. Check out the RSI vs Stochastic Oscillator guide to understand which oscillator confirms reversals better in different market conditions. For pure RSI confirmation, the RSI overbought and oversold levels guide explains exactly when an oscillator reading actually means something.
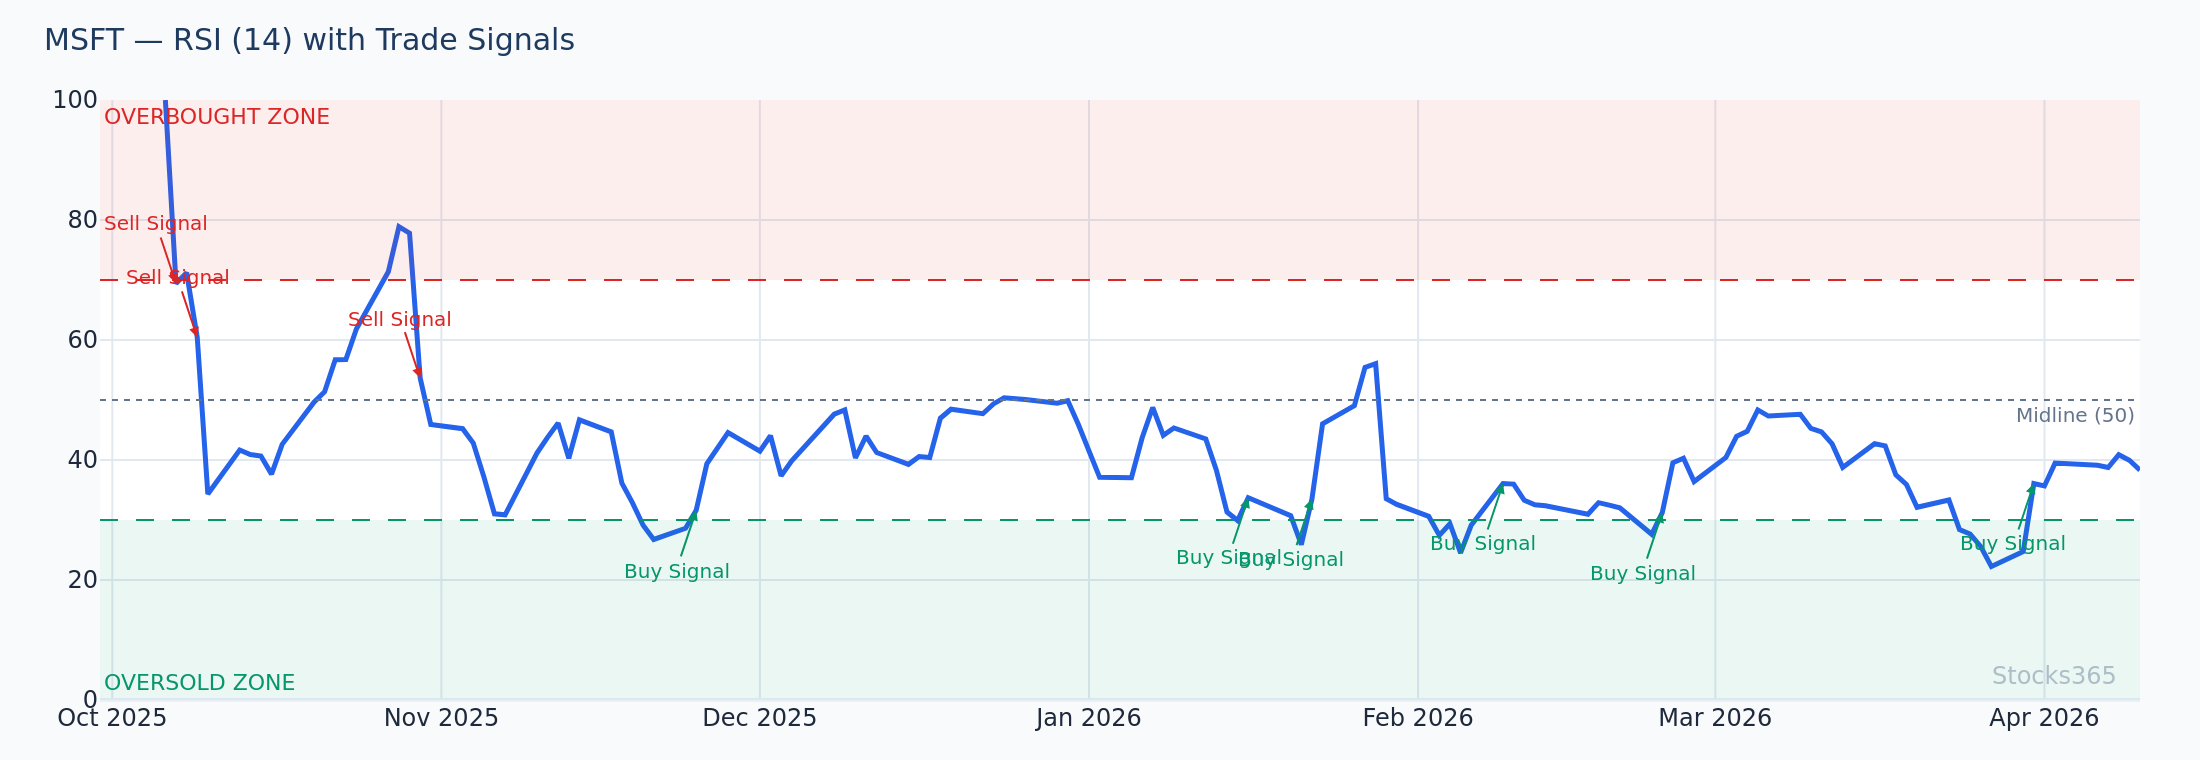
This RSI chart paired with MSFT's Bollinger Bands shows price touching the lower band while RSI simultaneously hits 32 — a confluence that significantly increases reversal probability. When both signals align like this, the next 3-5 candles typically move back toward the middle band. The setup is invalidated if RSI continues falling below 30 and the candle closes below the lower band on increasing volume.
Bollinger Bands Day Trading on Different Timeframes
5-Minute Charts: Fast Entries, Tight Stops
The 5-minute chart is the battlefield for most retail day traders. Bollinger Bands on this timeframe generate frequent signals — which means frequent opportunities to overtrade. Use it for entries only after the 15-minute chart confirms the direction.
On 5-minute charts, reduce your band width target by 40%. Moves are smaller, faster, and more prone to whipsaws. A realistic target off a 5-minute squeeze breakout on GOOGL trading at $195.00 might be $1.50-$2.00, not the $5-$6 you'd expect from a daily chart squeeze.
15-Minute Charts: The Sweet Spot for Day Traders
The 15-minute chart is where Bollinger Bands day trading becomes most reliable. Enough price data per candle to filter noise. Fast enough to capture intraday moves. Most professional intraday traders build their primary setups here and use the 5-minute chart only to time entries.
The Multi-Timeframe Approach
Top-down analysis works. Check the 1-hour chart first to understand the broader intraday trend. Then drop to 15-minute for setup identification. Then use 5-minute for precise entry timing. All three timeframes showing the same directional bias? That's a high-conviction trade.
Understanding how momentum indicators behave across timeframes is critical — the complete guide to using RSI in trading covers multi-timeframe momentum analysis that pairs directly with Bollinger Bands setups.
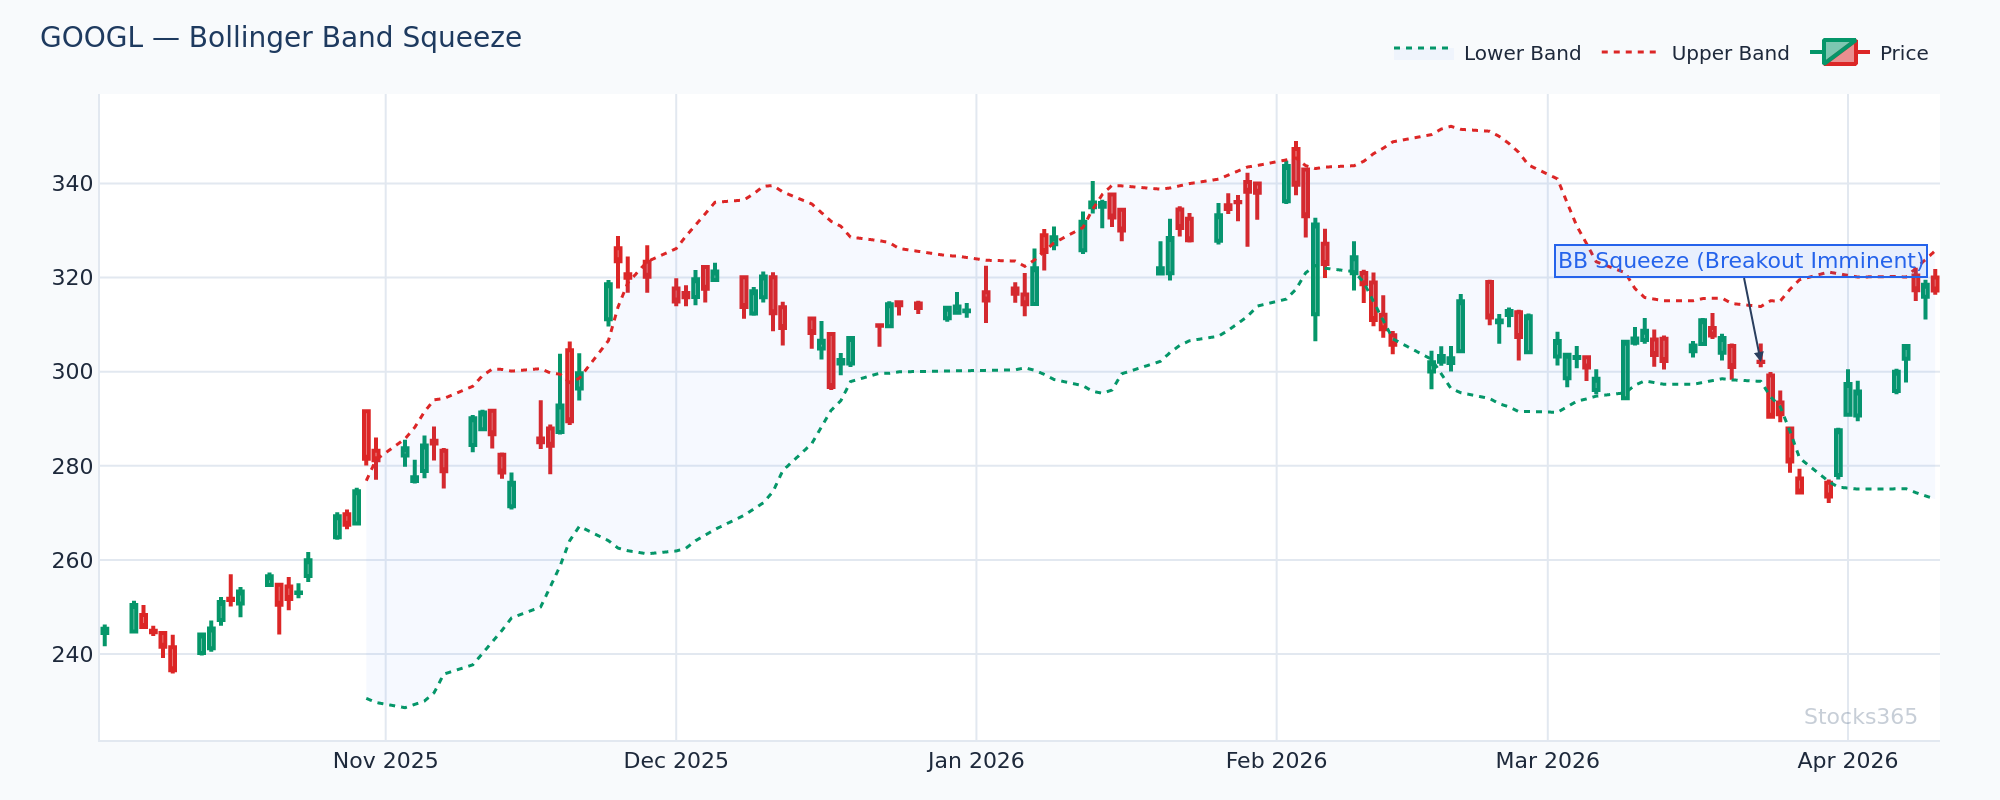
GOOGL's 15-minute chart shows a textbook squeeze forming with the 1-hour trend in bullish alignment. The bands are at their narrowest in 25 bars, suggesting a significant move is building. If the breakout fires to the upside with volume confirmation, the initial target sits at the 1-hour upper band around $198.50. Downside continuation below the lower band at $193.20 invalidates the bullish multi-timeframe thesis.
Bollinger Bands + RSI: The Combination That Actually Works
Bollinger Bands measure volatility and price extremes. RSI measures momentum. They answer different questions, which is exactly why they complement each other so well.
The combination is simple in theory: Bollinger Bands identify where price is relative to its range. RSI tells you how strong the move is. When both agree, probability rises significantly.
Key combinations to watch:
- Upper Band Touch + RSI Divergence: Price makes a new high touching the upper band, but RSI makes a lower high. Classic reversal signal. Learn more about this in the RSI divergence guide.
- Squeeze Breakout + RSI Above 55: Confirms breakout momentum is genuine, not a false start.
- Lower Band Touch + RSI Below 35: Potential reversal zone — but wait for a green candle to close before entering long.
- Band Ride + RSI Staying Above 60: Confirms the trend is intact, not exhausting.
New to RSI? The complete beginner's guide to RSI covers everything from the basics to practical application. For the math behind the indicator, the RSI formula explained step by step breaks down exactly how the values are calculated.
Advanced traders also watch for hidden RSI divergence during band rides — a signal most retail traders completely miss. The hidden RSI divergence guide explains how to use this to stay in winning trades longer.
Risk Management for Bollinger Bands Day Trading
Setups mean nothing without proper risk management. Here's how professionals structure risk around Bollinger Bands trades:
Stop Loss Placement
- Squeeze breakout trades: Stop below/above the middle band at the time of entry
- Band ride trades: Stop on close below/above the middle band
- Mean reversion trades: Stop 1 ATR beyond the band that was touched
Position Sizing by Setup Type
Not all setups carry equal probability. Size accordingly. Squeeze breakouts with volume confirmation on a trending day — full position size. Mean reversion against the broader trend — half size maximum. Never let a single day trade risk more than 1% of your trading capital, regardless of conviction level.
The Time Filter
Avoid Bollinger Bands signals in the first 15 minutes after market open. The 9:30-9:45 EST window is chaotic — bands are artificially wide from overnight gaps and opening volatility. The cleanest intraday setups develop between 10:00-11:30 EST and again between 2:00-3:30 EST. Watch the Stocks365 signals dashboard during these windows for real-time band squeeze alerts across multiple symbols.
Common Bollinger Bands Day Trading Mistakes
Trading the bands in isolation. Every outer band touch looks like an opportunity when you're staring at a chart. Add context. Add confirmation. Add a filter.
- Ignoring trend context: Mean reversion trades in trending markets destroy accounts
- Using the wrong timeframe: Signals on 1-minute charts are mostly noise
- Entering on band touch, not on close: Always wait for the candle to close
- Changing settings constantly: Stick with 20 periods, 2 standard deviations — the market has priced itself around these defaults
- Ignoring volume: A breakout without volume is a trap, not an opportunity
Optimal RSI settings pair with Bollinger Bands differently depending on the timeframe — the RSI settings guide covers exactly which period settings work best for intraday versus swing contexts.
What to Watch Right Now
- NVDA near $145-$148 range: Band width on the 15-minute chart has compressed to a 30-bar low — a squeeze setup is loading. Watch for a breakout candle above $148.50 with volume above 2M shares on the 15-minute bar. Check the NVDA signal page for live trust score confirmation.
- AAPL at the 20 SMA on the 1-hour chart around $224: Price is testing the middle band after a band ride from $219. A close below $223.50 signals the ride is over and a mean reversion to the lower band at $220.80 becomes the primary scenario.
- TSLA band ride watch: If TSLA breaks above $292 with two consecutive 5-minute closes above the upper band, the band ride setup activates. Middle band support sits near $288 — that's the pullback entry level for momentum traders. See live signals at TSLA signal page.
- MSFT squeeze forming on daily: The daily Bollinger Bands on MSFT have compressed significantly. An intraday 15-minute breakout in either direction will likely accelerate — watch for the daily setup to resolve before sizing up intraday band trades.
- AMZN RSI + lower band confluence: AMZN is approaching the lower Bollinger Band on the 15-minute chart while RSI reads 33. If a bullish engulfing candle forms at this confluence, the mean reversion target back to the middle band at $228.40 becomes high probability. Monitor at AMZN signals.
How Stocks365 Uses This
Stocks365 Bollinger Band Integration
Bollinger Bands are one of 12+ technical indicators powering the Stocks365 Trust Score system. Specifically, band squeeze conditions feed directly into the volatility scoring component — when band width drops below historical thresholds, the platform flags elevated breakout probability and adjusts signal confidence accordingly.
Band position relative to price (upper touch, lower touch, or middle band reclaim) contributes to the regime detection layer, helping the system distinguish between trending and mean-reverting market conditions for each individual symbol. This means when you view a signal for AAPL or NVDA on the Stocks365 dashboard, the Trust Score already accounts for whether the current Bollinger Band structure supports a trending or reverting setup — so you're not making that judgment call blind.
Band ride conditions (price repeatedly closing outside the outer band) increase the system's agreement score when momentum indicators like RSI confirm the trend direction. This multi-indicator agreement is what separates high-trust signals from borderline setups on the platform.
Key Takeaways
Bollinger Bands Day Trading — Summary
- The squeeze setup is the highest-probability Bollinger Bands day trading play — wait for the breakout candle, confirm with volume
- Band rides signal strong trends — don't fade them, ride them until a middle band close confirms the end
- Mean reversion trades only work in confirmed ranging markets — get the context right first
- The 15-minute chart is the optimal timeframe for intraday Bollinger Bands setups
- Always combine Bollinger Bands with RSI or another momentum oscillator — neither indicator works as well alone
- Stop placement goes on the middle band for breakout and ride trades, 1 ATR beyond the outer band for reversals
- Avoid signals in the first 15 minutes of market open — wait for the chaos to settle
- Volume confirmation separates real breakouts from false ones — never skip this filter