
Why the Bollinger Bands RSI Strategy Works
Most indicators lie when used alone. Bollinger Bands tell you where price is relative to volatility. RSI tells you whether momentum supports that move. Together, they build a filter that standalone signals simply cannot match.
The core idea is straightforward. Bollinger Bands mark extreme price extensions. RSI confirms whether those extremes carry momentum or represent exhaustion. When both agree, the probability of a meaningful move rises sharply.
This combination has survived decades of market evolution — from floor trading to algorithmic dominance — because it addresses two separate questions at once: Where is price stretched? and Is momentum confirming that stretch?
Understanding the Building Blocks
What Bollinger Bands Actually Measure
Bollinger Bands consist of three lines: a 20-period simple moving average (the middle band), and upper and lower bands plotted two standard deviations above and below it. The bands expand during volatile periods and contract during calm ones.
Price touching the upper band doesn't mean sell. Price touching the lower band doesn't mean buy. That's the most important thing to understand before combining them with anything else.
What the bands measure is relative price extension within the current volatility regime. A touch of the upper band in a trending market often precedes another leg higher. The same touch during a range-bound session often leads to a reversal. Context is everything.
RSI as a Momentum Confirmation Tool
The Relative Strength Index measures the speed and magnitude of recent price changes, outputting a value between 0 and 100. Readings above 70 are traditionally considered overbought. Readings below 30 are considered oversold. If you need a full breakdown of the calculation, the RSI formula explained step by step covers every variable in detail.
In the context of the Bollinger Bands RSI strategy, RSI acts as a gatekeeper. It filters out band touches that occur without momentum backing — the setups most likely to fail.
For a deeper foundation, the complete beginner's guide to RSI is worth reading before combining it with bands. Understanding the indicator alone first always produces better results when layering strategies.
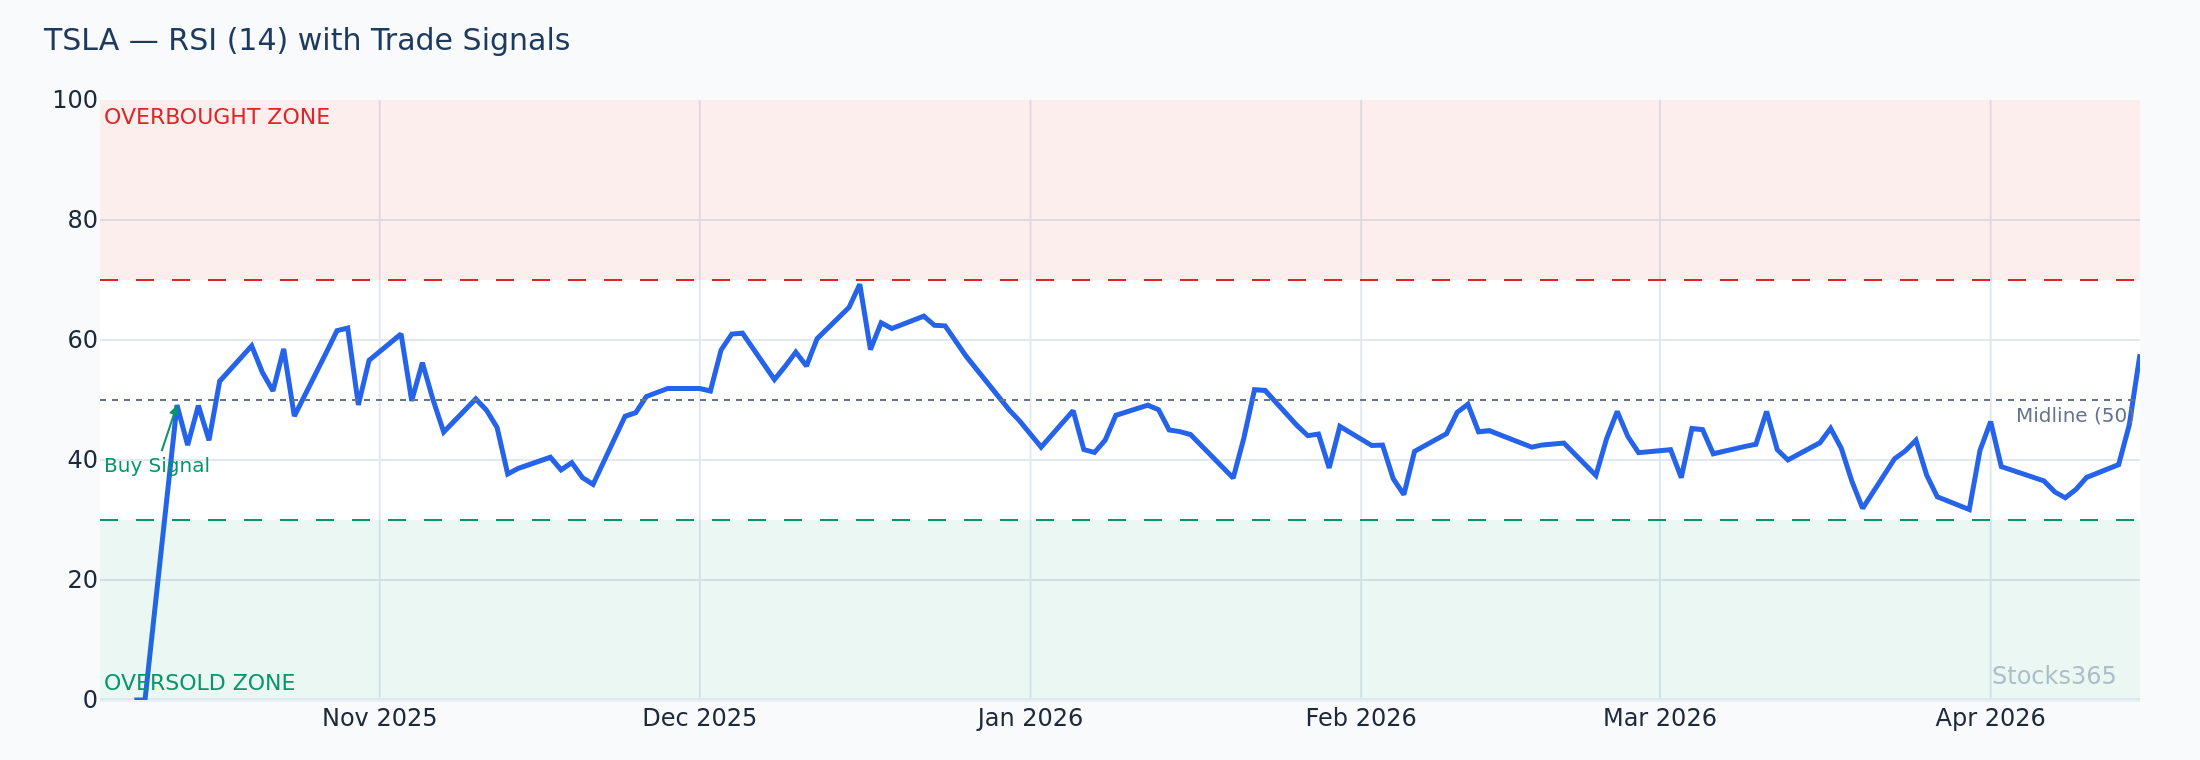
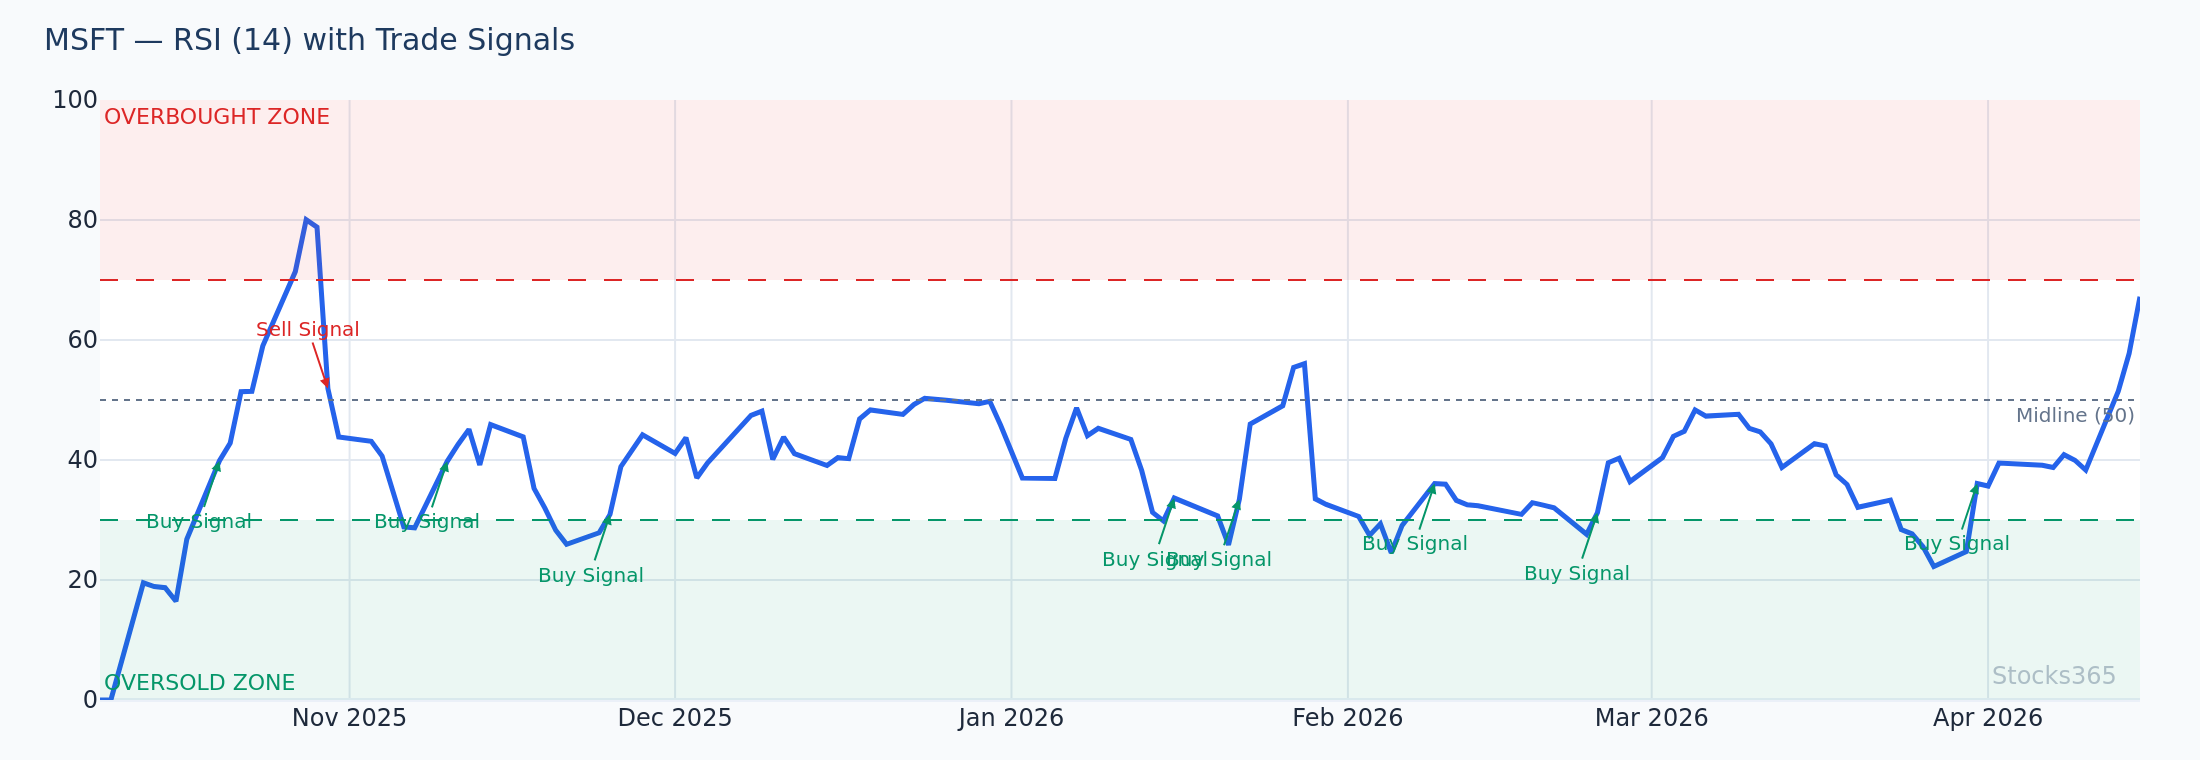
This chart shows price reaching the lower Bollinger Band while RSI simultaneously drops toward the 30 level. When RSI holds above 30 and turns up as price touches the band, the setup is active. A close back above the 20-SMA confirms the entry. If RSI breaks below 30 and continues falling, the band touch is not a reversal signal — it's a breakdown.
The Core Bollinger Bands RSI Strategy: Entry Rules
Bullish Entry Setup
Four conditions must align for a high-probability long entry:
- Price touches or closes below the lower Bollinger Band — the volatility extreme is in place
- RSI is between 25 and 40 — oversold territory, but not collapsing further
- RSI turns upward — momentum shifts before price does
- The next candle closes above the lower band — price reclaims the band, confirming the move
Entry on the close of that confirming candle. Not before. Patience here separates profitable traders from those who repeatedly catch falling knives.
Bearish Entry Setup
The mirror image applies for short entries:
- Price touches or closes above the upper Bollinger Band
- RSI is between 60 and 75 — elevated but showing signs of stalling
- RSI turns downward — momentum peaks before price does
- The next candle closes back inside the upper band — the extension is rejected
The rejection candle is the trigger. A bearish engulfing or shooting star at the upper band with RSI rolling over is one of the cleanest setups this strategy produces.
Here RSI peaks above 70 while price tags the upper band, then both indicators reverse simultaneously. The confirming bar closes back inside the bands with a visible upper wick. That's the entry signal — short on the close of the rejection candle. The setup is invalidated if price reclaims the upper band on the next session, which would signal a genuine breakout rather than exhaustion.
Exit Rules: Taking Profit and Cutting Losses
Profit Target Logic
The most logical profit target for this strategy is the middle band — the 20-SMA. In mean-reversion setups, price tends to gravitate back toward the average after touching an extreme. This gives you a clearly defined, mathematically grounded target that doesn't require guessing.
For stronger trending setups, the opposite band becomes the target. If price bounces from the lower band with strong RSI confirmation and expanding volume, the upper band is a realistic objective. Scale out partially at the middle band and let the remainder run.
Stop Loss Placement
Stop losses belong on the other side of the band touch. For long entries, the stop sits below the lowest wick that touched the lower band. For short entries, it sits above the highest wick that touched the upper band. Simple. Systematic. Non-negotiable.
Here's what most traders get wrong: they place stops at arbitrary round numbers instead of using the band structure. If the setup is valid, price should not re-touch the band after confirmation. Any re-test that closes outside the bands invalidates the mean-reversion thesis immediately.
RSI Exit Signals
RSI also generates exit signals worth watching. For long trades, close the position if RSI reaches 60–65 without price reaching the middle band — this signals momentum fading mid-move. For short trades, close if RSI drops back to 40–45 without completing the expected move lower.
The RSI exit rule prevents holding losing positions through false setups. It's an early warning system built directly into the strategy.
The Bollinger Squeeze: A High-Probability Add-On
The Bollinger Squeeze occurs when band width contracts to its lowest level in months. Volatility compression always precedes expansion. The question is direction.
This is where RSI earns its keep in the combined strategy. During a squeeze, RSI positioning tells you which direction is more likely to win the breakout. RSI holding above 50 during compression favors an upside break. RSI below 50 favors a downside break.
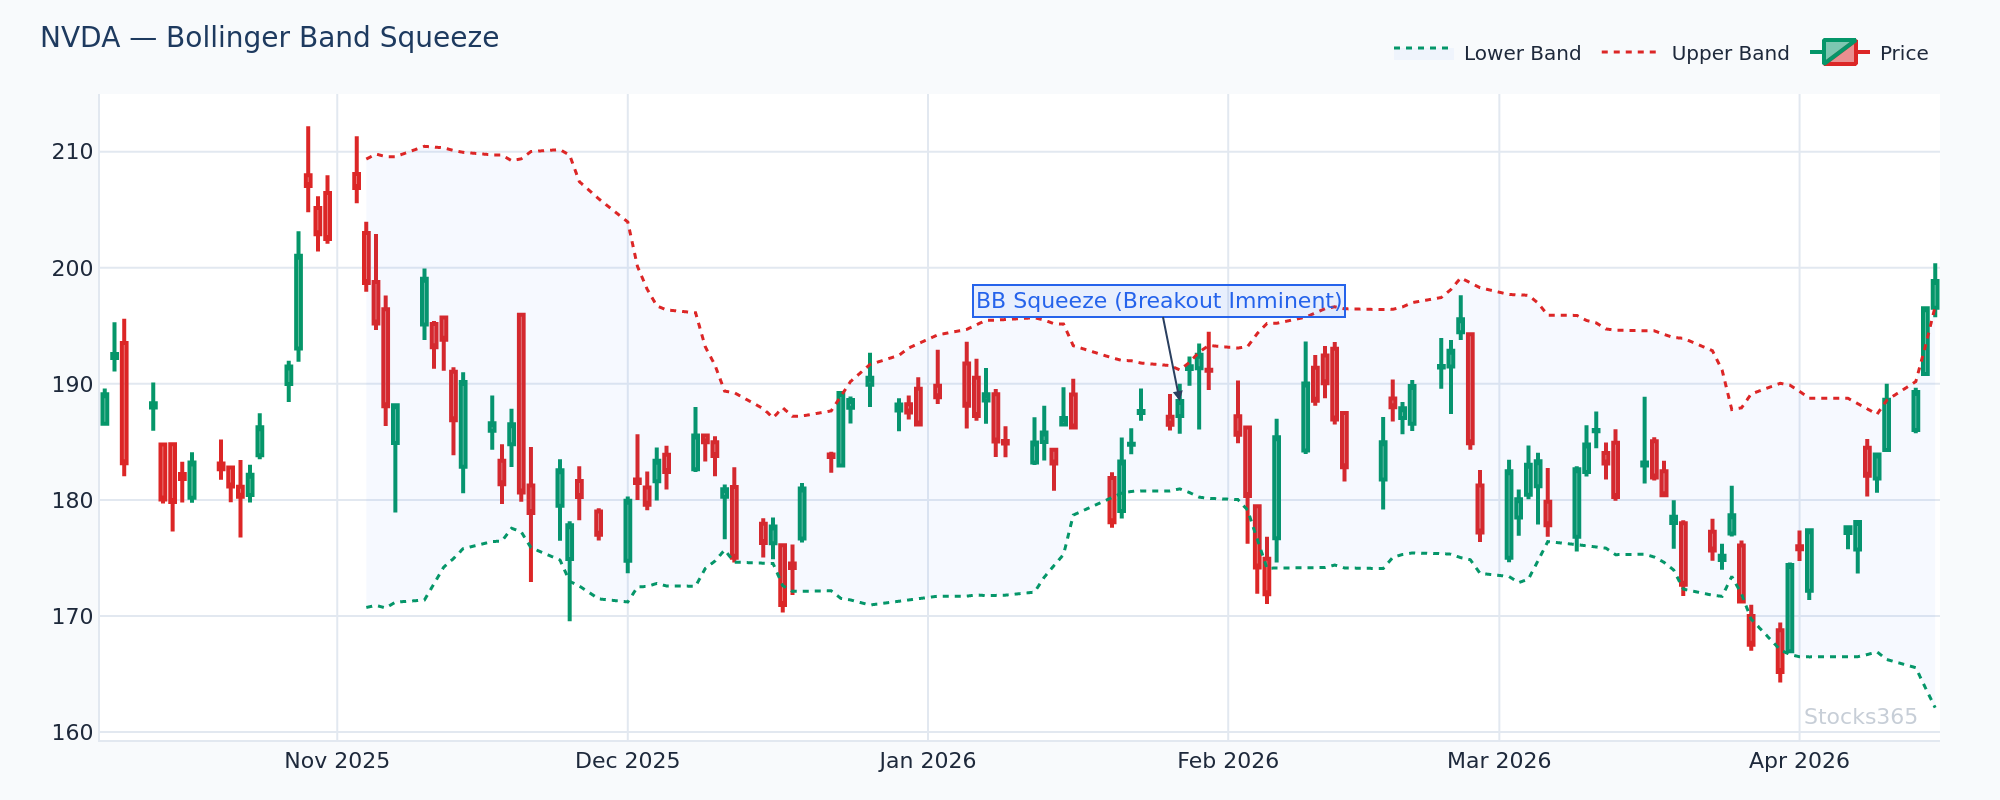
This chart shows band width at multi-month lows — the squeeze is active. RSI holds above 55 throughout the compression, indicating persistent bullish momentum beneath the surface. When the bands begin expanding and price breaks above the upper band with RSI clearing 60, the breakout direction is confirmed. The setup fails if price breaks below the lower band instead, particularly if RSI simultaneously drops below 45.
Watch for Bollinger squeeze breakouts on high-beta stocks — when band width drops below the 20th percentile of its 52-week range, the subsequent expansion frequently produces a 2–3 ATR move within 5–10 sessions. This is the highest reward-to-risk variant of the entire strategy.
RSI Divergence as a Powerful Entry Filter
Adding divergence analysis to the Bollinger Bands RSI strategy transforms it from reactive to anticipatory. When price makes a new low below the lower band but RSI makes a higher low — that's bullish divergence. The selling pressure is exhausting itself while price still appears to be falling.
This divergence pattern, when it appears at the lower Bollinger Band, is among the most reliable reversal signals available. For a comprehensive breakdown of how to identify and trade these patterns, the RSI divergence guide walks through every scenario in detail.
Hidden divergence adds another layer for trend-continuation entries. RSI hidden divergence at the middle band during a pullback is one of the cleanest trend-following entries this strategy produces — often overlooked because it's less intuitive than the reversal version.
Price prints a lower low below the band while RSI shows a clearly higher low — classic bullish divergence. The divergence alone is not the entry; wait for the confirming close back above the lower band. Once that confirmation arrives, the divergence pattern validates the trade. If price continues making lower lows with RSI also declining, the divergence reading is false — exit immediately and reassess.
Timeframe Optimization for the Bollinger Bands RSI Strategy
Which Timeframes Work Best
The strategy performs differently across timeframes. On the daily chart, band touches carry more statistical weight because more participants are watching and reacting to those levels. On intraday charts, noise increases and false signals multiply.
Daily charts: best for swing traders holding 3–10 days. The 20-period Bollinger Band and standard 14-period RSI are appropriate defaults. For guidance on adjusting RSI periods for different approaches, the RSI settings guide covers this thoroughly.
4-hour charts: suitable for active traders who want more signals without the noise of shorter timeframes. Consider tightening RSI thresholds — use 35 for oversold and 65 for overbought instead of the standard 30/70.
Weekly charts: fewer signals, higher reliability. A weekly lower-band touch with RSI near 30 is a significant event. These setups are rarer but often precede major reversals.
Multi-Timeframe Confirmation
The strongest setups show alignment across two timeframes. A daily lower-band touch with RSI near 30 carries more conviction when the weekly chart also shows RSI at depressed levels. This multi-timeframe agreement is how institutional traders filter for high-conviction entries.
Asset Class Differences: Stocks, Crypto, and Commodities
The strategy doesn't behave identically across all markets. Understanding these differences prevents misapplied signals.
Stocks respond well to mean-reversion band touches because they trade within earnings cycles, valuation anchors, and sector rotations that naturally create oscillating behavior. Crypto exhibits higher volatility, which means band touches happen more frequently and with more extension — the outer bands may need widening to 2.5 standard deviations to reduce noise.
Commodities are trend-driven for extended periods. Mean-reversion signals at the bands often fail in commodities because fundamental supply/demand dynamics override technical extremes. Use the strategy here primarily for momentum continuation setups rather than reversals.
Our analysis of 3,255 Bollinger Upper Band Touch signals found a 49.6% win rate with a profit factor of 0.88 over a 10-day holding period — with crypto performing best at 56.7% and commodities worst at 41.5% (see full dataset). This data confirms the asset class differentiation is real and needs to be accounted for in position sizing and signal filtering.
Combining Bollinger Bands RSI with Volume Confirmation
Volume is the strategy's missing piece. A lower-band touch with RSI near 30 and volume surging 2x the 20-day average creates a three-factor confirmation signal. High volume at extremes typically signals capitulation — sellers exhausted, buyers stepping in.
Conversely, a band touch on declining volume is suspicious. It suggests price drifted to the extreme without conviction — either direction. These setups fail more often and deserve smaller position sizes or outright avoidance until volume confirms.
The ultimate RSI trading guide covers volume integration in detail alongside several other confirmation techniques worth layering into this approach.
Avoiding the Most Common Mistakes
Here's what most traders get wrong with this strategy: they treat every band touch as a signal. They see price hit the lower band, check that RSI is somewhere below 50, and enter immediately. That's not the strategy — that's hope dressed up as a system.
The RSI confirmation requirement exists precisely to filter the 40–50% of band touches that simply mark continuation moves lower during real downtrends. Without the RSI turn, you're buying into selling momentum. With it, you're buying into exhaustion. The difference is everything.
Two other common errors:
- Ignoring the trend context: In a strong downtrend, lower-band touches are continuation signals more often than reversals. Add a 200-SMA filter — only take long mean-reversion signals when price is above the 200-SMA.
- Over-optimizing RSI levels: Adjusting RSI thresholds to 28 or 32 based on backtests is curve-fitting. Stick with standard levels and let the confirming price action do the filtering work.
For a calibrated look at how overbought and oversold RSI levels actually function across different market conditions, the RSI overbought and oversold signals guide breaks down the nuances precisely.
Discipline wins. The setup is either valid or it isn't.
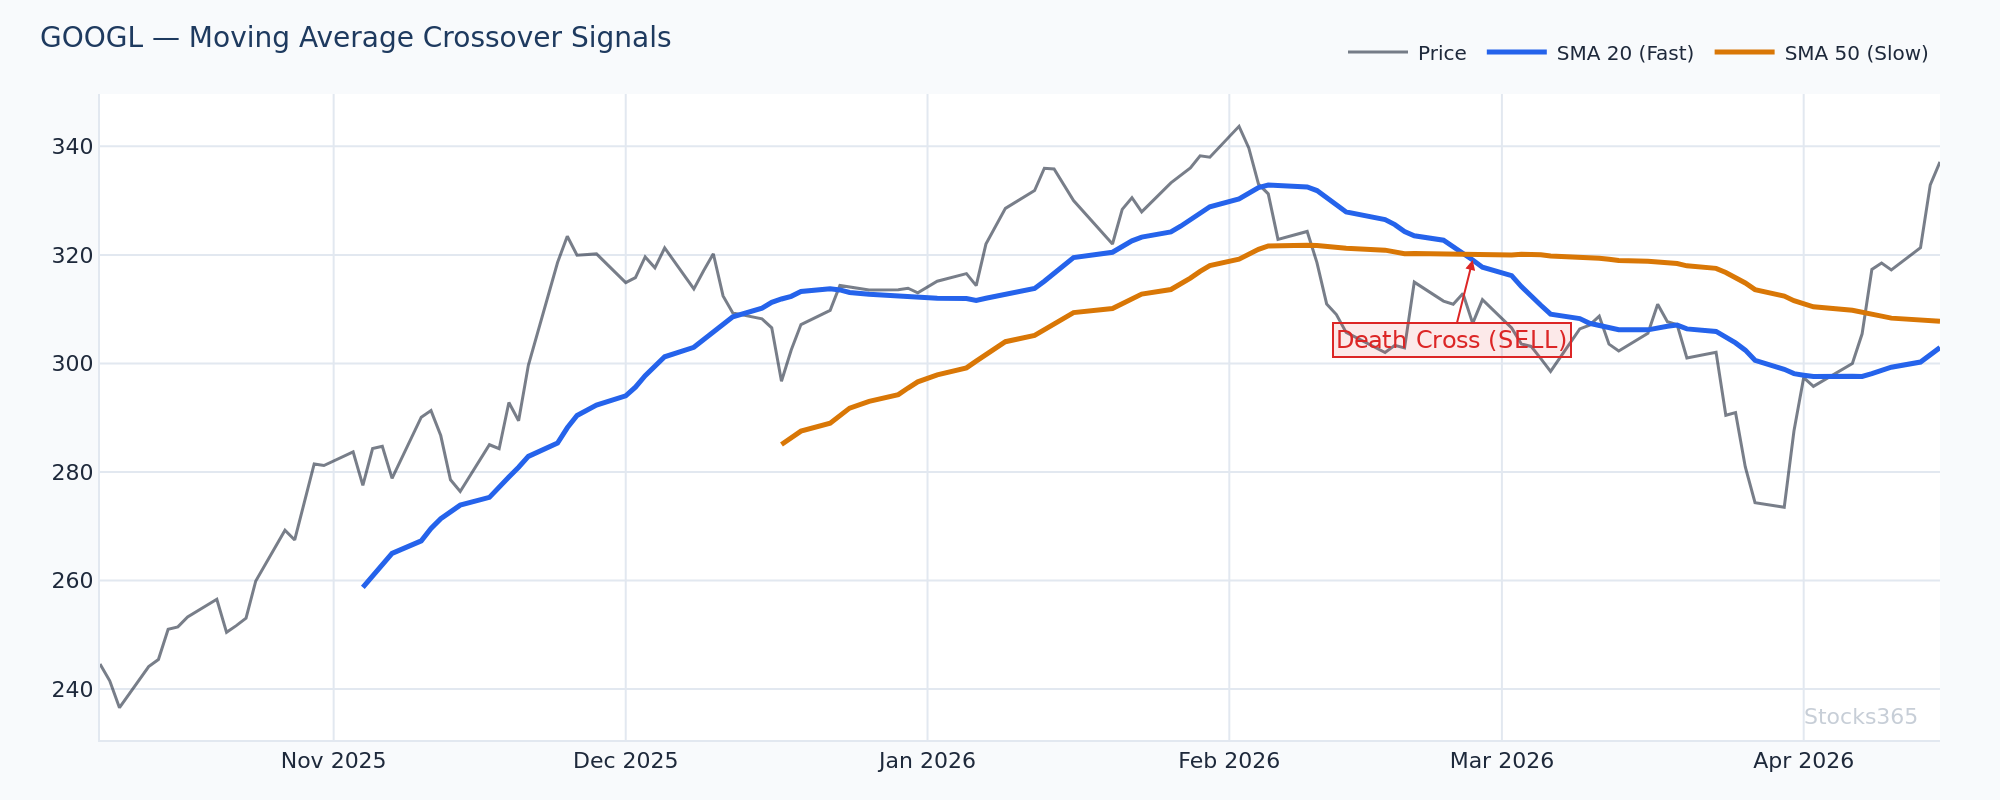
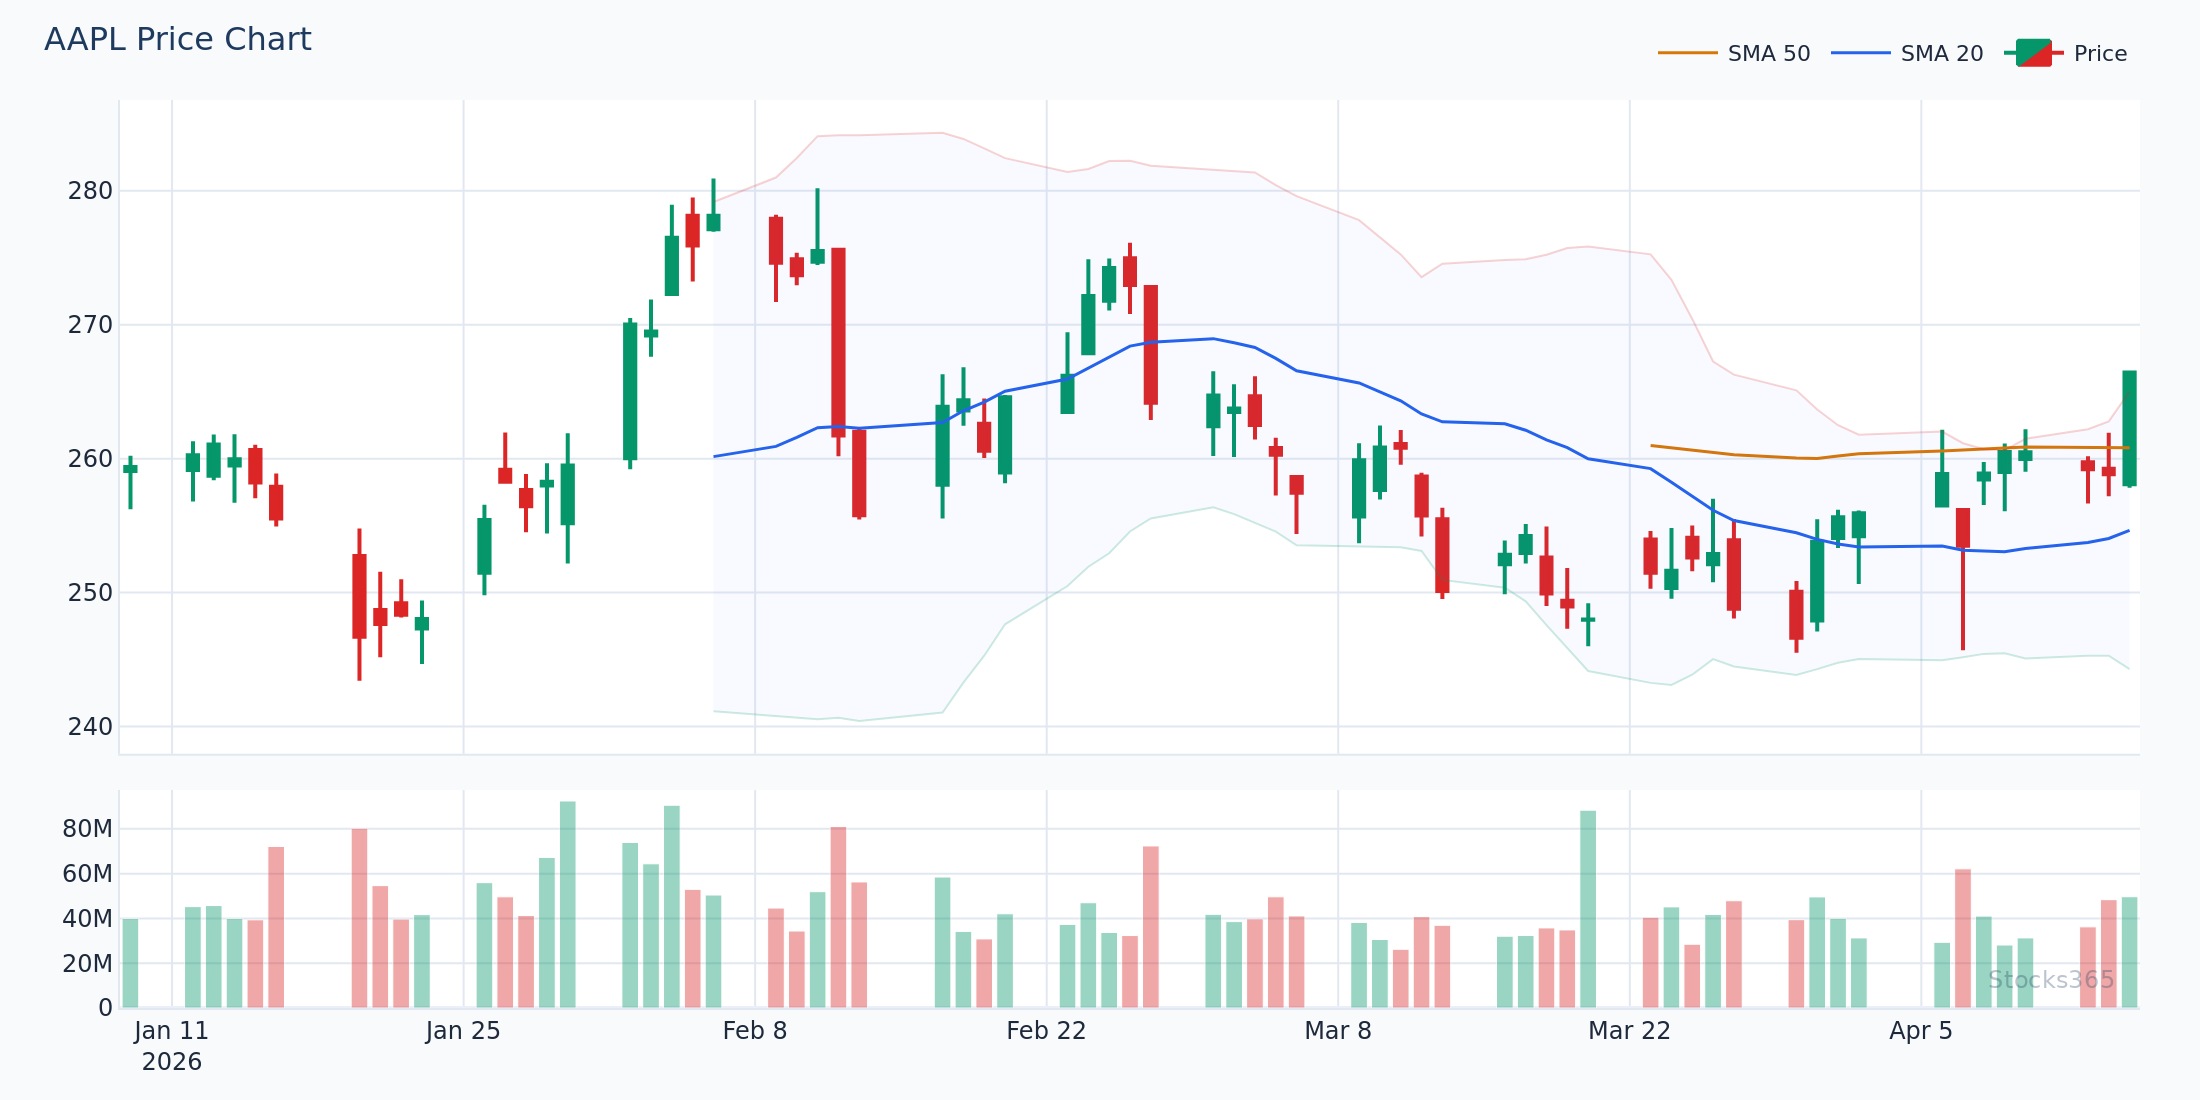
This chart illustrates the 200-SMA as a directional filter. Price is clearly above the 200-SMA, qualifying lower-band touches as potential mean-reversion longs rather than continuation shorts. When a lower-band touch occurs with RSI turning up from near 30, the setup is active. If price were below the 200-SMA, the same signal would be disqualified for long entries — a critical distinction that separates mean-reversion from trend-following contexts.
What to Watch For
- Bollinger squeeze breakouts on high-beta tech stocks: When band width drops below the 20th percentile of its 12-month range, the next expansion frequently produces a 2–3 ATR directional move. RSI positioning above or below 50 during the squeeze biases the breakout direction.
- Bullish RSI divergence at the lower band after extended downtrends: When price makes successive lower lows while RSI makes higher lows at or near the 30 level, a reversal setup is forming. Wait for the confirming close back inside the band before entering.
- Upper-band rejection with RSI rolling over from above 70 on weekly charts: Weekly timeframe rejections carry significantly more weight than daily signals. These setups are rarer but often precede multi-week corrections worth trading from the short side.
- Lower-band touches on quality stocks during broad market drawdowns of 10%+: Sector leaders that touch lower bands during index corrections with RSI near 30 frequently recover faster and further than the index itself — these are among the highest-conviction mean-reversion setups the strategy produces.
- Mid-band RSI hidden divergence during pullbacks in uptrends: When price pulls back to the 20-SMA middle band and RSI shows a higher low on a shorter timeframe, the trend-continuation entry is active. This setup works best when the initial trend move was accompanied by above-average volume.
How Stocks365 Uses This
How Stocks365 Integrates the Bollinger Bands RSI Strategy
The Stocks365 trust score system evaluates signals across 12+ technical indicators, and both Bollinger Band positioning and RSI readings are core inputs. When a signal appears on the signals dashboard, the trust score reflects whether multiple indicators — including band position and RSI momentum direction — are in agreement.
Specifically, Bollinger Band width contributes to the platform's volatility regime scoring. Narrow bands flag low-volatility compression states where breakout signals carry elevated weight. RSI contributes to the momentum agreement layer — when RSI direction aligns with the band signal, the trust score increases. When they diverge, the score is reduced, flagging the signal as lower-conviction.
For individual stock signals like AAPL, the trust score incorporates whether a band touch is accompanied by RSI confirmation or contradicted by it. This prevents the platform from surfacing raw band touches as actionable signals without momentum validation — exactly the filter that separates profitable applications of this strategy from unprofitable ones. Stocks365 research across 3,042 RSI Momentum Shift Up signals found a 51.9% win rate on stocks specifically — reinforcing why stock-focused signals with RSI momentum alignment receive elevated trust scores on the platform (full dataset here).