
Bollinger Bands Settings: The Complete Customization Guide for Every Trading Style
Few technical indicators are as versatile — or as widely misunderstood — as Bollinger Bands. Most traders fire up their charting platform, leave the default Bollinger Bands settings in place, and wonder why their signals feel inconsistent. The truth? Default settings are a starting point, not a destination. The moment you align your Bollinger Bands configuration with your actual trading style, timeframe, and asset class, everything changes.
In this guide, we'll break down exactly how Bollinger Bands work under the hood, walk through every meaningful setting you can adjust, and give you concrete configurations for scalpers, day traders, swing traders, and long-term position traders. We'll also show you how to combine Bollinger Bands with momentum indicators — like the RSI — to dramatically improve signal quality.
Quick Note: If you're using Stocks365's signals dashboard, you'll see Bollinger Band squeeze and breakout signals already filtered through our proprietary trust score system — meaning low-quality setups are automatically downweighted before they reach you.
What Are Bollinger Bands? A Quick Refresher
Developed by John Bollinger in the 1980s, Bollinger Bands consist of three lines plotted on a price chart:
- Middle Band: A simple moving average (SMA), typically 20 periods
- Upper Band: Middle Band + (Standard Deviation × Multiplier)
- Lower Band: Middle Band − (Standard Deviation × Multiplier)
The bands dynamically expand and contract based on market volatility. When price action is calm, the bands tighten into what traders call a squeeze. When volatility explodes, the bands widen. This self-adjusting nature is what makes Bollinger Bands so powerful across different market conditions — but it also means your Bollinger Bands settings need to match the volatility profile of the instrument you're trading.
The Three Core Bollinger Bands Settings You Can Adjust
Before diving into style-specific configurations, let's understand each adjustable parameter and what it actually controls.
1. The Period (Length)
The period controls how many candles are used to calculate the middle band's simple moving average. The default is 20 periods, which works reasonably well on daily charts for swing traders. But here's what changing it actually does:
- Shorter periods (10–15): The bands react faster to price changes. More signals are generated, but there's more noise and more false breakouts. Ideal for scalpers and aggressive intraday traders.
- Default period (20): Balanced sensitivity. Works well for swing trading on daily charts and intraday trading on 1-hour charts.
- Longer periods (50–200): The bands move slowly, filtering out short-term noise. Fewer signals, but higher quality. Used by position traders and investors tracking macro trends.
2. The Standard Deviation Multiplier
The standard deviation multiplier determines how far the upper and lower bands sit from the middle band. The default is 2.0, which statistically means roughly 95% of price action should fall within the bands under normal distribution conditions. Adjusting this parameter changes how "tight" or "wide" the bands are:
- 1.5 multiplier: Bands are tighter. Price touches the bands more frequently, generating more signals. Higher noise risk.
- 2.0 multiplier (default): Industry standard. Good balance between signal frequency and quality.
- 2.5–3.0 multiplier: Bands are wider. Only extreme price moves touch the bands. Used for identifying truly exceptional overbought/oversold conditions in volatile assets like crypto or high-beta stocks.
3. The Moving Average Type
Most platforms default to a Simple Moving Average (SMA) for the middle band. However, some traders substitute an Exponential Moving Average (EMA), which gives more weight to recent prices. The EMA version makes the middle band more reactive, which can be useful for momentum traders but may generate more whipsaws in choppy markets.
For most traders, keeping the SMA is the right call. If you want faster signals, adjusting the period is a cleaner approach than switching to EMA.
Bollinger Bands Settings by Trading Style
Now let's get into the practical configurations. These are battle-tested setups used by professional traders in 2026's market environment.
Scalping: Settings for 1-Minute and 5-Minute Charts
Scalpers need fast-reacting bands that can capture micro price movements. The challenge is avoiding the noise that comes with hyper-sensitive settings.
Recommended Scalping Settings:
- Period: 10
- Standard Deviation: 1.5
- Timeframe: 1-minute or 5-minute charts
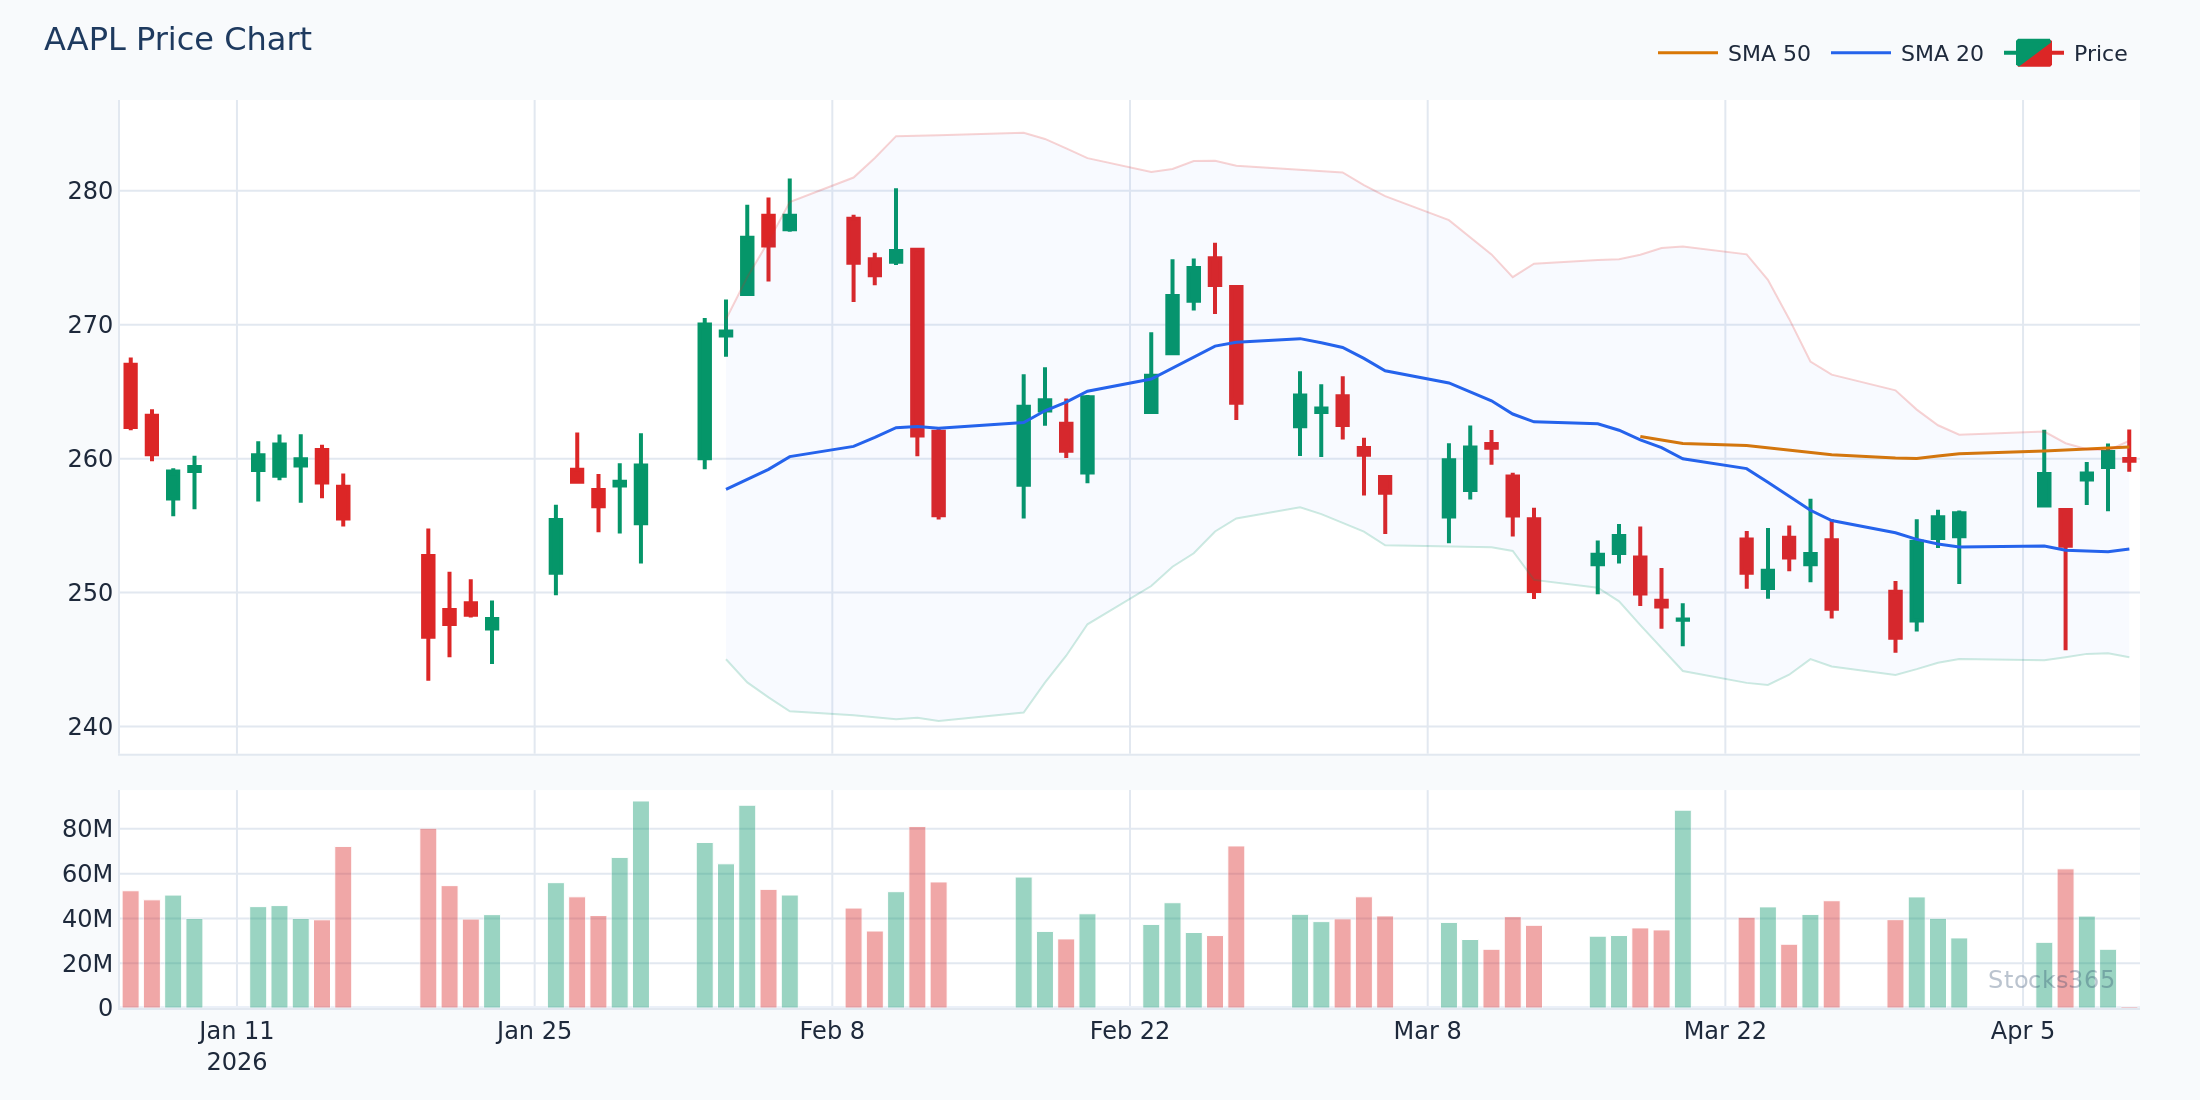
- Best for: High-liquidity large-caps like AAPL or MSFT during peak market hours
With these settings, the bands will hug price closely and expand rapidly on any burst of volatility. Scalpers look for price to touch or pierce the lower band as an entry signal, then exit near the middle band (mean reversion). Stop losses should be placed just beyond the band that was touched.
Important: At 1.5 standard deviations, expect price to breach the bands roughly 30% of the time under normal conditions. This is much higher than the default, so you'll see more signals — and more false ones. Always confirm with a momentum filter.
Day Trading: Settings for 15-Minute and 1-Hour Charts
Day traders benefit most from the default or slightly adjusted settings, as the 20-period SMA provides a reliable mean to trade around across a full trading session.
Recommended Day Trading Settings:
- Period: 20
- Standard Deviation: 2.0
- Timeframe: 15-minute or 1-hour charts
- Best for: Momentum stocks, ETFs, or futures during active sessions
The classic day trading approach with these settings is the Bollinger Band Bounce: in a range-bound market, price tends to bounce between the upper and lower bands. On a 1-hour TSLA chart using these settings, for example, you might observe price touching the lower band at $240.50, followed by a mean reversion toward the 20 SMA at $248.00 — a clean 7-point intraday move.
For trend-following day traders, a break above the upper band on expanding volume signals continuation strength. The middle band then acts as dynamic support during pullbacks.
Swing Trading: Settings for Daily Charts
Swing traders holding positions for 3–10 days have the luxury of waiting for high-quality setups. The standard 20/2.0 configuration works well here, but many experienced swing traders prefer a slightly longer period to filter out daily noise.
Recommended Swing Trading Settings:
- Period: 20 (standard) or 30 (noise-filtered)
- Standard Deviation: 2.0
- Timeframe: Daily charts
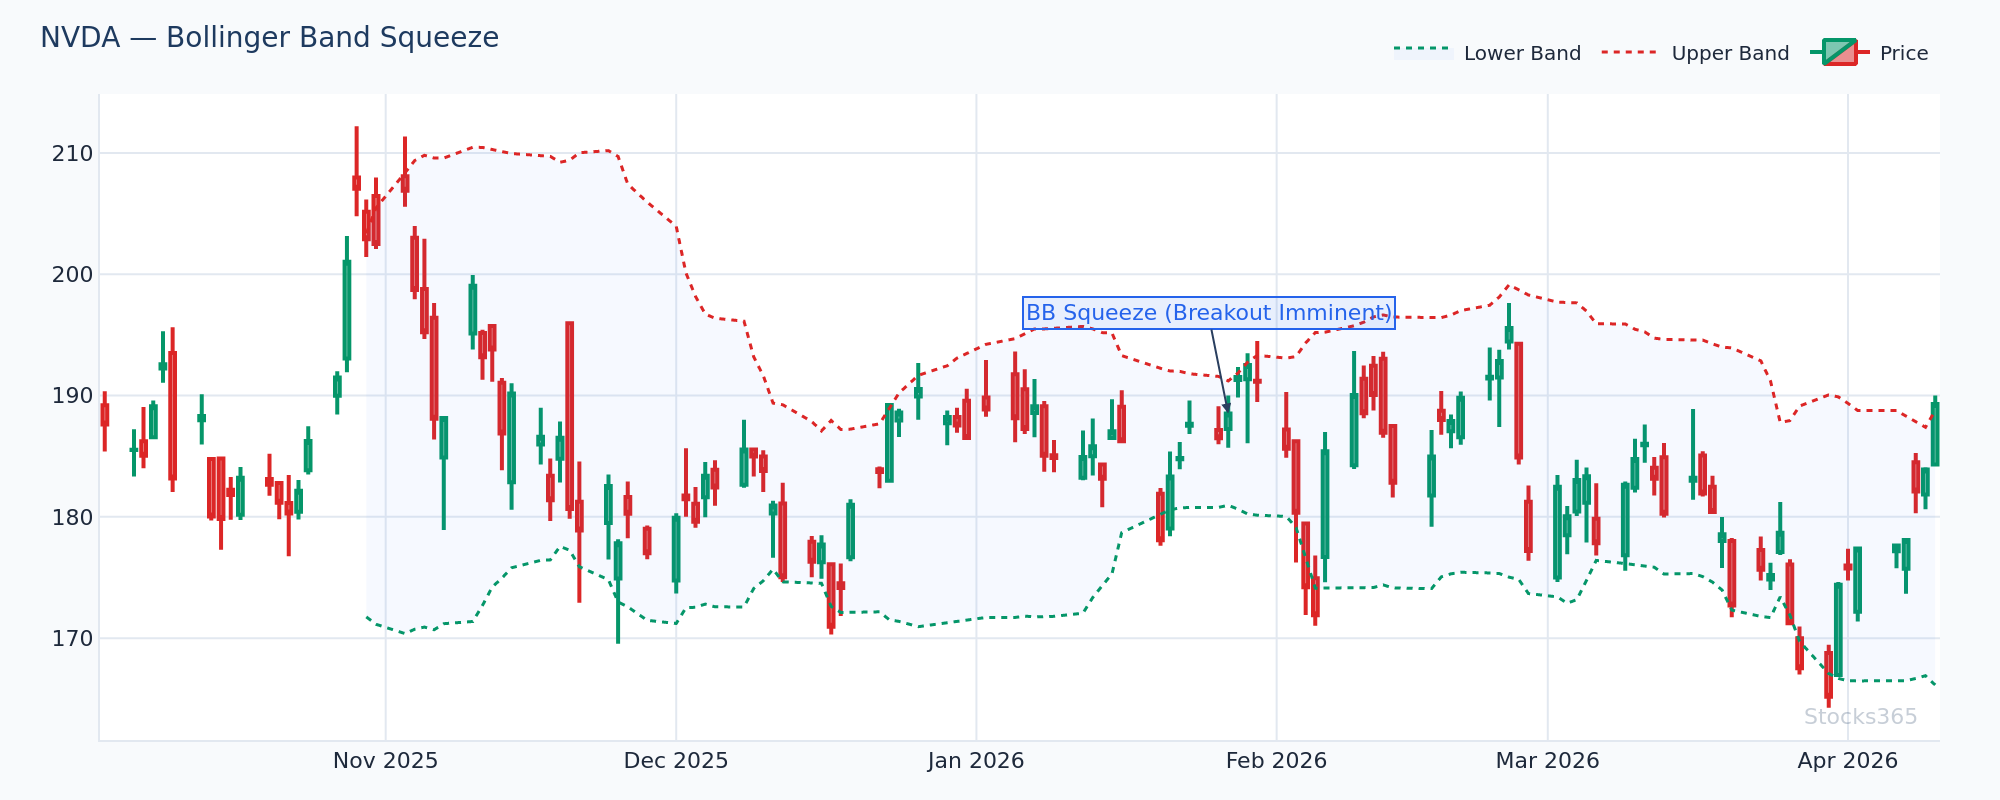
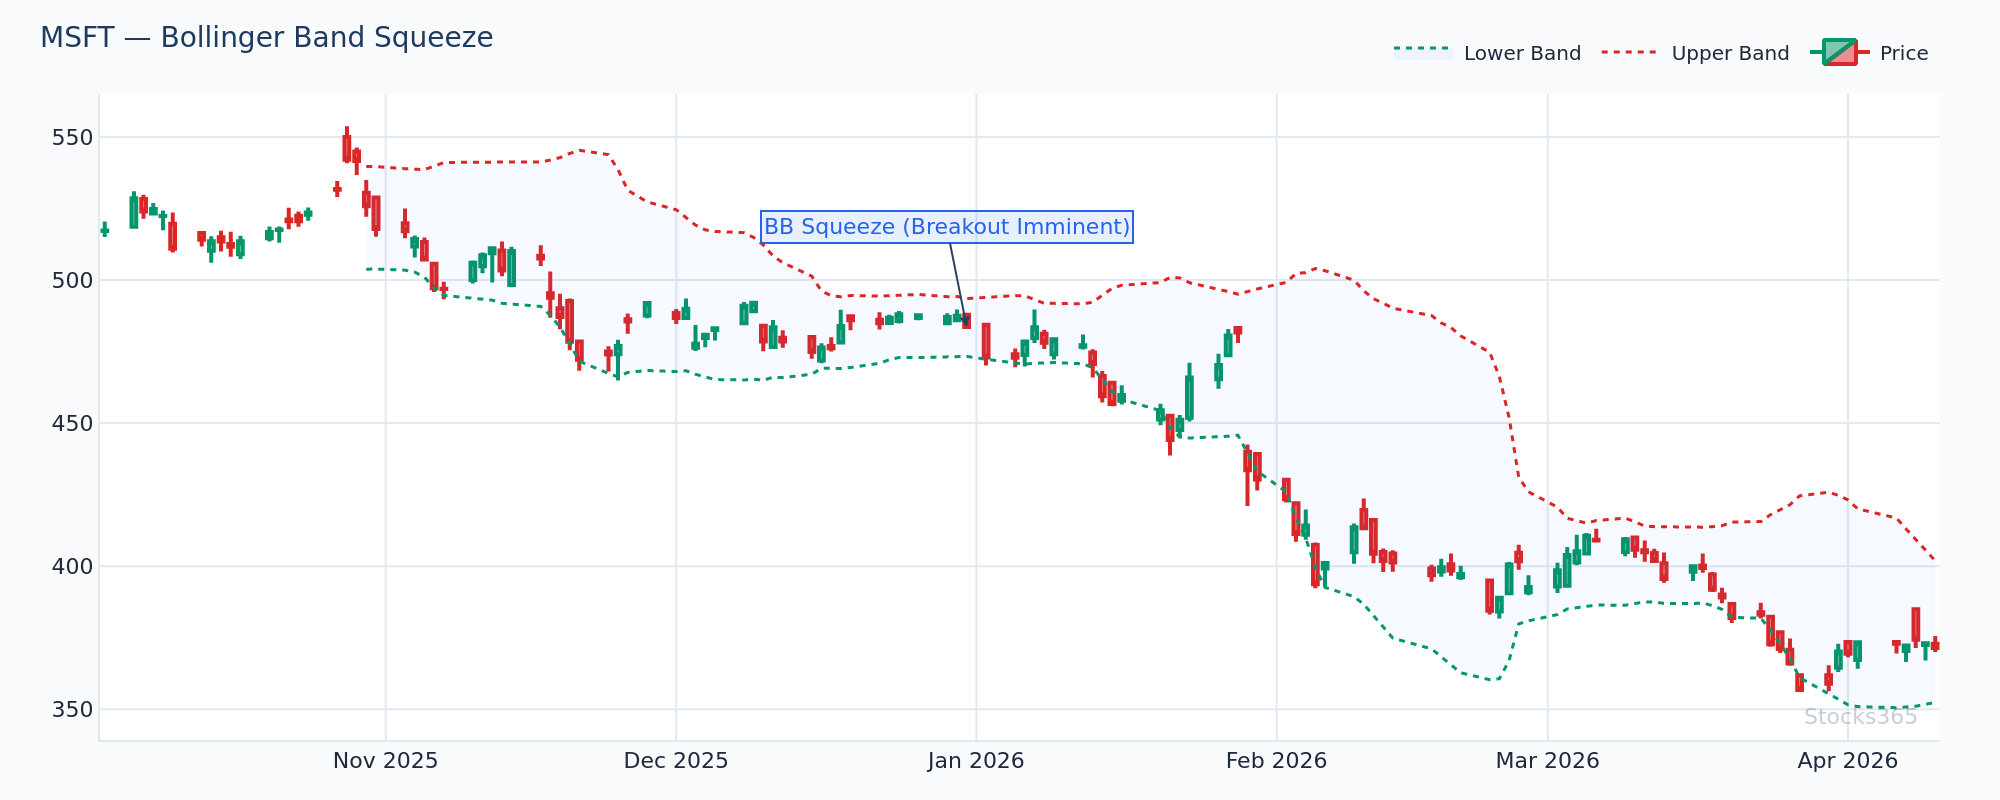
- Best for: Stocks with clear trend structure — consider checking NVDA's daily setup
On a daily MSFT chart in early 2026, a 20-period Bollinger Band setup might show the stock consolidating for 10 days inside a tightening band formation (the squeeze). When the bands begin expanding and MSFT closes above the upper band at $420.00, that's the swing entry signal. A measured target would be the distance from the middle band to the upper band, projected upward — roughly $15–20 in this scenario.
Position Trading: Settings for Weekly Charts
Long-term traders need Bollinger Bands that filter out weeks of noise and only flag genuinely significant price events. This means using a longer period with a wider standard deviation.
Recommended Position Trading Settings:
- Period: 50
- Standard Deviation: 2.5
- Timeframe: Weekly charts
- Best for: Blue-chip stocks, index ETFs, macro trend analysis
With a 50-period weekly setting, the middle band becomes a meaningful long-term trend filter. A weekly close below the lower band at 2.5 standard deviations signals extreme oversold territory — the kind of event that occurs only a few times per year even in volatile markets. These are high-conviction entry points for patient investors.
Combining Bollinger Bands with RSI: The Power Combination
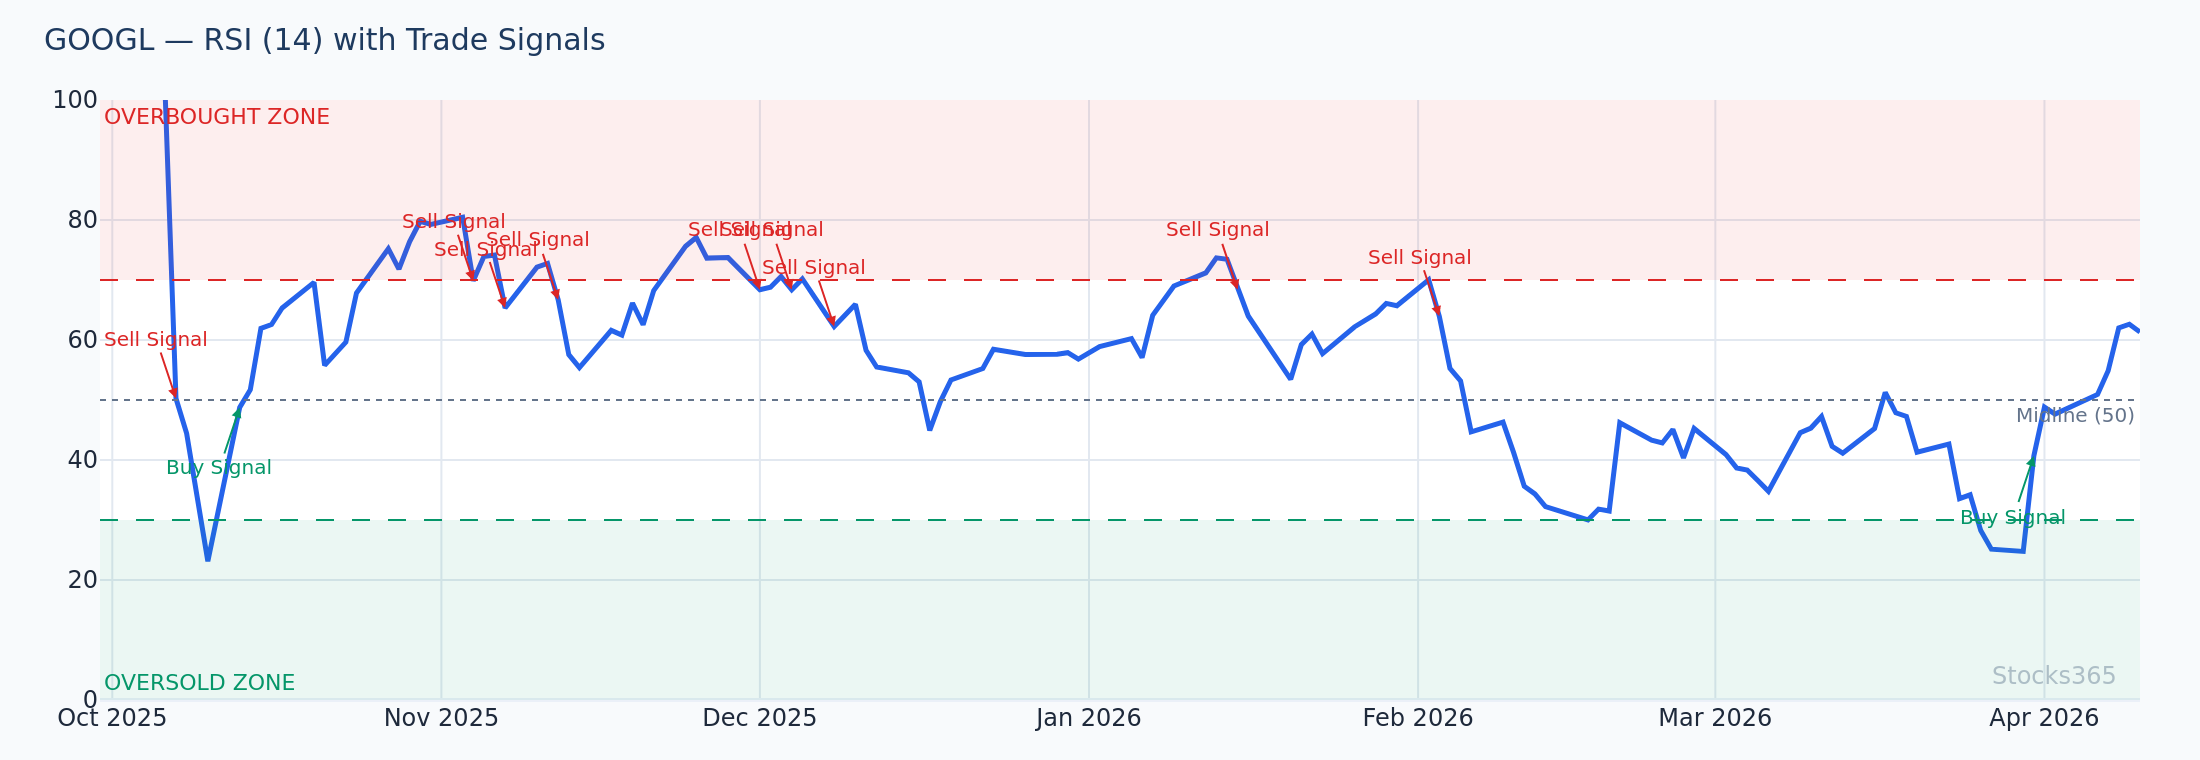
Bollinger Bands excel at identifying when price is at an extreme relative to recent volatility. What they don't tell you is whether momentum supports a reversal or continuation. That's where pairing them with a momentum oscillator like the RSI becomes invaluable.
The combination logic is straightforward:
- Bullish setup: Price touches or closes below the lower Bollinger Band and RSI is at or below 30 (oversold). Both indicators confirm exhaustion of selling pressure.
- Bearish setup: Price touches or closes above the upper Bollinger Band and RSI is at or above 70 (overbought). Both confirm exhaustion of buying pressure.
- Divergence bonus: If RSI shows bullish divergence while price is at the lower band, the reversal probability increases significantly.
If you're new to using RSI alongside price-based indicators, the ultimate RSI trading guide is an excellent companion resource. And if you're unsure whether RSI or Stochastic is the better complement to your Bollinger Bands setup, the RSI vs Stochastic comparison breaks down the key differences in detail.
One often-overlooked tactic is watching for hidden RSI divergence when price is squeezing inside the bands. This can telegraph the direction of the eventual breakout before the bands even begin to expand.
Advanced Bollinger Band Techniques for 2026 Markets
The Bollinger Band Squeeze: Timing Explosive Moves
The squeeze is arguably the most powerful Bollinger Bands setup available. It occurs when the bands contract to their narrowest point relative to recent history, indicating a period of low volatility that almost always precedes a significant directional move.
To quantify a squeeze, many traders use the Bandwidth indicator — calculated as (Upper Band − Lower Band) / Middle Band × 100. When bandwidth falls to a multi-month low, a squeeze is confirmed. The trade is not entering on the squeeze itself, but waiting for the breakout direction to be established (typically a close outside the bands with volume expansion), then entering on the first pullback to the middle band.
Walking the Bands: Trend Continuation Signals
In strong trends, price can "walk" along the upper or lower band for extended periods. Many inexperienced traders mistake this for an extreme reading and fade the trend, getting stopped out repeatedly. The key distinction: in a healthy uptrend, price touching or briefly exceeding the upper band on rising volume is a sign of strength, not a reversal signal.
Confirmation that a band-walk is legitimate (not just a blowoff top) includes:
- The middle band sloping upward (for upper band walks)
- RSI holding above 50 without diverging (check RSI overbought levels for nuance here)
- Volume expanding on up-candles and contracting on pullbacks
Double Bollinger Bands: A Professional Variant
Some institutional traders and advanced retail traders use two sets of Bollinger Bands simultaneously — one at 2.0 standard deviations and one at 1.0 standard deviation. This creates four zones:
- Above 2.0 upper band: Strong uptrend — buy zone for momentum traders
- Between 1.0 and 2.0 upper bands: Neutral-to-bullish zone
- Between 1.0 and 2.0 lower bands: Neutral-to-bearish zone
- Below 2.0 lower band: Strong downtrend — short zone or avoid
This approach, popularized by Kathy Lien in forex trading, translates powerfully to equities and can significantly reduce the number of trades taken in the "no-man's land" middle zone — one of the most common sources of avoidable losses.
Common Mistakes When Adjusting Bollinger Bands Settings
Customization is powerful, but it comes with risk if done carelessly. Here are the most common mistakes traders make:
- Over-optimizing to past data: Setting your period and deviation to perfectly fit a specific historical period creates curve-fitted settings that fail in live trading. Always test settings across multiple market cycles.
- Using the same settings across all timeframes: A 20-period setting on a 1-minute chart and a 1-week chart capture completely different market dynamics. Calibrate per timeframe.
- Ignoring asset volatility: High-beta stocks like TSLA or NVDA require wider deviation settings than stable dividend stocks. A 2.0 deviation on NVDA will be breached far more often than on a utility stock — adjust accordingly.
- Trading signals in isolation: Bollinger Bands are a volatility tool, not a complete trading system. Always layer in momentum indicators, volume analysis, or trend filters. The RSI settings guide explains how to calibrate your momentum oscillator to match your Bollinger Band timeframe.
- Changing settings mid-trade: Shifting your parameters while in a position to make the setup "look better" is a form of bias that consistently leads to poor outcomes.
Stocks365 Trust Score and Bollinger Band Signals
When you monitor signals on the Stocks365 dashboard, Bollinger Band breakout and squeeze alerts are evaluated through our trust score system before being surfaced. This means a Bollinger Band breakout signal on, say, AAPL will only receive a high trust rating if it's confirmed by volume, aligned with the broader market trend, and not contradicted by diverging momentum indicators.
This multi-layer validation addresses the single biggest weakness of Bollinger Bands in isolation: false breakouts. In volatile markets, price can spike above the upper band and immediately reverse — costing traders who acted on the band touch alone. The trust score system accounts for this, weighting signals that have multi-indicator confirmation significantly higher than single-indicator touches.
Quick Reference: Bollinger Bands Settings Cheat Sheet
- Scalping (1-5 min): Period 10, Deviation 1.5
- Day Trading (15 min – 1 hr): Period 20, Deviation 2.0
- Swing Trading (Daily): Period 20–30, Deviation 2.0
- Position Trading (Weekly): Period 50, Deviation 2.5
- High-Volatility Assets (Crypto/High-Beta): Period 20, Deviation 2.5–3.0
- Low-Volatility Assets (Blue Chips/Utilities): Period 20, Deviation 1.5–2.0
Key Takeaways
📌 Key Takeaways: Bollinger Bands Settings
• Default 20/2.0 settings are a solid starting point but must be adjusted for your trading style and asset class.
• Shorter periods (10–15) increase sensitivity for scalping; longer periods (50) smooth out noise for position trading.
• Higher standard deviation multipliers (2.5–3.0) are appropriate for high-volatility assets like NVDA or TSLA.
• Bollinger Band squeezes are among the most reliable pre-breakout setups — watch bandwidth reaching multi-month lows.
• Always combine Bollinger Bands with a momentum indicator like RSI for confirmed, higher-probability signals.
• Avoid curve-fitting your settings to historical data — test across multiple market conditions.
• The Stocks365 trust score system helps filter Bollinger Band signals by confirming them across multiple technical factors before they reach your watchlist.
Frequently Asked Questions
What are the best default Bollinger Bands settings for beginners?
Start with the standard settings: a 20-period simple moving average as the middle band and 2.0 standard deviations for the upper and lower bands. This configuration has been the industry benchmark for decades and works well on daily charts for swing trading. Once you're comfortable interpreting what the bands are showing you, begin experimenting with period adjustments to match your timeframe. If you're also learning to use RSI, the beginner's guide to RSI pairs well with your Bollinger Bands education.
Should I change Bollinger Bands settings for different timeframes?
Absolutely — this is one of the most important customizations you can make. The 20-period setting on a daily chart captures roughly a month of trading data, which is meaningful for swing traders. On a 1-minute chart, 20 periods captures only 20 minutes of data, which may be too slow for scalpers. As a general rule: use shorter periods (10–14) for intraday scalping, the standard 20 for day trading and swing trading, and longer periods (50+) for weekly position trading.
Why do Bollinger Bands give false breakout signals?
False breakouts are the most common Bollinger Bands challenge. They occur when price briefly exceeds a band but quickly reverses, trapping traders who entered on the band touch. The primary causes are: low-volume breakouts (no institutional participation), trading against the prevailing trend, and acting on band touches without momentum confirmation. The best defense is requiring RSI confirmation — a price touch of the upper band should coincide with RSI above 60–65 to confirm genuine bullish momentum, not a blowoff top. Understanding how RSI is calculated helps you interpret these confirmations more accurately.
What standard deviation should I use for highly volatile stocks like NVDA or TSLA?
For high-beta, high-volatility stocks, consider increasing the standard deviation multiplier to 2.5 or even 3.0. At the default 2.0 setting, the bands will be breached far more frequently by these stocks' naturally wide price swings, generating excessive signals. A 2.5 deviation ensures that only genuinely extreme moves — true outlier events — trigger band-touch signals, improving signal quality significantly. You can verify this by checking how often the default bands are breached on a stock like NVDA over a 3-month period.
Can I use Bollinger Bands as a standalone trading system?
Not reliably. Bollinger Bands are a volatility and price-range measurement tool — they tell you where price is relative to its recent statistical range, but they don't provide directional bias or momentum confirmation on their own. The most effective approach is combining Bollinger Bands with a momentum oscillator (RSI, Stochastic, or MACD), a volume indicator, and a trend filter (such as a 200-period moving average). This multi-confluence approach dramatically reduces false signals and improves the risk/reward profile of each trade you take.