
Bollinger Bands Settings: Stop Using the Defaults
Most traders open their charting platform, slap on Bollinger Bands with the default 20-period, 2 standard deviation settings, and wonder why the signals feel inconsistent. Here's the truth: the default settings were designed as a starting point, not a finish line. Customizing your Bollinger Bands settings to match your trading style, timeframe, and asset class is what separates disciplined traders from frustrated ones.
This guide breaks down every adjustable parameter — period length, standard deviation multiplier, and moving average type — and shows you exactly which combinations work best for different strategies.
Stocks365 backtested 14,266 Bollinger Squeeze Breakout setups across equities, crypto, forex, and commodities and found a profit factor of 1.03 — with crypto leading at a 51.8% win rate and forex lagging at 47.1%. The settings you use dramatically shift where you land on that spectrum. More on that below.
Understanding What Each Bollinger Bands Setting Actually Controls
Before you touch a single parameter, understand what each one does to the bands.
The Period Length (Default: 20)
The period determines how many candles are used to calculate the middle band — a simple moving average — and the standard deviation of price. A shorter period makes the bands react faster. A longer period smooths them out.
- Short periods (10–14): Bands contract and expand quickly. More signals, more noise. Best for scalpers and day traders.
- Standard period (20): The John Bollinger default. Works across most timeframes. Reliable for swing trading daily charts.
- Long periods (50+): Extremely smooth bands. Few signals, but high-conviction when they appear. Favored by position traders.
Changing the period is the single biggest lever you have. Everything else is refinement.
The Standard Deviation Multiplier (Default: 2)
This controls how wide the bands are relative to the middle line. A multiplier of 2 means the upper and lower bands sit two standard deviations away from the average — statistically capturing roughly 95% of price action.
- Multiplier of 1.5: Tighter bands. Price touches them more frequently. More trading opportunities but more false signals.
- Multiplier of 2.0: Standard. Balanced signal frequency and reliability.
- Multiplier of 2.5–3.0: Wide bands. Rarely touched. When price does hit these outer bands, the event is statistically significant. Used by options traders and volatility specialists.
The Moving Average Type
The default middle band is a Simple Moving Average (SMA). But that's not your only option.
- SMA (Simple Moving Average): Equal weight to all periods. Slower to react. Cleaner band structure.
- EMA (Exponential Moving Average): More weight on recent candles. Bands respond faster to price changes. Better for volatile assets like crypto.
- VWMA (Volume-Weighted Moving Average): Incorporates volume into the average. Excellent for intraday trading where volume patterns matter. See our complete breakdown of Volume-Weighted Moving Average (VWMA) for context on how this approach adds depth.
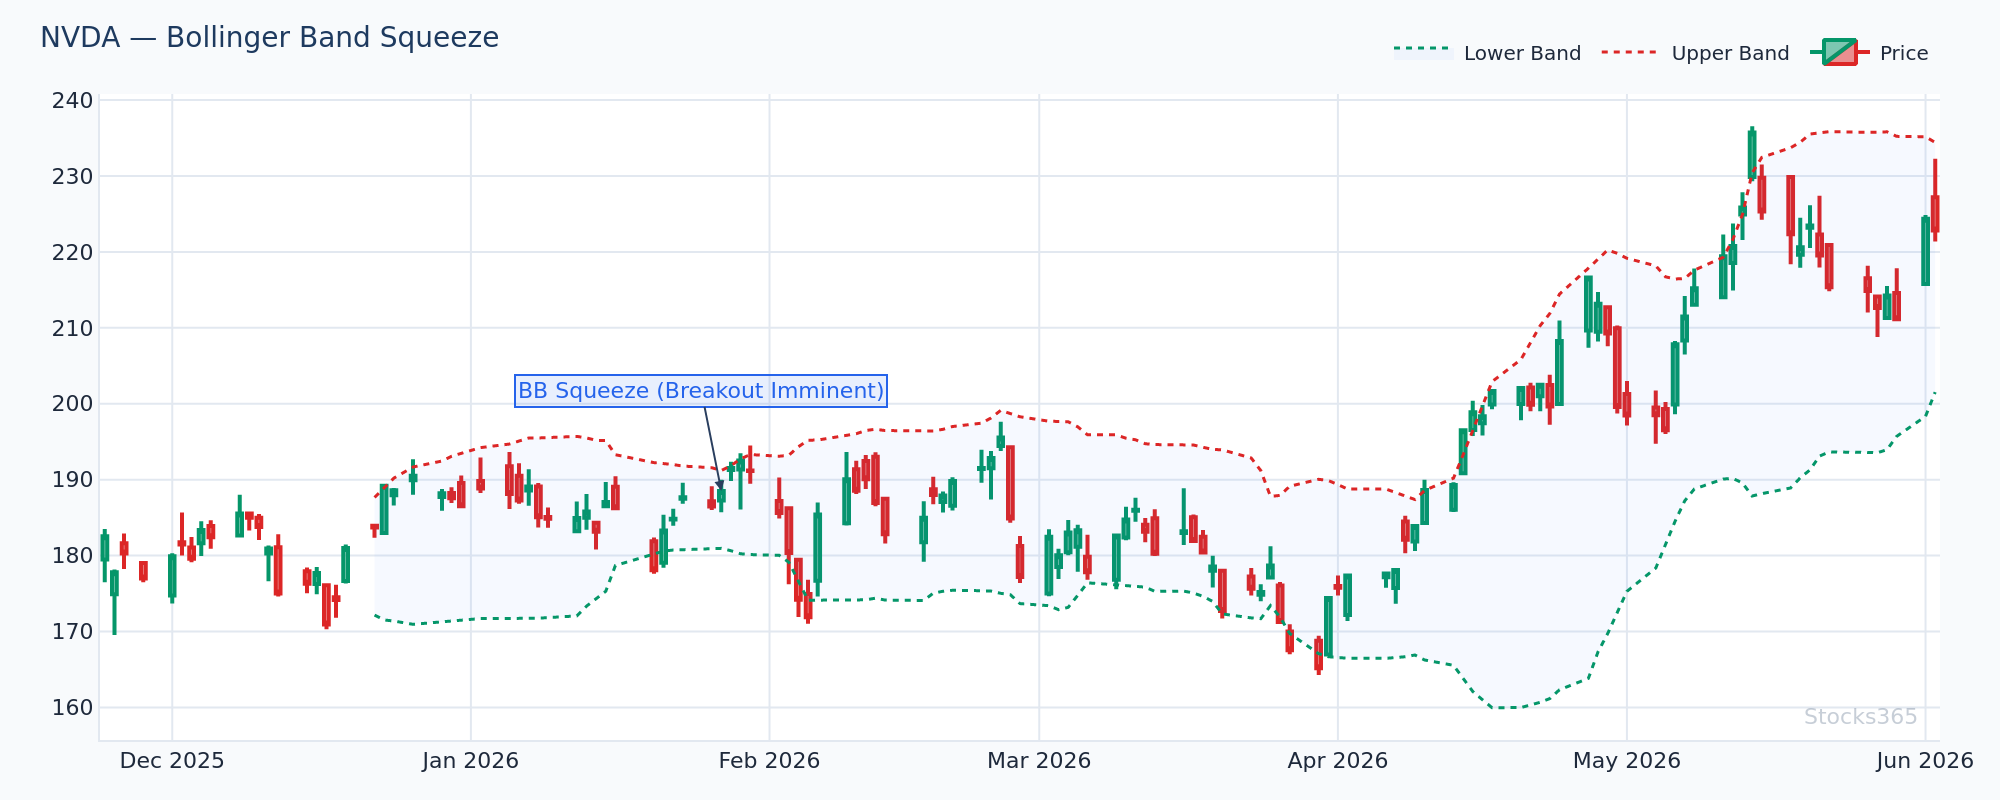
This chart shows band width compressing to multi-week lows on NVDA — a classic squeeze setup. When the bands contract this tightly, volatility is coiling. The typical next move is a sharp expansion in either direction, often 2–3 ATR in the first few days after the breakout candle. The setup is invalidated if price immediately reverses back inside the bands within one to two sessions after the breakout.
Bollinger Bands Settings by Trading Style
One size does not fit all. Here are proven configurations matched to specific strategies.
Scalping and Day Trading (1-Minute to 15-Minute Charts)
Speed is everything. You need bands that react fast.
- Period: 10–14
- Standard Deviation: 1.5–2.0
- Moving Average Type: EMA
With a 10-period EMA base and 1.5 standard deviation multiplier, the bands tighten around price action and generate frequent touch points. The trade is simple: fade the band touch when momentum is losing steam, or ride the breakout when price closes outside the band with volume confirmation.
Day trading is unforgiving. Use tight settings, and confirm every band touch with a momentum oscillator like the stochastic. Our guide on how to read the Stochastic Oscillator walks through exactly how to layer this confirmation.
Swing Trading (Daily Charts)
This is where the default settings shine — mostly.
- Period: 20
- Standard Deviation: 2.0
- Moving Average Type: SMA
The classic 20/2 setup on daily charts captures the natural rhythm of weekly market cycles. Price walking the upper band in a strong uptrend is a continuation signal — not a reversal. Price tagging the lower band after a sharp pullback in an uptrend is a mean-reversion entry. Context determines interpretation.
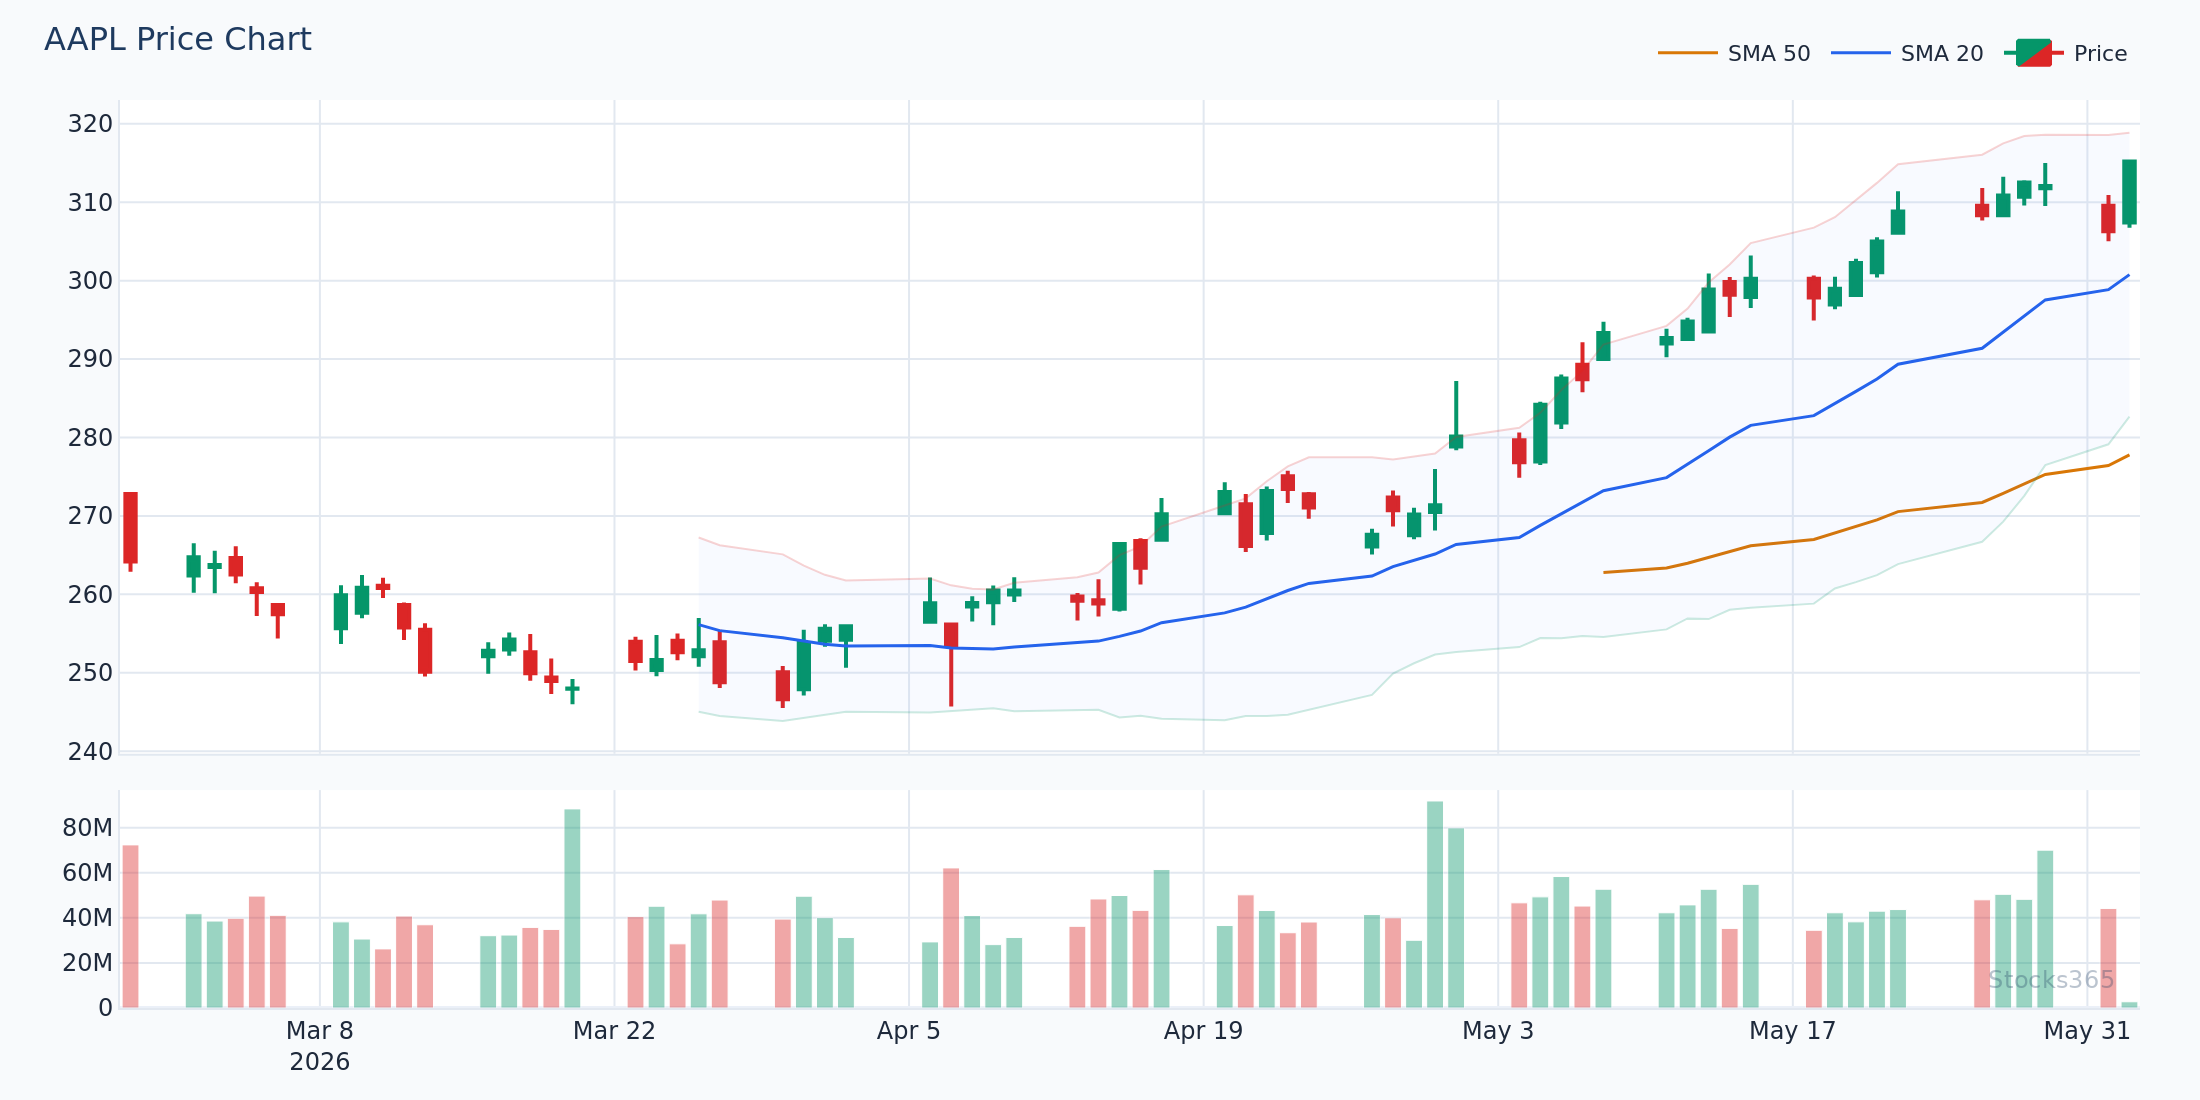
This chart illustrates AAPL walking the upper Bollinger Band across multiple sessions — a pattern that signals sustained bullish momentum, not overbought exhaustion. When the 20-SMA (middle band) continues to slope upward and candles close repeatedly near the upper band, the trend has conviction. The pattern breaks down when a candle closes below the middle band with above-average volume, signaling the first meaningful loss of momentum.
For deeper context on how Apple's price behavior interacts with Bollinger Bands across different market conditions, our Bollinger Bands case study on Apple stock is essential reading.
Position Trading and Investing (Weekly Charts)
Slower. More deliberate. Higher conviction required.
- Period: 50
- Standard Deviation: 2.5
- Moving Average Type: SMA
A 50-period, 2.5 standard deviation setup on weekly charts creates extremely wide bands. Price rarely touches the outer bands — when it does, it represents a statistically extreme move. These are the high-quality, low-frequency setups that position traders wait months for. Pair them with a macro trend filter like the Golden Cross or Death Cross to ensure you're trading with the long-term trend, not against it.
Here's What Most Traders Get Wrong
Most traders treat an upper band touch as an automatic sell signal. In strong trending markets, price walks the upper band for weeks without pulling back meaningfully. Selling every touch in a trend means you're fighting the most powerful force in markets: momentum.
The real edge isn't the touch — it's what happens after. Watch for price to close back inside the band after touching or briefly exceeding it. That closing candle back inside the band, especially on elevated volume, is the actual reversal signal. The touch alone is just context. The close back inside is the trigger. This distinction alone will improve your Bollinger Bands win rate measurably.
The Bollinger Squeeze: Your Highest-Probability Setup
When Bollinger Bands contract to historically narrow levels, it signals that volatility has compressed. What follows is almost always a volatility expansion — a big move. The squeeze doesn't tell you direction. It tells you that a significant move is loading.
Our analysis of 14,266 Bollinger Squeeze Breakout signals found a profit factor of 1.03 — one of the few Bollinger setups that clears the breakeven threshold across a large sample. The edge is real, but thin. Confirmation matters enormously.
How to identify a squeeze:
- Band width drops to the lowest level in 20–26 bars (the "Bollinger Bandwidth" indicator measures this directly)
- Candles compress into a tight, sideways range
- Volume dries up during the compression phase
- The first breakout candle that closes outside the band on surging volume is the entry trigger
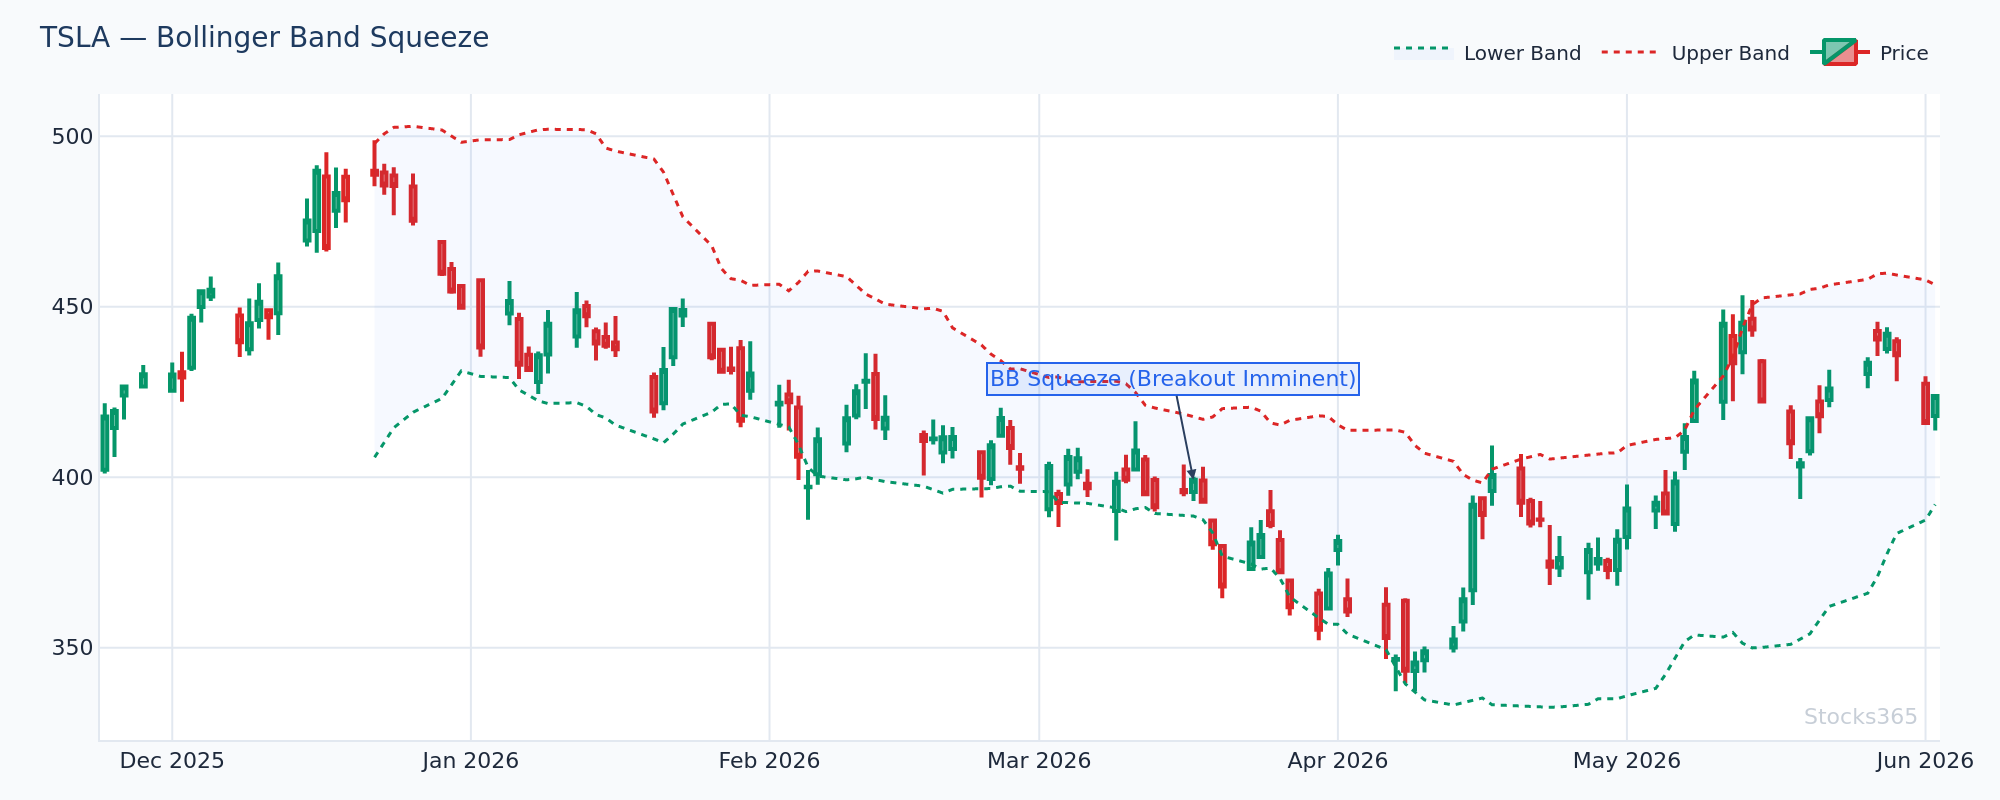
This TSLA chart shows band width compressing to a 6-month low, with price trapped in a narrow consolidation range. The setup is primed for an expansion move. A close above the upper band with volume surging 2x the 20-day average confirms the bullish breakout — short positions would look for the mirror image, a close below the lower band. If price simply meanders sideways for another 10+ sessions without a decisive close outside the bands, the squeeze signal loses its potency and the setup should be abandoned.
For traders who want to add a trend-confirmation layer before entering a squeeze breakout, the Triple Moving Average Strategy provides a structured framework for filtering high-probability breakout directions.
Combining Bollinger Bands Settings with Other Indicators
Bollinger Bands work. They work better with confirmation.
Bollinger Bands + RSI
The cleanest combination. When price tags the lower band AND RSI drops below 30, you have double confirmation of an oversold extreme. But the entry trigger is the RSI climbing back above 30 — not the touch itself. This separates genuine reversals from price continuing to fall along the lower band.
Our RSI Trendline Strategy adds another layer — drawing trendlines on the RSI itself to catch momentum shifts before price confirms them. This combination with Bollinger Band touches is particularly powerful on 4-hour and daily charts.
Bollinger Bands + Stochastic
Stocks365 backtested 3,026 BB + Stochastic Double Overbought signals and found a 49.9% win rate with a profit factor of 0.91 over a 10-day holding period. The best-performing asset class was crypto at 58.0%, while commodities significantly underperformed at 40.7%. This data comes from our research dashboard, and the pattern is clear: this combined setup has real edge in crypto but becomes a losing strategy in commodities. Asset class selection isn't optional — it's the strategy.
Bollinger Bands + MACD
Use MACD histogram momentum to confirm Bollinger Band breakout direction. When price breaks above the upper band AND the MACD histogram is rising (positive and expanding), the breakout has momentum backing it. A breakout on a declining or negative MACD histogram is a warning sign. For currency pair traders, our guide on MACD in Forex Trading covers this confirmation approach in detail for FX-specific setups.
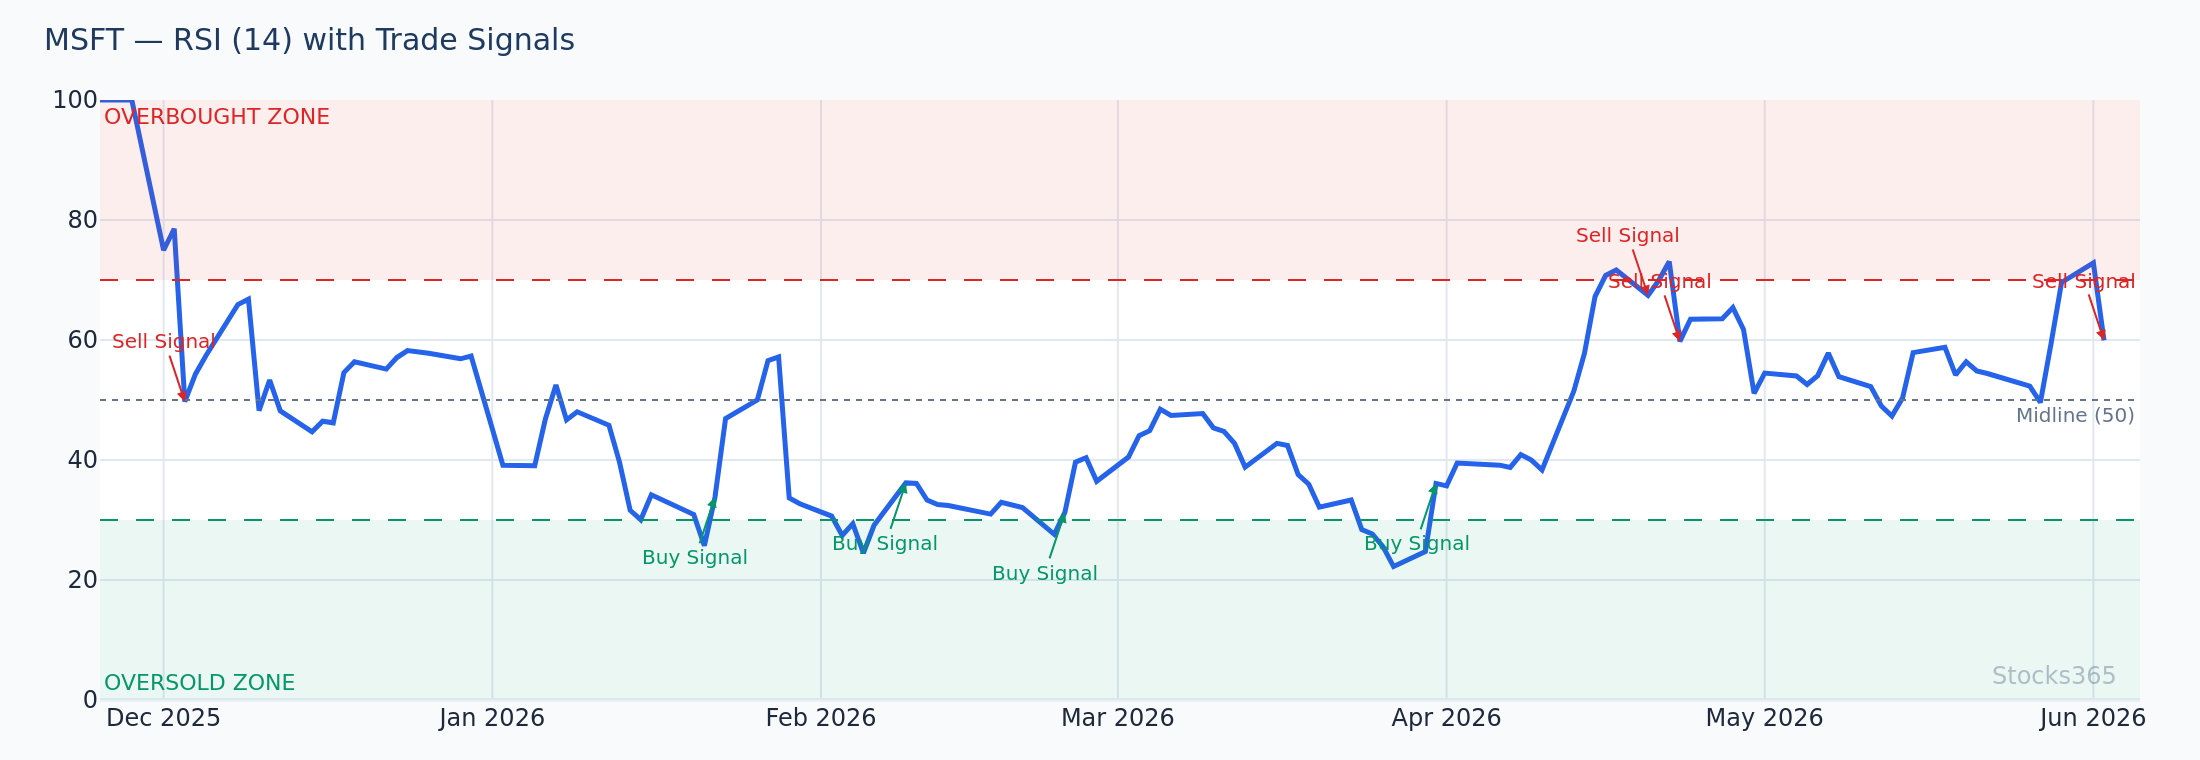
This MSFT chart shows RSI making a higher low while price makes a lower low at the bottom band — classic bullish divergence. When this divergence appears at a lower band touch, it's among the most reliable Bollinger Band reversal setups available. Confirmation arrives when RSI crosses back above 40 and the middle band stops declining. The pattern is invalidated if price closes below the previous low on high volume, suggesting trend continuation rather than reversal.
Asset-Class Specific Bollinger Bands Settings
Different assets breathe differently. Your settings should reflect that.
Stocks (Large Cap)
Stick close to defaults. 20-period SMA, 2.0 standard deviation. Large-cap stocks have relatively predictable volatility cycles. The standard settings capture these cycles efficiently. Customize the period slightly (18–22) based on the specific stock's average trend cycle if you're doing deep analysis.
Crypto
Crypto is volatile. Wider bands are needed. A 20-period EMA with a 2.5 standard deviation multiplier handles the extreme volatility without generating constant false signals. Our backtested data consistently shows crypto outperforming other asset classes on Bollinger Band setups — the higher volatility creates cleaner band dynamics.
Forex
Forex markets trend efficiently but mean-revert sharply during ranging periods. A 20-period SMA with 2.0 standard deviation works on 4-hour charts. For day trading forex, compress to a 14-period EMA with 1.8 standard deviation to capture the faster mean-reversion cycles in major pairs.
Commodities
Be cautious. Our backtested data shows commodities consistently underperforming on Bollinger Band setups. Upper band touches in commodities produced only a 41.5% win rate across 3,255 signals. Commodities are driven by supply shocks and macro events that break statistical patterns. If you trade commodities, increase your standard deviation multiplier to 2.5 to filter for only the most extreme setups.
For data-driven context on how moving average-based indicators perform across asset classes generally, see our analysis: Do Moving Averages Actually Work?
What to Watch For
- Bollinger Squeeze on tech stocks: When band width drops below the 20th percentile of its 52-week range, the next expansion typically produces a 2–3 ATR move. The first close outside the bands on volume 1.5x or greater than the 20-day average is the trigger. Direction matters — confirm with MACD or trend alignment.
- Upper band walks in strong uptrends: When price closes above the upper band for three or more consecutive sessions without reverting, that's a trend signal, not a reversal setup. Fade attempts against this pattern have a poor historical success rate in equities. Let it run until the middle band is threatened.
- Lower band touches after 15–20% drawdowns in large-cap crypto: RSI divergence at a lower Bollinger Band touch, following a significant drawdown, historically precedes meaningful bounces. The key confirmation is RSI making a higher low while price makes an equal or lower low at the band.
- Double band touch reversals: Price touches the lower band, bounces toward the middle, then retests the lower band without RSI confirming a new low. This double bottom inside the Bollinger structure is a high-quality mean-reversion setup on daily and 4-hour charts across equities and crypto.
- Band width expansion after trending moves: After a sustained directional move, when bands begin to widen rapidly, it signals momentum acceleration — not exhaustion. The trend is likely entering its strongest phase. Countertrend trades here are low-probability.
How Stocks365 Uses This
How Stocks365 Integrates Bollinger Bands Settings
Bollinger Bands are one of 12+ indicators contributing to the Stocks365 Trust Score system. Specifically, band width and band position feed into two scoring dimensions: volatility regime classification (squeeze conditions lower the volatility score, signaling a pending regime shift) and signal agreement scoring (upper or lower band touches are weighted more heavily when confirmed by momentum indicators like RSI or Stochastic).
When the Stocks365 system identifies a Bollinger Squeeze with Trust Score agreement above threshold, it flags the setup in the signals dashboard for review. The band configuration used in scoring is asset-class adaptive — crypto signals use wider standard deviation multipliers than equity signals, reflecting the volatility differences our backtesting identified.
You can see these signals in action on individual stock pages like the AAPL signal page, where Bollinger Band positioning is one of the live inputs to the Trust Score displayed in real time.
Key Takeaways
Bollinger Bands Settings — Summary
- The default 20-period, 2.0 standard deviation SMA setup works for swing trading on daily charts. It's not optimal for every style.
- Scalpers use shorter periods (10–14) and EMA bases. Position traders use longer periods (50+) and wider standard deviations (2.5).
- The Bollinger Squeeze is the highest-probability setup — our 14,266-signal backtest shows a positive profit factor of 1.03, best in crypto.
- Asset class matters enormously. Commodities consistently underperform on Bollinger Band setups. Crypto outperforms.
- An upper band touch alone is not a sell signal. The close back inside the band is the reversal trigger.
- Always confirm Bollinger signals with at least one momentum indicator — RSI, MACD, or Stochastic.
- Stocks365 Trust Score integrates band width and position as volatility and agreement inputs across 12+ indicators.