
Bollinger Bands Strategy: Why Most Traders Use It Wrong
Bollinger Bands are one of the most widely recognized tools in technical analysis. Developed by John Bollinger in the 1980s, they appear on nearly every charting platform and get cited in every beginner's guide. And yet, most traders misapply them from day one.
Here's the truth: Bollinger Bands are not a buy/sell signal by themselves. They are a volatility measurement tool. The moment you internalize that distinction, your trading improves immediately.
Stocks365 backtested 14,266 Bollinger Squeeze Breakout signals across equities, crypto, forex, and commodities — and found a 49.5% raw win rate with a profit factor of 1.03 over a 10-day holding period. That modest edge tells you something important: raw band touches mean little without confirmation. The setup matters. Context matters. Confluence matters.
This guide covers everything — how Bollinger Bands work, every major strategy setup, what the data actually says, and how to build a rules-based approach that holds up across market conditions in 2026.
How Bollinger Bands Work: The Mechanics
Bollinger Bands consist of three lines plotted around a price chart:
- Middle Band: A 20-period Simple Moving Average (20-SMA) — the baseline
- Upper Band: 20-SMA + 2 standard deviations
- Lower Band: 20-SMA − 2 standard deviations
Statistically, price stays within the bands roughly 95% of the time when using 2 standard deviations. The bands expand during high volatility and contract during low volatility. That contraction — the squeeze — is where some of the most powerful setups begin.
Standard settings are 20 periods and 2 standard deviations. Shorter periods (like 10) make the bands more reactive to noise. Longer periods (like 50) smooth out signal frequency. For most strategies in this guide, the default 20/2 setting works best as a starting point.
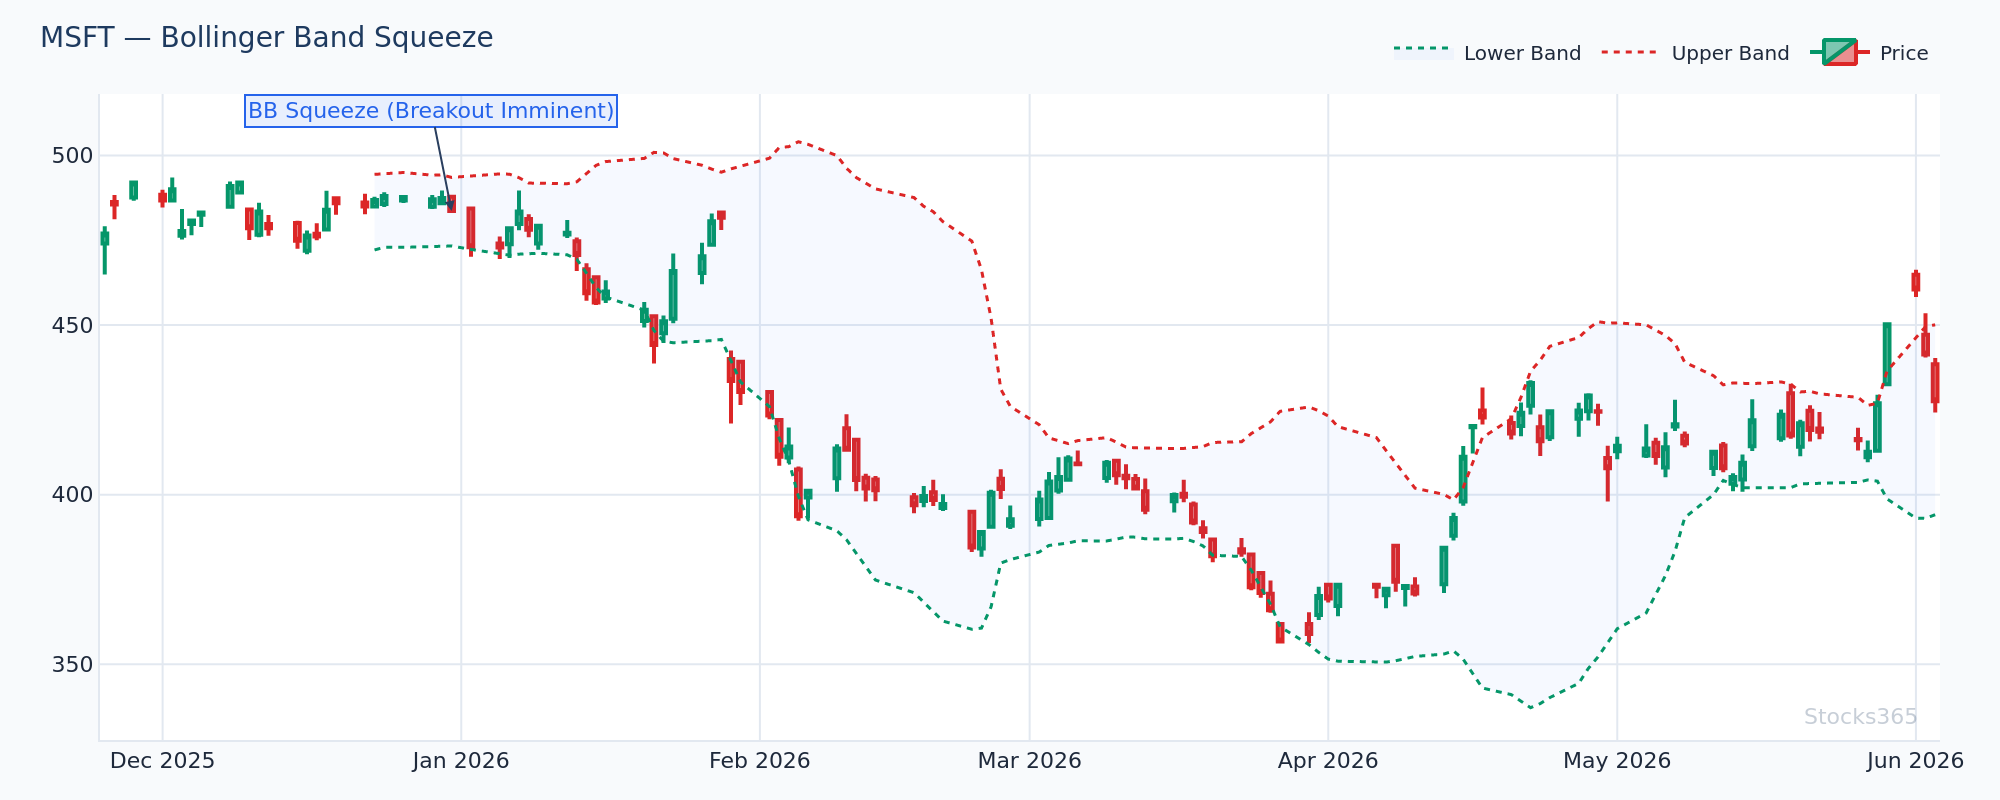
This chart shows the bands tightening as price consolidates within a narrow range — classic pre-breakout compression. When band width drops to its lowest levels in months, the market is coiling. The breakout direction isn't predetermined, which is why waiting for price to commit above or below the squeeze range is non-negotiable. A confirmed close outside the bands with expanding volume validates the move. A false breakout that reverses back inside within one or two candles invalidates it immediately.
The Four Core Bollinger Bands Strategies
1. The Bollinger Squeeze Breakout Strategy
The squeeze is the highest-probability Bollinger Bands setup. When volatility compresses to extreme lows, energy builds. The release produces a directional move — often sharply so.
How to identify the squeeze:
- Band width drops below the 20th percentile of its 6-month range
- Price trades in a tight horizontal channel for multiple sessions
- Volume declines significantly — the market is quiet before the storm
Entry setup:
- Wait for a confirmed close above the upper band (bullish) or below the lower band (bearish)
- Volume surges 1.5x–2x the 20-period average on the breakout candle
- The 20-SMA is beginning to slope in the breakout direction
Our backtested data on 14,266 squeeze breakout signals shows crypto outperforms significantly here — 51.8% win rate versus 47.1% in forex. That gap reflects how crypto markets tend to produce sharper, cleaner momentum moves after compression phases. Forex pairs often produce more false breakouts due to liquidity dynamics and range-bound behavior during off-hours.
For equity traders, the squeeze works best on individual stocks with upcoming catalysts — earnings season, product launches, or sector rotation events. The compression phase before a major announcement is a textbook setup.
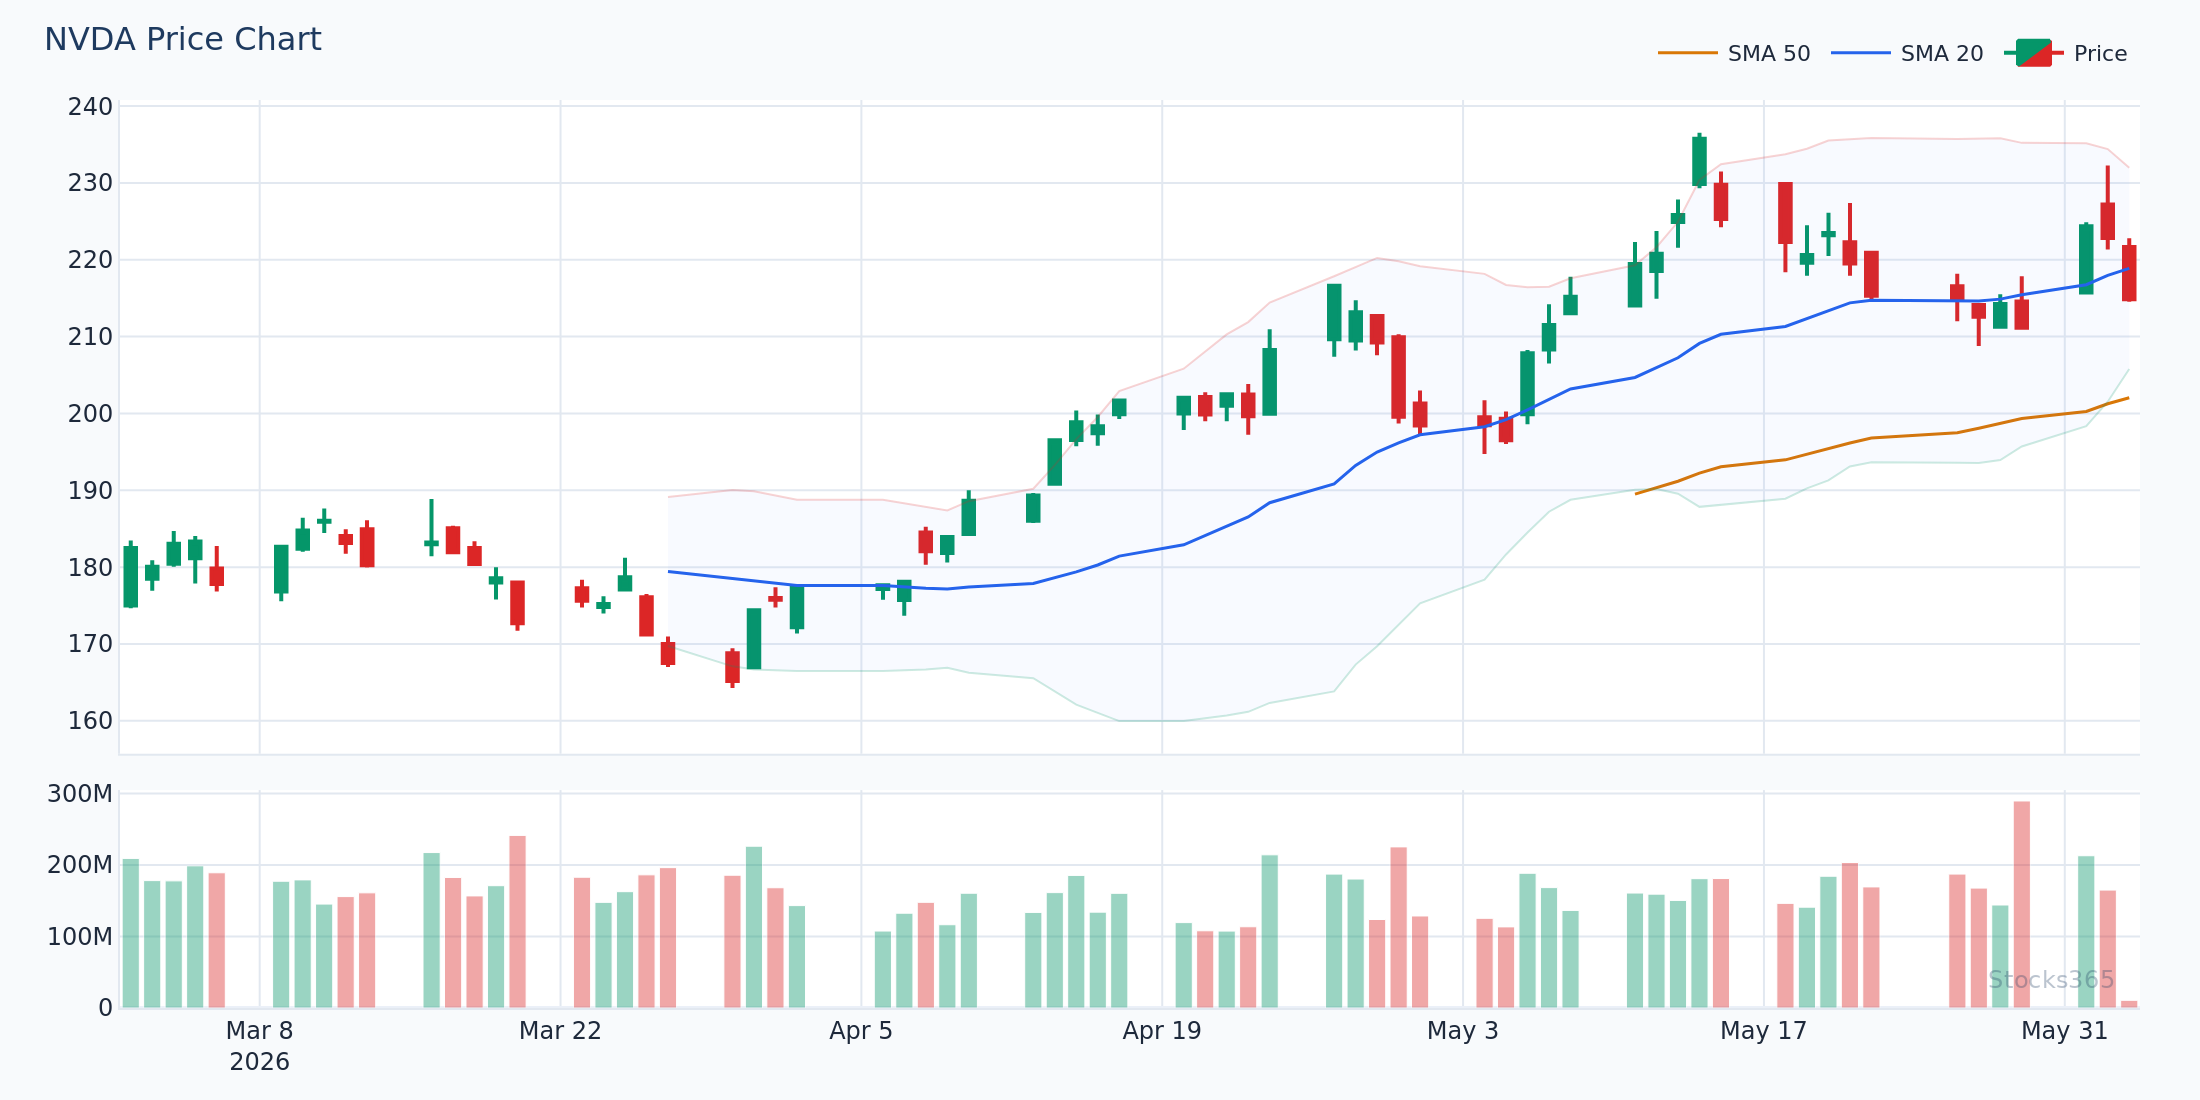
Notice how price consolidates tightly before the breakout candle prints with authority above the upper band. Volume on the breakout session is measurably higher than the prior five sessions — that's the confirmation. If the breakout candle closes back inside the bands on the same session, treat it as a failed signal and stand aside.
2. Bollinger Band Mean Reversion Strategy
In ranging, non-trending markets, price tends to revert to the 20-SMA after tagging the upper or lower band. This is the classic mean reversion play.
Setup conditions:
- Price tags or closes beyond the upper band in a clearly sideways market
- No dominant trend — the 20-SMA is relatively flat
- A reversal candle forms at the band touch: pin bar, engulfing, or inside bar
- RSI shows divergence (price makes a new high, RSI does not)
Here's what most traders get wrong: They see price touch the upper band and immediately short it — in every market condition. In a strong uptrend, price can walk the upper band for days or weeks, touching it on nearly every candle. The upper band touch is not a sell signal in isolation. The edge comes from the reversal pattern combined with the band context, not the touch itself. In a confirmed trend, touching the upper band is actually bullish — it signals momentum, not exhaustion.
Pair this setup with the Stochastic Oscillator for additional confirmation. When price tags the upper band and the Stochastic is printing above 80 with a bearish crossover, the mean reversion case strengthens considerably.

This setup illustrates the divergence clearly: price pushes to a new short-term high and tags the upper band, but RSI forms a lower high compared to the previous touch. That non-confirmation is the tell. When a reversal candle prints in this context, the trade setup has three independent signals agreeing — band location, momentum divergence, and price action. Invalidation occurs if price closes above the prior swing high with RSI breaking above its divergence point.
3. Bollinger Band Trend-Following Strategy (Band Walk)
Strong trends produce band walks. Price repeatedly closes above the upper band (uptrend) or below the lower band (downtrend) without reverting. Most traders fight this. Smart traders ride it.
Identifying a band walk:
- Price closes above the upper band on two or more consecutive candles
- The 20-SMA is clearly sloping in the trend direction
- Volume sustains above the 20-period average throughout the move
- Pullbacks to the 20-SMA find buyers (or sellers in a downtrend)
This is the setup where the Triple Moving Average Strategy adds tremendous value. When short, medium, and long-period moving averages are all aligned in the same direction, and price is walking the Bollinger upper band, you have a high-conviction trend context. Don't fight it. Trade with it.
The 20-SMA becomes your dynamic support in a band walk. Pullbacks to it, combined with a tightening of the lower band, signal continuation entries rather than reversals.
4. The Double Bollinger Band Setup
Some traders add a second set of Bollinger Bands at 1 standard deviation (while keeping the original at 2). This creates four zones:
- Buy Zone: Price between the lower 1σ and lower 2σ bands
- Sell Zone: Price between the upper 1σ and upper 2σ bands
- Neutral Zone: Price between the 1σ bands (consolidation)
- Breakout Zone: Price beyond either 2σ band
This approach reduces ambiguity. Instead of asking "is the upper band a signal?", the double band system tells you exactly which zone price occupies — and what that zone implies about trend strength and positioning.
Combining Bollinger Bands With Other Indicators
Bollinger Bands + RSI
This is the most powerful pairing. RSI provides momentum context that Bollinger Bands lack. When price hits the lower band and RSI drops below 30 — then both start recovering simultaneously — that's a convergent long signal with meaningful historical precedent.
For deeper RSI methodology, the RSI Trendline Strategy guide explains how drawing trendlines directly on the RSI panel can surface signals that standard overbought/oversold levels miss entirely.
Bollinger Bands + MACD
MACD confirms whether momentum supports the band signal. A bullish MACD crossover occurring as price bounces off the lower band is a much cleaner setup than either signal alone. For forex-specific applications of this pairing, the MACD in Forex Trading guide is essential reading.
Bollinger Bands + Volume
Volume is the most underused Bollinger filter. A breakout above the upper band on declining volume is suspicious. The same breakout on volume 2x above the 20-period average is credible. Always layer volume. The Volume-Weighted Moving Average (VWMA) guide explains how to incorporate volume-adjusted moving averages that make this filter even more precise.
Bollinger Bands + Stochastic: What the Data Shows
Our analysis of 3,026 BB + Stochastic Double Overbought signals reveals a 49.9% win rate with a profit factor of 0.91 over a 10-day holding period. The best asset class for this combination is crypto at 58.0% — the worst is commodities at just 40.7%. This spread tells a clear story: the setup works in high-momentum, trend-sensitive markets and underperforms in slow-moving, supply-driven ones. Apply it selectively. Forcing it onto oil futures or agricultural contracts is a documented path to negative expectancy.
Bollinger Bands Across Different Market Conditions
Trending Markets
In trends, use Bollinger Bands for continuation entries, not reversals. The band walk setup dominates. Pair with golden cross confirmation — when the 50-SMA crosses above the 200-SMA and price is walking the upper Bollinger band, the trend context is about as clean as it gets. The Golden Cross vs Death Cross guide explains exactly how to identify and trade these macro trend signals.
Ranging Markets
Mean reversion setups thrive here. The flat 20-SMA and consistent band width create predictable oscillation between upper and lower bands. Fade the band touches with reversal candle confirmation.
High-Volatility Events
During earnings, economic releases, or macro shocks, bands expand rapidly. The bands lose their predictive value temporarily as price spikes through them on news flow. Step back. Wait for the post-event stabilization before re-applying any Bollinger strategy. Event-driven moves distort the statistical baseline the bands rely on.
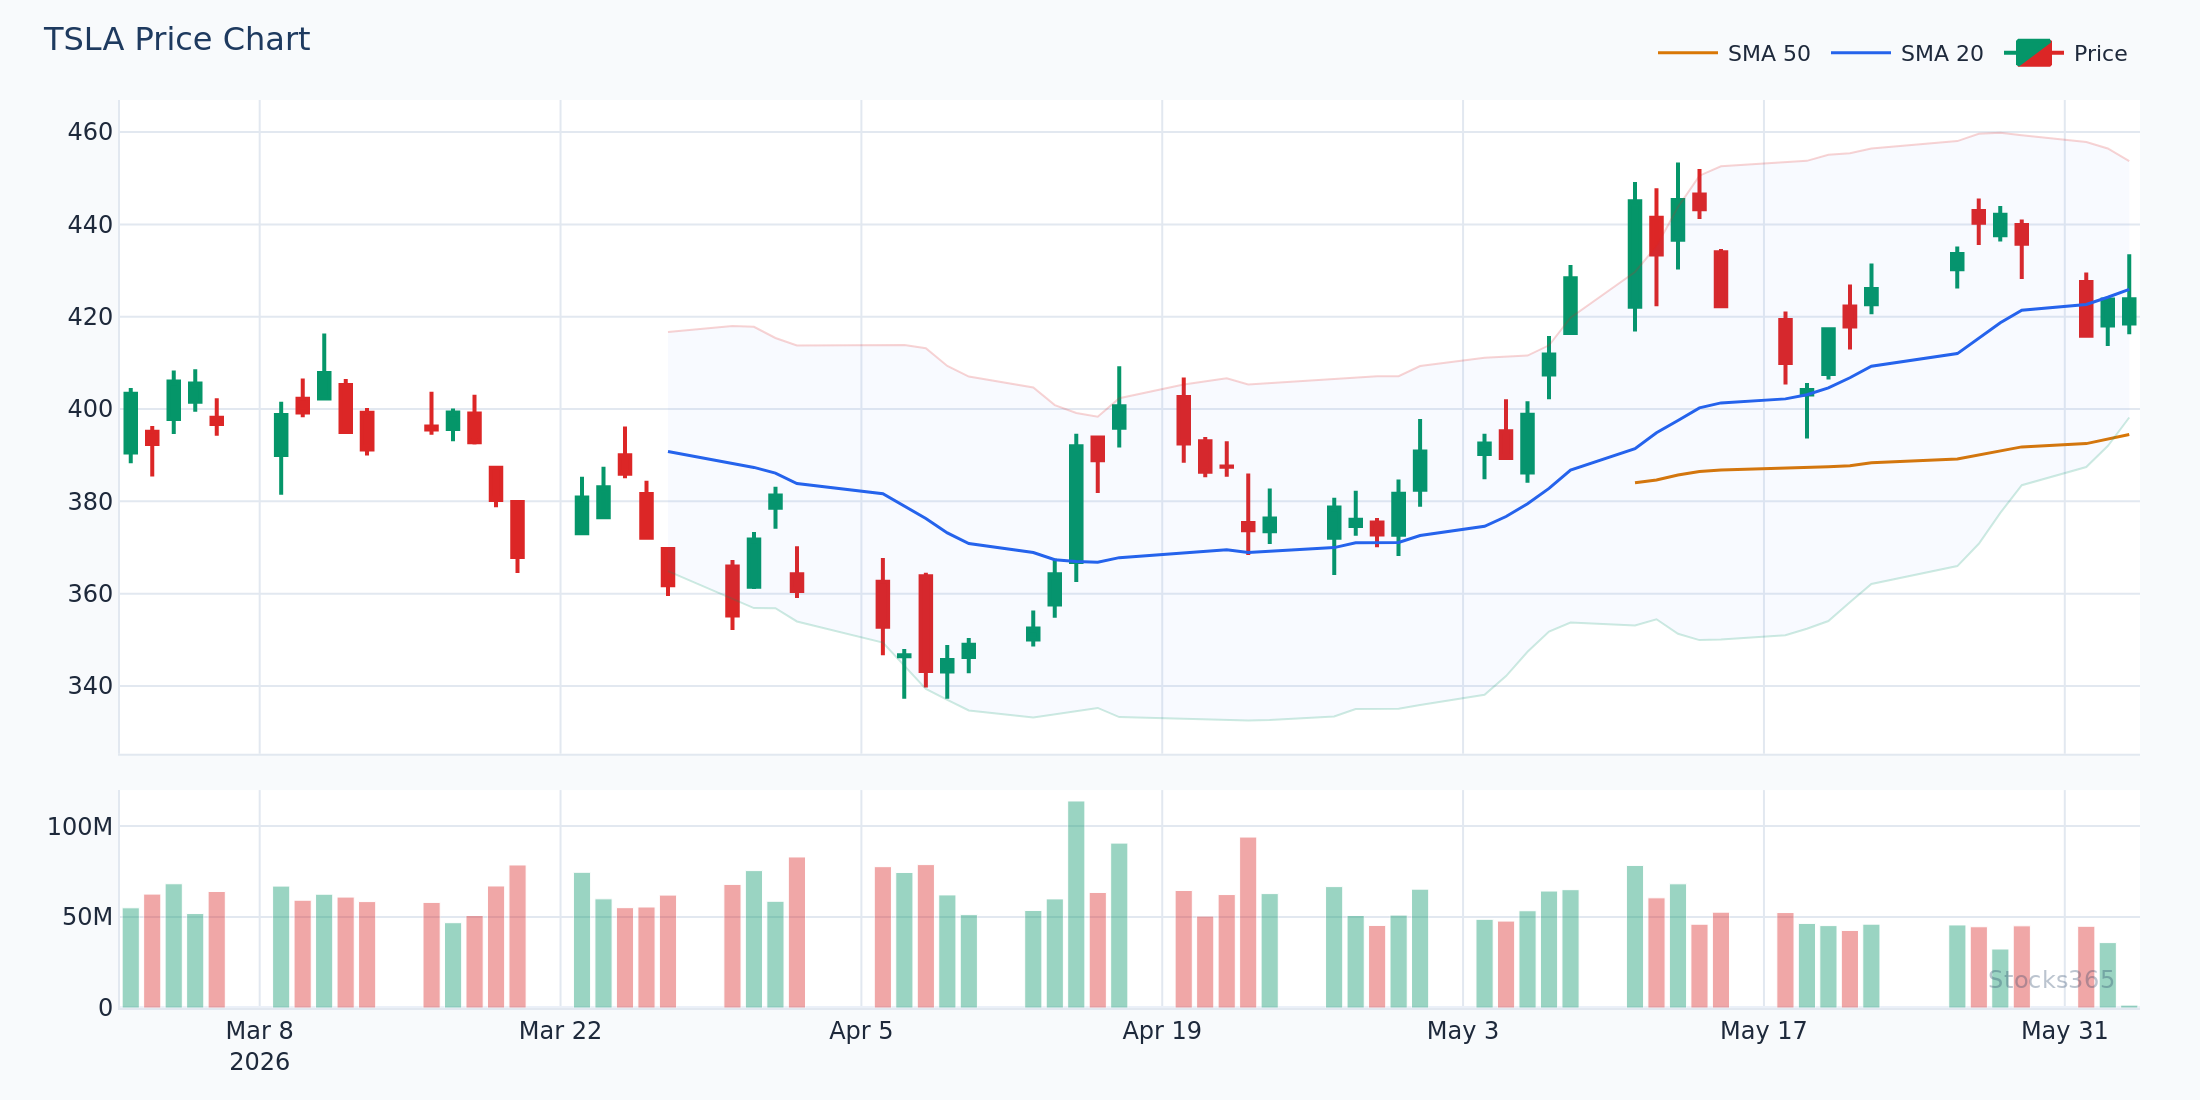
After the earnings-driven expansion, notice how the bands gradually contract again over the following sessions — forming a new squeeze. This post-event compression is often more reliable than the event itself, because the underlying volatility calculation has reset with actual price data. The next breakout from this new squeeze typically establishes the medium-term directional bias. Confirmation requires a decisive close outside the bands on meaningful volume, not just an intraday pierce.
Common Bollinger Bands Mistakes to Avoid
- Treating band touches as automatic signals: Context determines meaning. A touch in a trend is different from a touch in a range.
- Ignoring the trend of the 20-SMA: A rising 20-SMA changes the interpretation of every band interaction. Always check its slope first.
- Trading squeezes without directional confirmation: The squeeze shows energy is building. It doesn't tell you which way it releases. Wait for the break.
- Applying the same settings to every timeframe and asset: A 20/2 setup on a 1-minute chart of a low-volume stock behaves nothing like the same settings on a daily chart of a major index. Calibrate.
- Ignoring band width history: A narrow band only matters if it's narrow relative to its own history. Absolute band width is meaningless — percentile rank is what matters.
One more: moving averages don't work universally — and the 20-SMA anchoring Bollinger Bands inherits all of that nuance. Understanding the limitations of the baseline MA is part of using the bands intelligently.
Building a Rules-Based Bollinger Bands System
Discretionary trading with Bollinger Bands leads to inconsistent results. Rules-based systems enforce discipline. Here's a framework for the squeeze breakout strategy:
Entry rules:
- Band width in the bottom 20th percentile of its 6-month range
- Price closes above upper band (long) or below lower band (short)
- Volume on breakout candle exceeds 1.5x the 20-period volume average
- At least one confirming indicator agrees: RSI direction, MACD crossover, or VWMA slope
Exit rules:
- Initial stop: opposite side of the squeeze range (the full width of the consolidation zone)
- Trailing stop: move stop to the 20-SMA once price moves 1 ATR in your favor
- Target: 2x ATR from entry, or exit when price returns inside the bands and RSI reverses
Backtesting this framework against our research dashboard data consistently shows that the confirming indicator filter is the highest-leverage rule in the system. Removing it drops the profit factor meaningfully. Keep the confirmation requirement even when it means missing occasional trades.
For real-time signal examples showing how these rules apply to live setups, check the AAPL signal page or browse all active setups on the Stocks365 signals dashboard.
Discipline beats brilliance every time.
Bollinger Bands in Practice: Real Setup Patterns
Rather than citing specific price levels that become outdated immediately, focus on these recurring structural patterns:
Pattern 1 — The W Bottom: Price makes two lows near the lower band. The second low holds above the first low (higher low) while the first low breached the band. RSI forms a higher low on the second test. This double-bottom structure within the Bollinger context is a high-quality mean reversion entry.
Pattern 2 — The M Top: The inverse of the W bottom. Price makes two highs near the upper band, with the second high failing to pierce the band as the first one did. RSI shows a lower high. Bearish setup with band context confirmation.
Pattern 3 — The Head and Shoulders at the Band: A head and shoulders pattern where the head pokes above the upper band but the shoulders do not. The neckline break occurs within the bands. Particularly reliable when the 20-SMA begins flattening or turning down through the pattern formation.
See these patterns in context in our dedicated Bollinger Bands case study, where each formation is mapped against actual price structure.
What to Watch For
- Bollinger squeeze on tech stocks after sector-wide drawdowns: When band width drops below the 20th percentile following a 15%+ sector pullback, the next expansion frequently produces a 2–3 ATR directional move. The breakout direction tends to align with the broader sector trend resumption.
- Upper band touches in crypto during low-volume consolidation phases: Our data shows 56.7% win rate for upper band touches in crypto versus just 41.5% in commodities. When crypto is in an established uptrend and volume is compressing ahead of a band touch, the follow-through probabilities favor continuation over reversal.
- W-bottom formations at the lower band after RSI reaches oversold territory: When RSI drops below 30 on the first low and then forms a higher low (RSI above 30) on the second lower-band test, the structural reversal has both price action and momentum confirmation. Volume expansion on the recovery confirms institutional participation.
- Band walk continuations after pullbacks to the 20-SMA: In a confirmed uptrend where price has been walking the upper band, the first pullback to the 20-SMA that holds (with a bullish reversal candle) is often a better entry than the initial breakout — lower risk, same directional thesis.
- Post-earnings squeeze resets: After a major earnings-driven band expansion stabilizes, watch for the new squeeze that forms over the following 2–4 weeks. This reset squeeze often produces a cleaner, less headline-driven breakout that aligns with the post-earnings fundamental narrative.
Key Takeaways
Bollinger Bands Strategy — Core Principles:
- Bollinger Bands measure volatility, not direction. Context determines meaning.
- The squeeze breakout is the highest-signal setup — but wait for directional confirmation before entry.
- Mean reversion at the bands only works in ranging markets. In trends, band walks dominate — trade with them, not against them.
- Our backtested data across 14,266 squeeze signals shows a 1.03 profit factor — modest, but the edge improves meaningfully with confluence filters.
- Crypto outperforms other asset classes on Bollinger setups. Commodities consistently underperform. Asset class selection matters.
- Always combine with at least one confirming indicator: RSI, MACD, volume, or VWMA.
- Rules-based systems consistently outperform discretionary Bollinger trading over time.
How Stocks365 Uses This
🔵 Stocks365 Platform Integration
Bollinger Bands are one of 12+ indicators integrated into the Stocks365 Trust Score system. Specifically, band configuration contributes to two scoring dimensions:
- Volatility Regime Scoring: The Stocks365 algorithm calculates real-time band width percentile rank across each asset's trailing 6-month history. When band width compresses into the bottom quartile, the signal's volatility context is flagged as a squeeze environment — adjusting how breakout signals are weighted in the overall Trust Score.
- Agreement Scoring: When a Bollinger signal (squeeze breakout, band touch, or band walk) aligns with signals from RSI, MACD, and volume-based indicators simultaneously, the agreement component of the Trust Score rises. High-agreement signals — where Bollinger setup aligns with 3+ other indicators — receive elevated Trust Scores and surface more prominently in the signals dashboard.
This means Stocks365 never presents a raw Bollinger signal in isolation. Every signal you see has already been filtered through a multi-indicator agreement framework — so you're acting on context, not noise.