
What Are Bollinger Bands? Understanding the Foundation
Bollinger Bands are one of the most widely used technical indicators in modern trading, developed by legendary market analyst John Bollinger in the 1980s. Despite their age, the Bollinger Bands strategy remains as relevant as ever in 2026, adapted by traders across equities, forex, crypto, and futures markets to identify volatility, trend strength, and potential reversals.
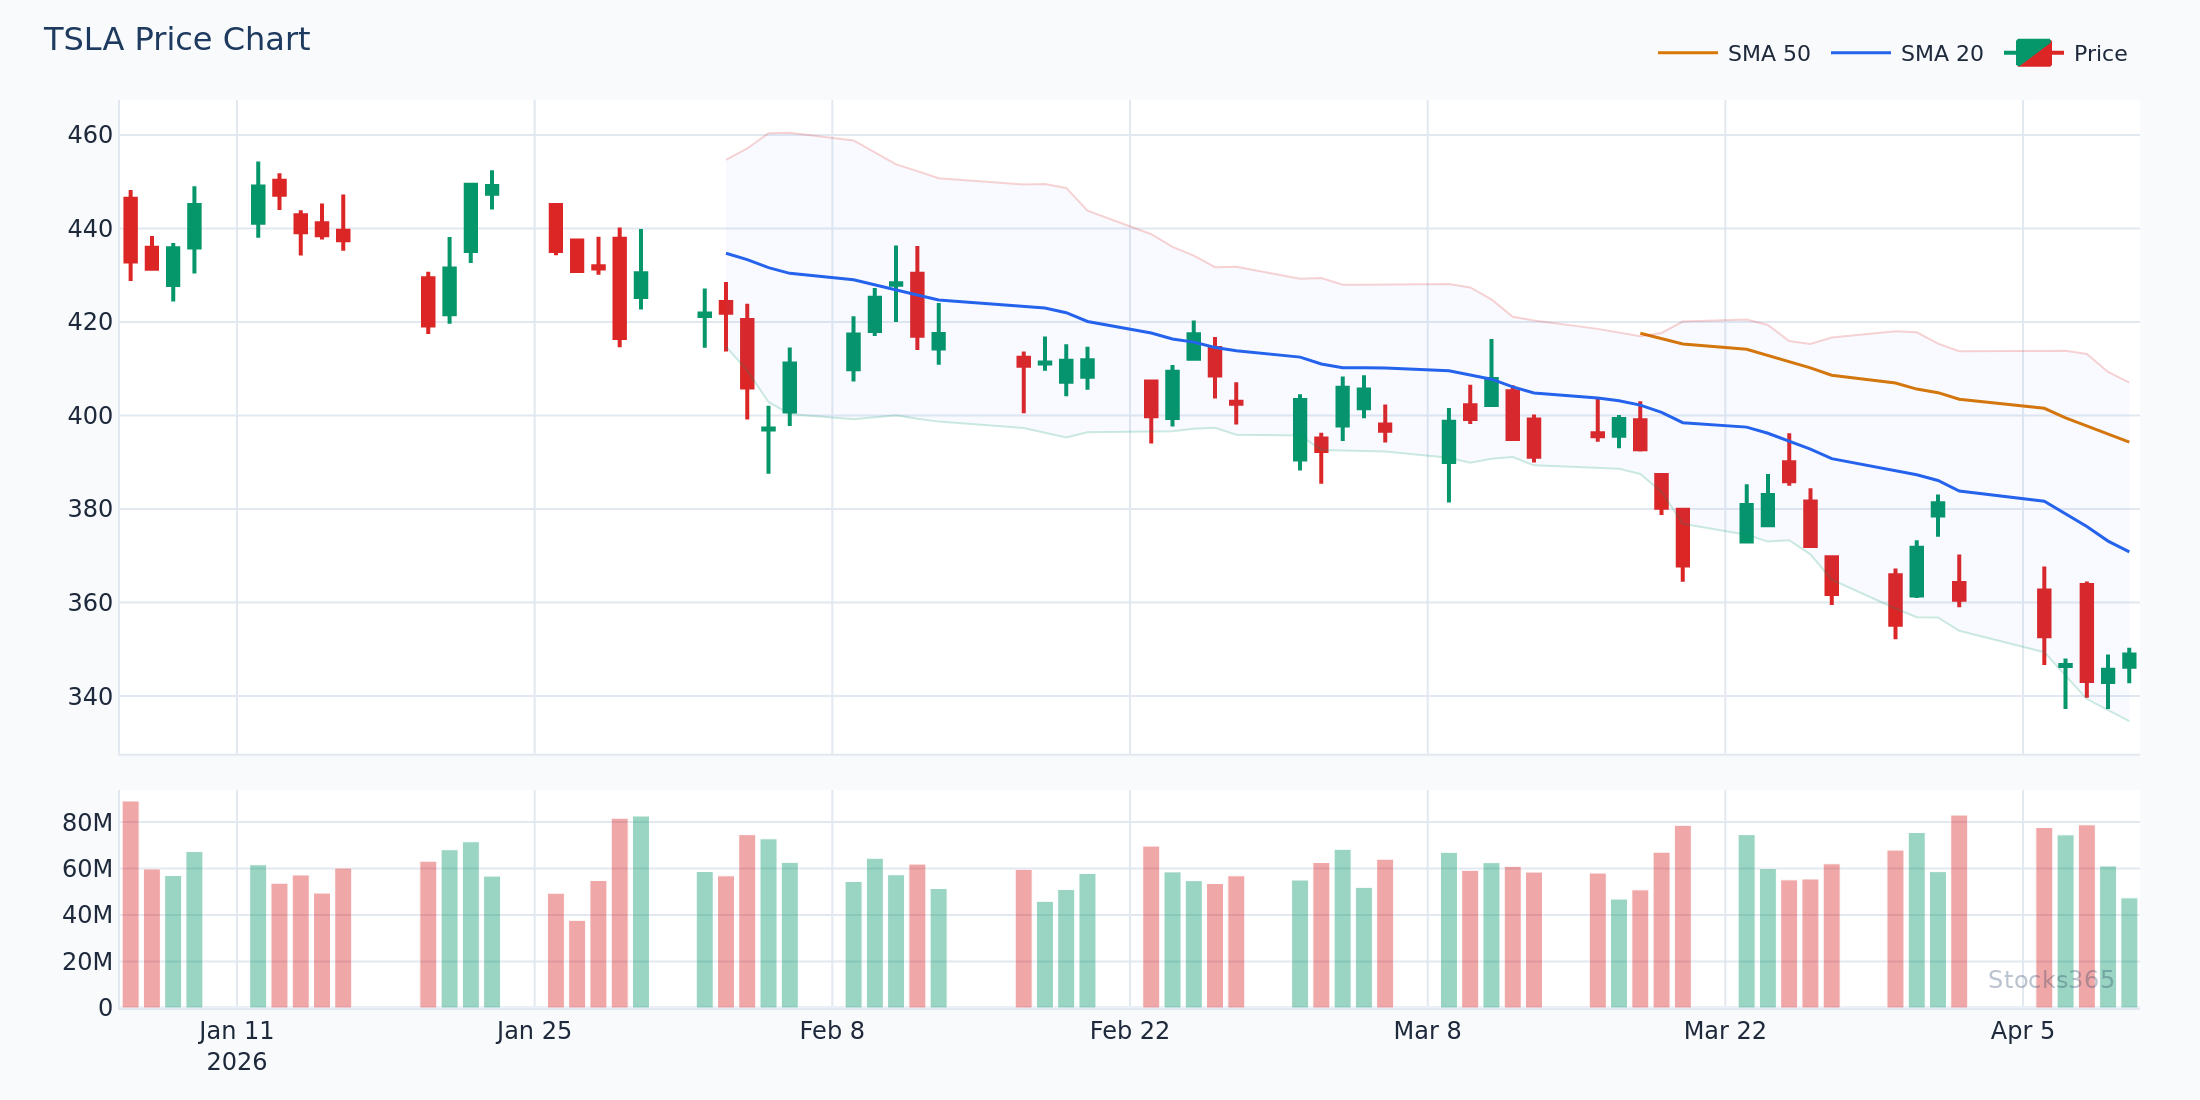
At their core, Bollinger Bands consist of three lines plotted on a price chart:
- Middle Band: A 20-period Simple Moving Average (SMA) of closing prices
- Upper Band: The middle band plus two standard deviations
- Lower Band: The middle band minus two standard deviations
The genius of this construction is that the bands automatically widen during volatile markets and contract during quiet ones. This dynamic behavior gives traders a real-time view of whether price is extended or compressed relative to recent history — information that is invaluable for timing entries and exits.
"Bollinger Bands don't give buy and sell signals directly. They create a framework for asking smarter questions about price behavior." — John Bollinger
How Bollinger Bands Work: The Statistical Logic
Standard deviation is a statistical measure of how spread out values are from their mean. When applied to price data, it tells us how far price has deviated from its average. Using two standard deviations means that, under normal conditions, approximately 95% of all price action should fall within the bands. The remaining 5% — when price pushes outside the bands — represents statistically unusual moves that deserve attention.
This mathematical foundation is why the Bollinger Bands strategy has stood the test of time. Unlike many indicators that rely on arbitrary smoothing or fixed lookback periods, Bollinger Bands are directly tied to market volatility. They self-adjust, making them useful across different assets and time frames without constant recalibration.
Default Settings and When to Adjust Them
The default settings — 20-period SMA, 2 standard deviations — work well for most day trading and swing trading applications. However, experienced traders sometimes adjust these parameters:
- Shorter periods (10-period): More sensitive bands, better for scalping or highly volatile assets like NVDA or TSLA
- Longer periods (50-period): Smoother bands, better suited to position trading or identifying major trend channels
- 1.5 standard deviations: Tighter bands that generate more signals — useful in low-volatility environments
- 2.5 standard deviations: Wider bands for extreme outlier detection, useful in crypto markets
Just as traders fine-tune RSI settings to match their specific strategy (a topic covered in depth in our guide on RSI Settings: Master the Best Period for Your Strategy), Bollinger Band parameters should be optimized for your trading style and market conditions.
The Core Bollinger Bands Trading Strategies
There are several proven approaches to trading with Bollinger Bands. Each has its own logic, risk profile, and ideal market conditions. Let's explore the most effective setups in detail.
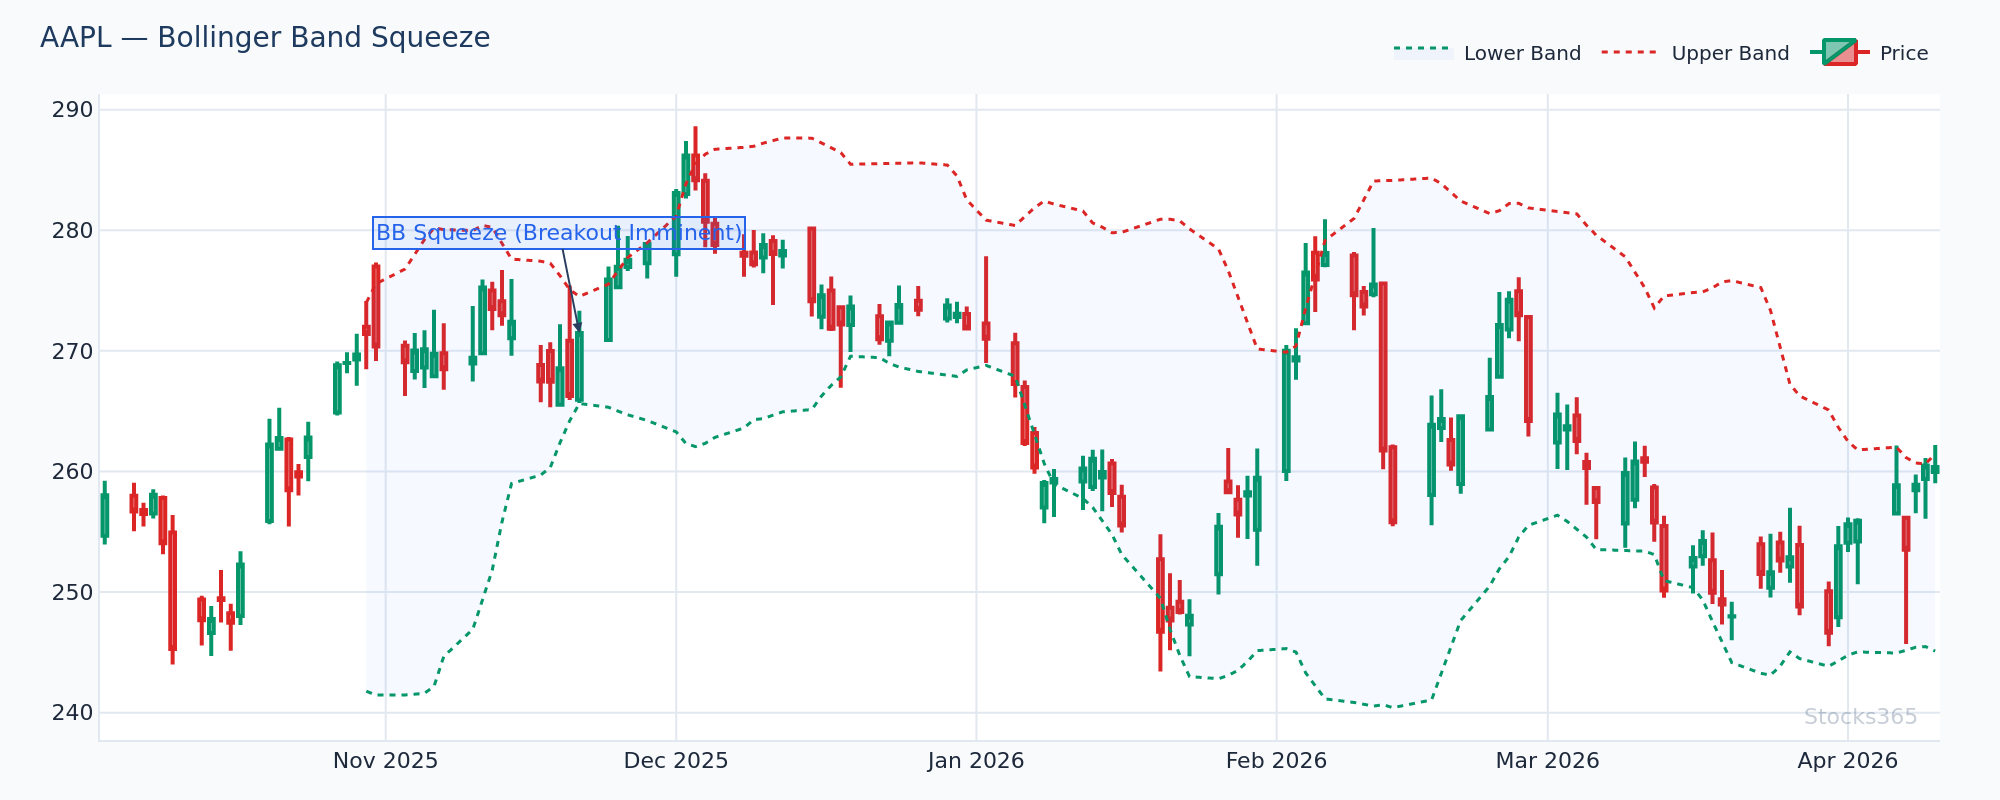
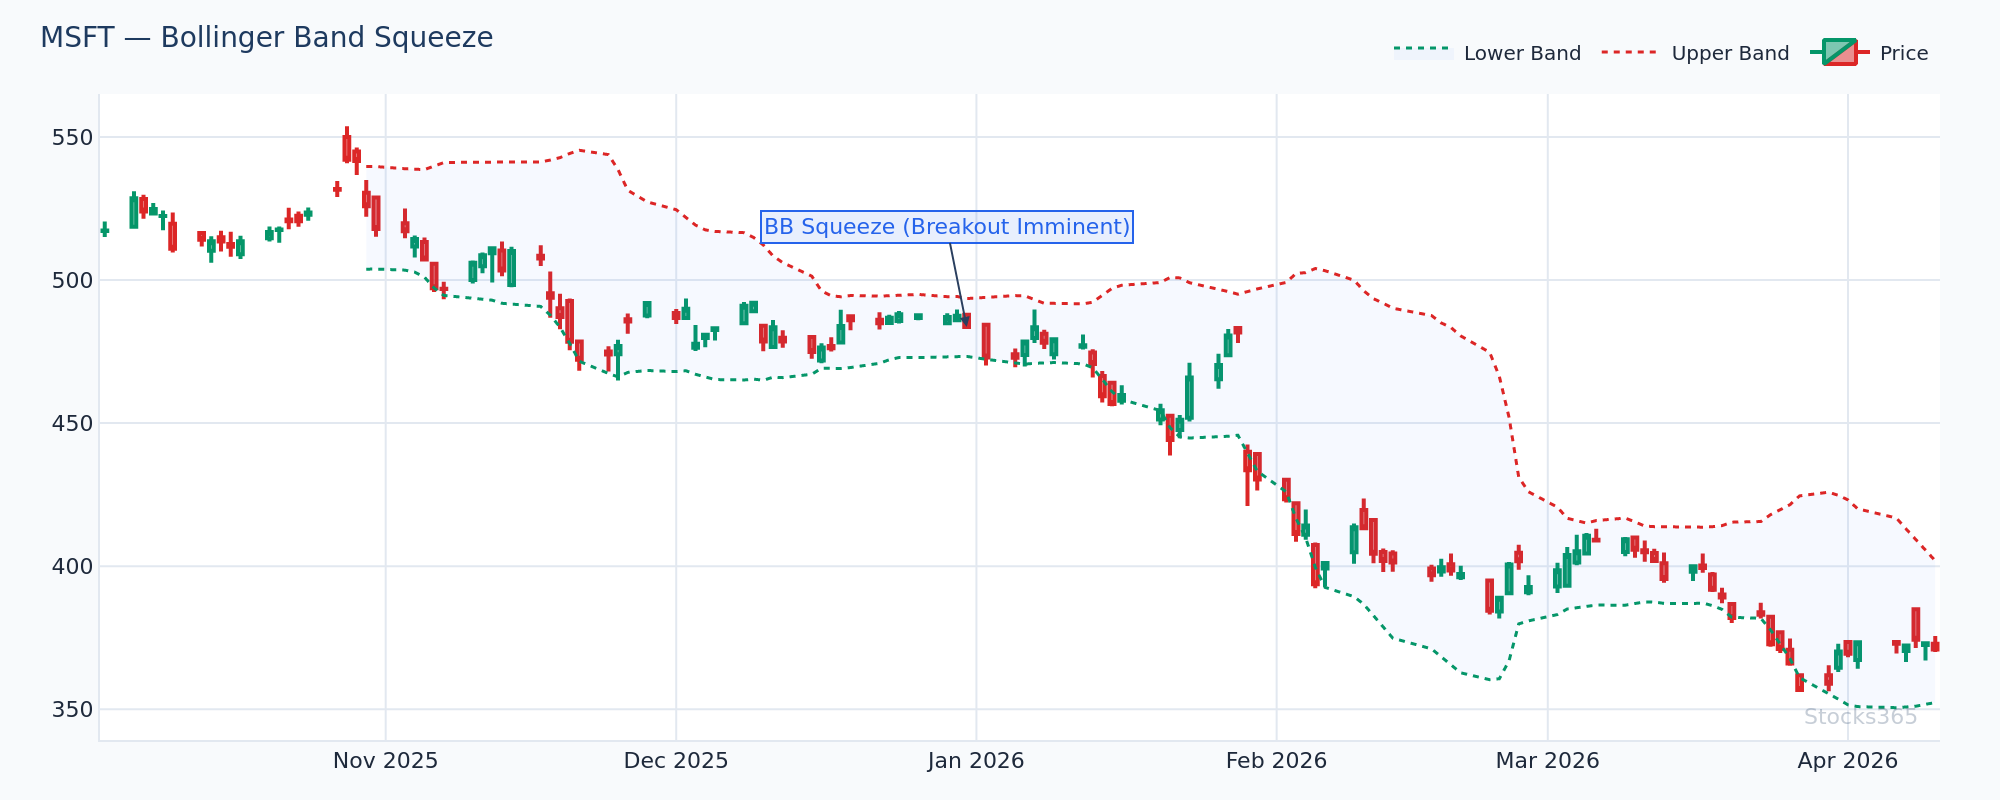
1. The Bollinger Band Squeeze Strategy
The Bollinger Band squeeze is arguably the most powerful setup in a trader's arsenal. A squeeze occurs when the bands contract to their narrowest width in recent history, indicating that volatility has compressed significantly. Markets cycle between contraction and expansion, so a squeeze often precedes a major directional move.
Here's how to trade the squeeze:
- Identify a period where the bands are visually narrow compared to recent weeks
- Watch for price to close outside either band — this signals the direction of the breakout
- Enter in the direction of the breakout with a stop-loss just inside the opposite band
- Target at least a 2:1 reward-to-risk ratio using the width of the bands as a volatility reference
Practical example: In early 2026, MSFT traded in a tight range between $410 and $425 for three weeks. The Bollinger Bands contracted to their tightest level in two months. When the stock broke above $425 with a strong earnings catalyst, the bands expanded rapidly upward. A trader entering the breakout at $427 with a stop at $418 could have targeted $445+, a clean 2:1 setup.
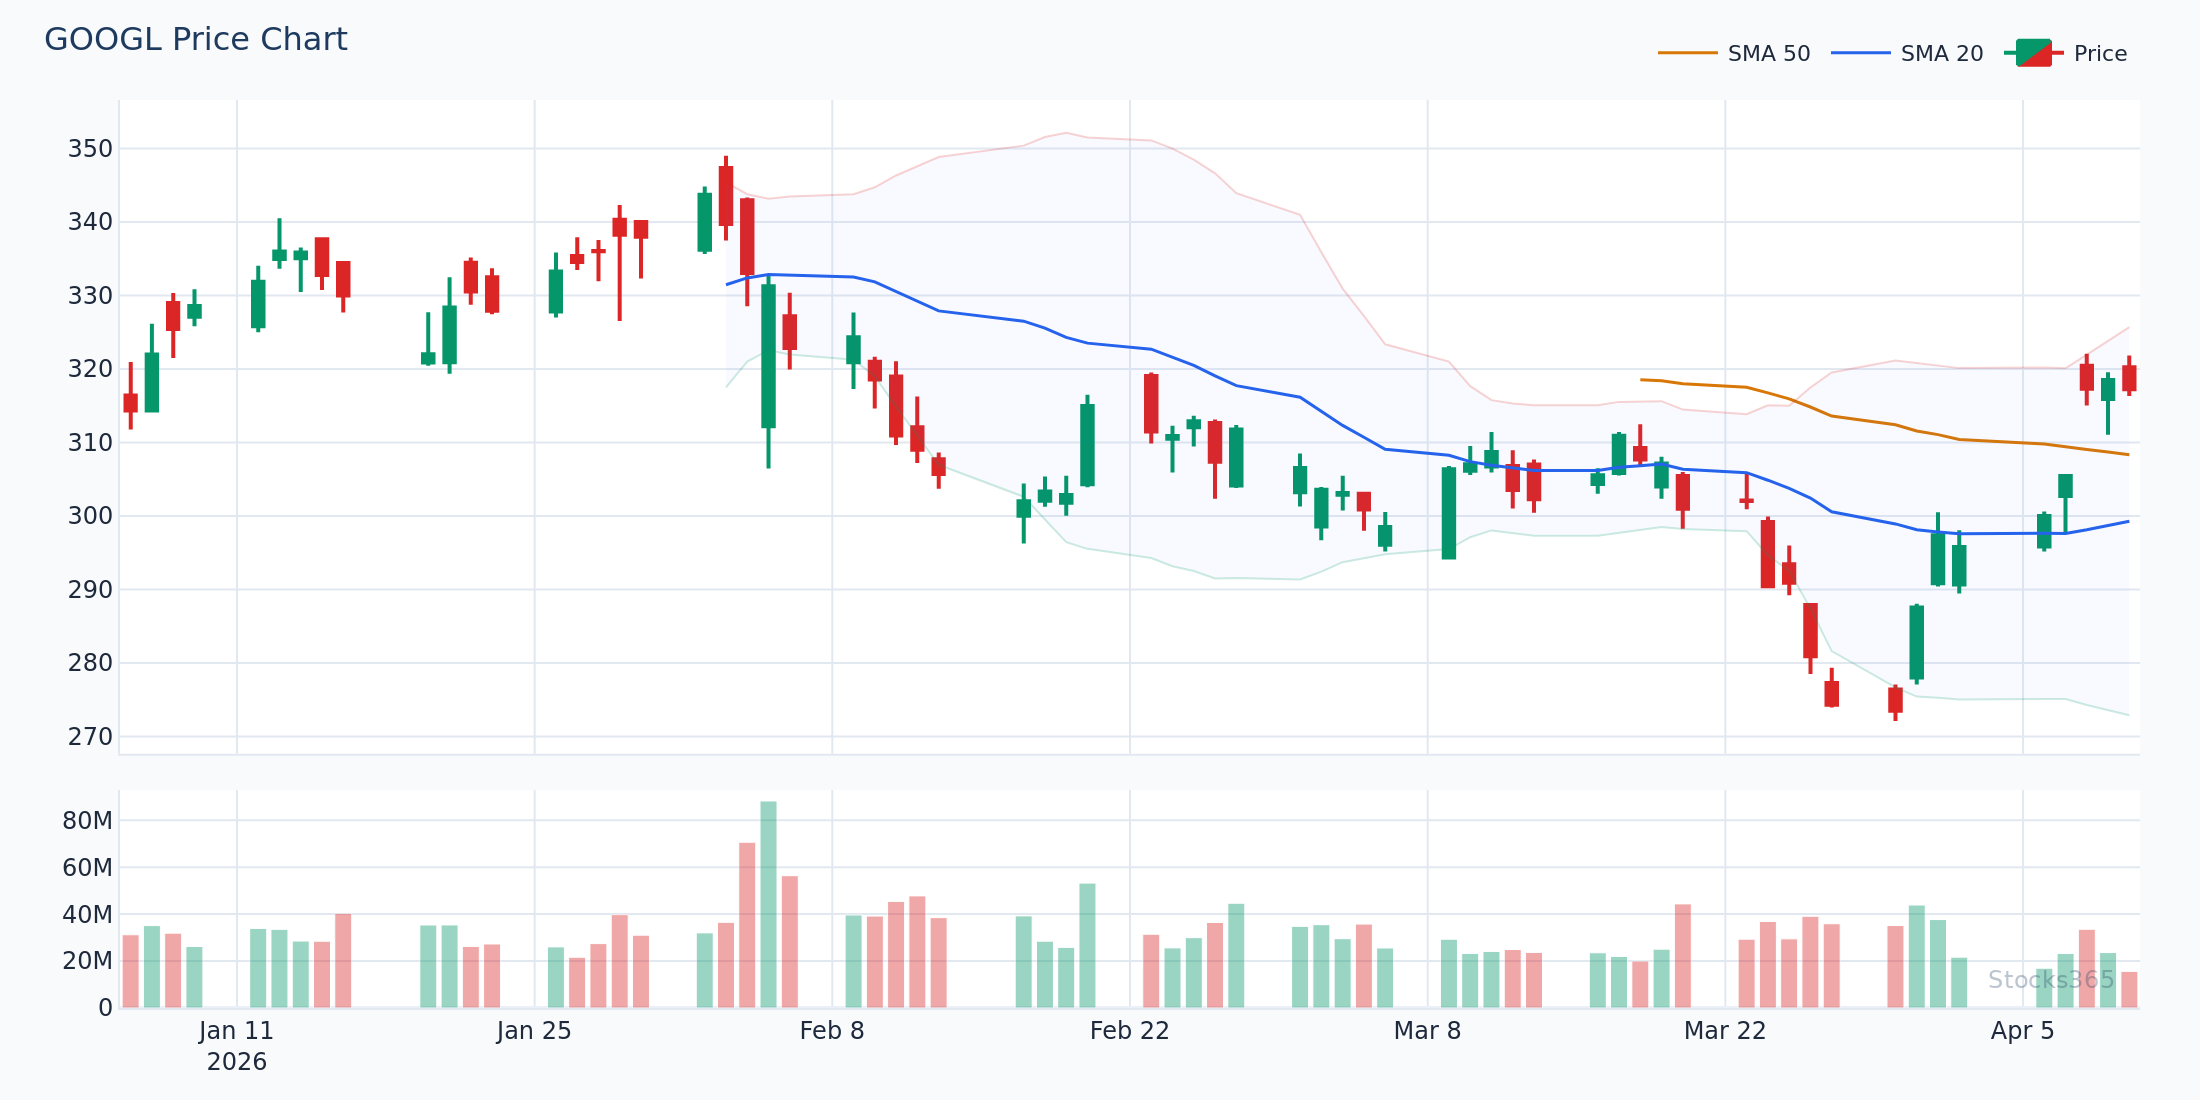
2. Walking the Bands (Trend-Following Strategy)
One of the most misunderstood aspects of Bollinger Bands is that price touching or slightly exceeding the upper band is not automatically a sell signal. In strong trends, price can "walk the bands," hugging the upper or lower band for extended periods.
During a strong uptrend:
- Price repeatedly tags or slightly exceeds the upper band
- Pullbacks find support near the middle band (20 SMA)
- The lower band is rarely touched
The trading strategy here is to buy pullbacks to the middle band during confirmed uptrends rather than shorting into upper band touches. The opposite applies in downtrends — sell bounces to the middle band rather than buying lower band touches blindly.
Practical example: NVDA exhibited a classic band-walking pattern through Q1 2026, with price consistently finding buyers at the 20-period SMA on daily pullbacks while the upper band provided a dynamic ceiling for swing trade exits.
3. The Bollinger Band Reversal Strategy (Mean Reversion)
In ranging or sideways markets, price tends to revert to the mean after touching either extreme. This creates a reliable mean reversion trading opportunity:
- Entry: Price closes outside or at the lower band in a sideways market
- Confirmation: The next candle reverses back inside the band
- Target: Middle band (20 SMA) or upper band
- Stop-loss: Below the recent low (for longs) or above the recent high (for shorts)
The key word here is confirmation. Blindly buying every lower band touch in a downtrend is a losing strategy. You need evidence that selling pressure is exhausting before entering. This is where combining Bollinger Bands with momentum indicators becomes powerful — more on that shortly.
4. The Double Bottom with Bollinger Bands (W-Bottom Pattern)
John Bollinger himself identified this pattern. The W-bottom setup occurs when:
- Price makes a first low that touches or penetrates the lower band
- Price rallies toward the middle band
- Price pulls back to form a second low that stays above the lower band (higher low)
- Price breaks back above the middle band on volume
The second low holding above the lower band while the first low touched it is the key tell — it shows that selling pressure is diminishing. The break back above the middle band is your entry trigger, with a stop-loss below the second low.
Combining Bollinger Bands with Other Indicators
The Bollinger Bands strategy reaches its full potential when used alongside complementary indicators. Bollinger Bands tell you where price is relative to volatility, but they tell you less about momentum and trend direction. Pairing them with momentum oscillators creates a powerful confirmation system.
Bollinger Bands + RSI: The Power Combination
The most popular and effective combination is Bollinger Bands with the Relative Strength Index (RSI). Here's the logic:
- When price touches the lower band and RSI is oversold (below 30), the sell signal is doubly confirmed
- When price touches the upper band and RSI is overbought (above 70), the reversal risk is significantly higher
- When price touches the lower band but RSI is not oversold, the trend may continue — be cautious about mean reversion trades
For traders new to RSI interpretation, our comprehensive guide on What Is RSI? The Complete Beginner's Guide provides an excellent foundation. To understand overbought and oversold thresholds in depth, see our dedicated article on RSI Overbought and Oversold Levels.
Even more powerful is using RSI divergence with Bollinger Band extremes. When price makes a new low at the lower band but RSI makes a higher low, that bullish divergence combined with a band touch is one of the highest-probability reversal setups available. Our guides on RSI Divergence: Master Bullish and Bearish Signals and Hidden RSI Divergence cover these advanced concepts in detail.
Bollinger Bands + Stochastic Oscillator
The Stochastic Oscillator is another excellent companion indicator. Like RSI, it measures momentum, but it's particularly sensitive to short-term overbought and oversold conditions. When Stochastic crosses bullishly below 20 at the same time price is at or near the lower Bollinger Band, that confluence creates a high-confidence entry. Our article comparing RSI vs Stochastic Oscillator explains which oscillator works best for different market conditions and trading styles.
Bollinger Bands + Volume
Volume is often the missing ingredient in Bollinger Band strategies. A breakout from a squeeze means far more when accompanied by above-average volume. Low-volume breakouts from squeezes frequently fail and reverse, trapping momentum traders. Always check volume before committing capital to a breakout setup.
Bollinger Bands in Different Market Conditions
Understanding when to apply each Bollinger Bands strategy is as important as understanding the strategies themselves. Different market conditions call for different approaches.
Trending Markets
In a strong trend, use Bollinger Bands as a dynamic trend channel. Buy dips to the middle band (20 SMA) during uptrends. The upper band becomes a profit target rather than a reversal signal. Treat any close below the middle band as a potential warning sign that the trend is weakening.
Ranging or Sideways Markets
This is where mean reversion setups shine. When price oscillates between the upper and lower bands without making new highs or lows, fading extremes (selling upper band touches, buying lower band touches) with tight stop-losses can be highly effective. Always confirm that the market is genuinely ranging by checking that the bands themselves are relatively horizontal.
Volatile or News-Driven Markets
During high-volatility events — earnings releases, Fed announcements, major geopolitical events — Bollinger Bands expand rapidly. Be cautious about mean reversion trades during band expansion. Wait for volatility to normalize and the bands to begin contracting again before re-engaging with range strategies.
Using Stocks365 Signals with Bollinger Band Analysis
While manual chart analysis is invaluable, platforms like Stocks365's signals dashboard can significantly streamline your workflow. The platform's trust score system aggregates multiple technical and fundamental signals, giving each stock a composite rating that reflects the weight of evidence — much like the confluence approach we advocate for Bollinger Band trading.
For example, when reviewing AAPL's signal page, you can cross-reference the platform's technical signal rating with your own Bollinger Band analysis on the daily or hourly chart. A high trust score combined with a Bollinger Band squeeze setup creates a particularly compelling opportunity — you have both quantitative signal strength and a clear technical trigger point working in your favor.
Combining AI-assisted signal generation with your own chart reading creates a hybrid approach that's more robust than either method alone. The Stocks365 trust score acts as a pre-filter, helping you focus your Bollinger Band analysis on the stocks most likely to deliver meaningful moves.
Common Bollinger Bands Mistakes to Avoid
Even experienced traders fall into these traps. Awareness is the first step to avoidance:
- Buying every lower band touch in a downtrend: In a strong downtrend, price can hug the lower band for weeks. Always identify the broader trend first.
- Ignoring the middle band: The 20-period SMA is not just a reference line — it's a dynamic support/resistance level and a critical signal in its own right.
- Trading squeezes without confirmation: Not every squeeze resolves with a big move. Wait for a confirmed breakout candle before entering.
- Using Bollinger Bands in isolation: As discussed, pairing with momentum indicators dramatically improves signal quality. Refer to our step-by-step guide on How to Use RSI in Trading for a practical framework you can adapt.
- Overtrading small band touches: Not every minor band touch is tradeable. Focus on clean, textbook setups with clear stop-loss and target levels.
Backtesting Your Bollinger Bands Strategy
Before committing real capital to any Bollinger Bands strategy, rigorous backtesting is essential. Here's a simple framework:
- Define rules precisely: What constitutes a valid squeeze? What confirms a breakout? What is your exact entry trigger?
- Select a representative sample: Test across at least 100 trades in your target market over a minimum of two years
- Track key metrics: Win rate, average win vs. average loss, maximum drawdown, expectancy
- Test across market regimes: Include trending and ranging periods in your sample
- Walk-forward test: After optimizing on historical data, test on out-of-sample data to check for overfitting
Understanding the mathematics behind technical indicators deepens your ability to backtest effectively. Just as our guide on How RSI Is Calculated helps traders understand the RSI formula, knowing the statistical mechanics of Bollinger Bands helps you make informed decisions about parameter adjustments.
Key Takeaways
Bollinger Bands Strategy — Essential Summary:
- Bollinger Bands consist of a 20-period SMA flanked by upper and lower bands set at 2 standard deviations — they dynamically reflect market volatility
- The Bollinger Band squeeze (bands contracting) is one of the highest-probability setups, signaling an imminent volatility expansion and directional move
- In strong trends, price "walks the bands" — buying pullbacks to the middle band is more effective than fading upper band touches
- Mean reversion setups at band extremes work best in sideways, ranging markets with clear upper and lower boundaries
- Always combine Bollinger Bands with momentum indicators (RSI, Stochastic) for confirmation — confluence dramatically improves win rates
- The W-bottom pattern (first low touches lower band, second low holds above it) is a powerful reversal signal identified by Bollinger himself
- Volume confirmation is essential for breakout strategies — low-volume squeezes frequently fail
- Platforms like Stocks365 can augment your Bollinger Band analysis with trust score data for smarter stock selection
Frequently Asked Questions
What is the best Bollinger Bands strategy for beginners?
The best starting point for beginners is the middle band pullback strategy in trending markets. This involves identifying a stock in a clear uptrend, waiting for price to pull back to the 20-period SMA (middle band), and entering when price bounces back up. This approach is straightforward, aligns with the trend, and provides a clear stop-loss level (below the middle band). It avoids the complexity of squeeze timing or mean reversion signals.
Do Bollinger Bands work in all markets?
Bollinger Bands are applicable across equities, forex, crypto, commodities, and futures. However, their effectiveness varies by market condition. They work exceptionally well in trending and ranging environments but can generate false signals during choppy, news-driven volatility spikes. The key is to identify the prevailing market condition first and select your Bollinger Band strategy accordingly.
How do I combine Bollinger Bands with RSI?
The most effective combination uses RSI to confirm Bollinger Band signals. For buy signals: look for price at or below the lower band while RSI is simultaneously at or below 30 (oversold). For sell signals: look for price at or above the upper band while RSI is at or above 70 (overbought). RSI divergence at band extremes — where price makes a new extreme but RSI does not — provides even higher-probability reversal signals. See our full RSI trading guide for a step-by-step walkthrough.
What does a Bollinger Band squeeze mean?
A Bollinger Band squeeze occurs when the upper and lower bands converge to their narrowest distance in recent history, indicating that market volatility has compressed significantly. It's a signal that the market is coiling — building energy for a significant directional move. The squeeze itself does not indicate direction; traders wait for a confirmed breakout (price closing decisively outside either band) to determine which way to trade.
Are Bollinger Bands a leading or lagging indicator?
Bollinger Bands are primarily a lagging indicator because the middle band is a moving average of historical prices. However, the squeeze condition and band width measurements have a forward-looking quality — they identify low-volatility environments that tend to precede large moves. Think of them as a leading indicator for volatility but a lagging indicator for price direction. This is precisely why combining them with momentum oscillators like RSI, which can signal directional shifts earlier, creates such a powerful analytical framework.