
Bollinger Bands vs RSI: Which Indicator Is Better for Trading?
Two indicators dominate retail trading screens: Bollinger Bands and the Relative Strength Index. Every beginner asks the same question — which one is better? The honest answer might surprise you.
Neither is better. But one may be far more useful for your specific strategy.
This guide breaks down exactly what each indicator measures, where each one excels, where each one fails, and — most importantly — how combining them creates setups that neither produces alone.
What Bollinger Bands Actually Measure
Bollinger Bands are a volatility and price envelope tool developed by John Bollinger in the 1980s. The indicator plots three lines: a middle band (typically a 20-period simple moving average), an upper band two standard deviations above the SMA, and a lower band two standard deviations below it.
The bands expand when volatility rises. They contract when volatility falls. That's the core mechanic.
When price touches or breaches the upper band, it's statistically extended relative to recent price action. When it touches the lower band, the opposite is true. But — and this is critical — touching a band is not a signal by itself.
In a strong uptrend, price can ride the upper band for extended periods without reversing. This is one of the most common traps traders fall into when first using Bollinger Bands.
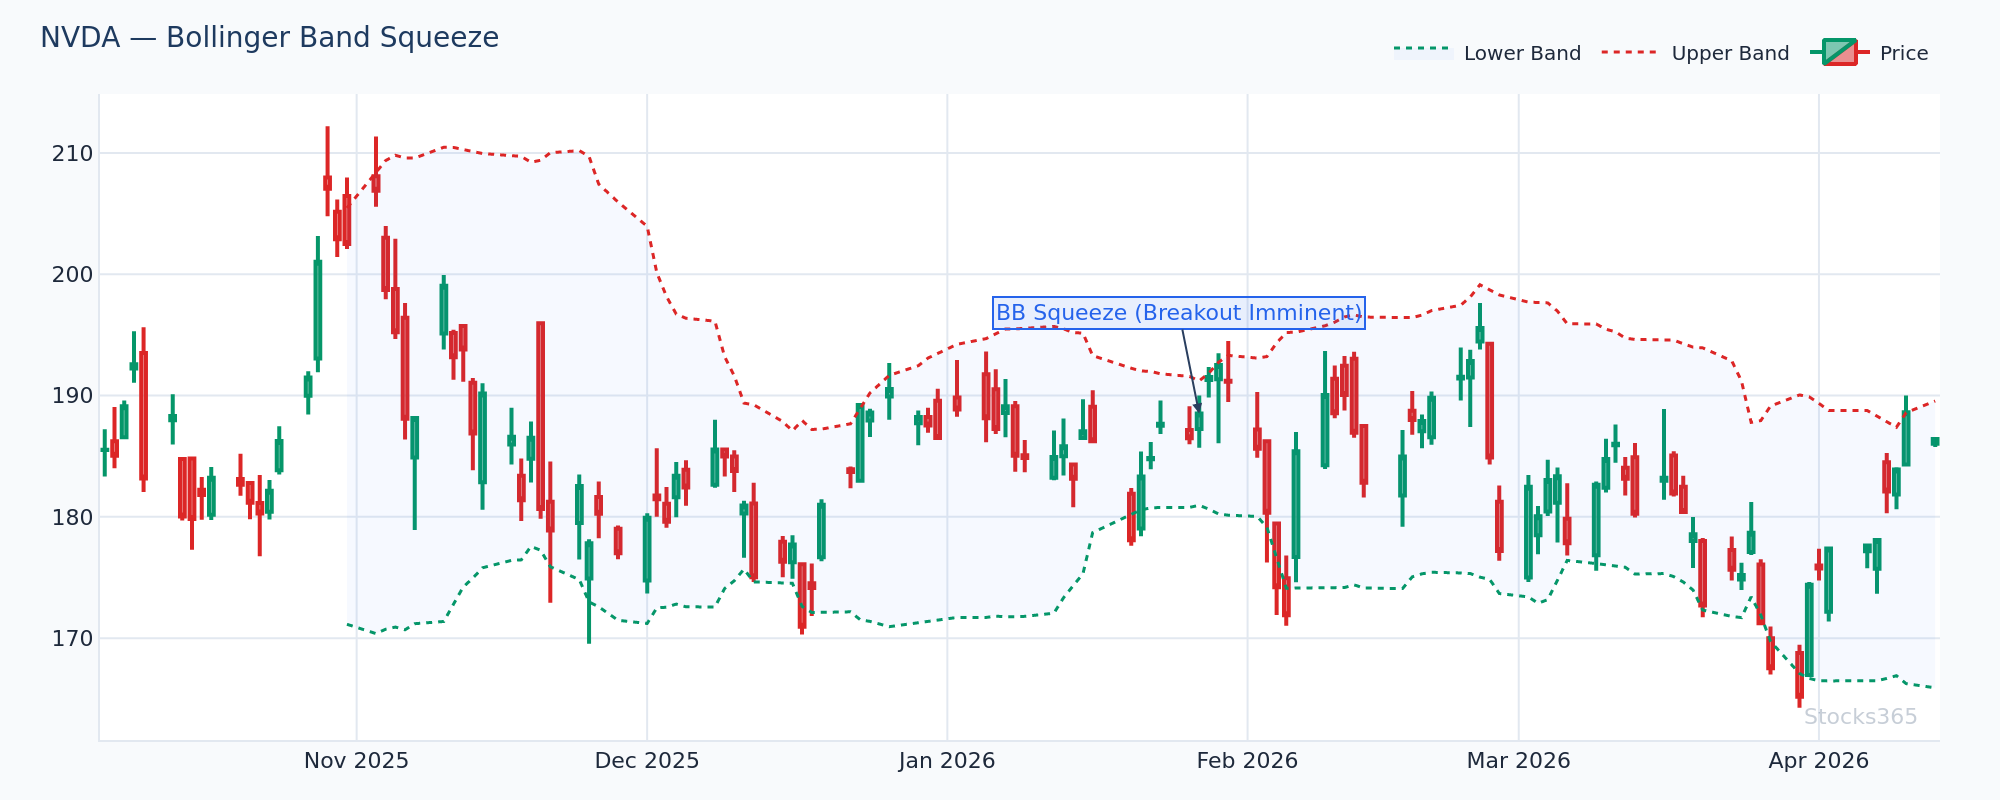
This chart shows NVDA in a classic Bollinger squeeze — band width has contracted sharply, signaling that a volatility expansion is imminent. The direction of the breakout (upper or lower band breach) combined with volume is what confirms the trade. A false breakout typically reverses back inside the bands within 1-2 candles.
The Bollinger Squeeze: One of the Most Powerful Setups
The Bollinger squeeze occurs when the bands narrow significantly — often to their lowest bandwidth in 20+ sessions. This compression reflects a period of low volatility, which historically precedes a sharp directional move.
Watch for Bollinger squeeze breakouts on high-momentum names. When band width drops below the 20th percentile of its recent range, the subsequent expansion frequently produces a move of two to three ATRs — either direction.
What RSI Actually Measures
The Relative Strength Index is a momentum oscillator that measures the speed and magnitude of recent price changes on a scale of 0 to 100. Developed by J. Welles Wilder in 1978, RSI compares average gains to average losses over a lookback period — typically 14 periods.
Readings above 70 traditionally signal overbought conditions. Readings below 30 signal oversold. But momentum is more nuanced than that. If you want a deep dive into the math behind it, our guide on how RSI is calculated walks through the formula step by step.
RSI excels at identifying divergence — when price makes a new high but RSI fails to confirm it. That disconnect often precedes reversals. For a full breakdown of how to use divergence as an edge, see our guide on RSI divergence signals.
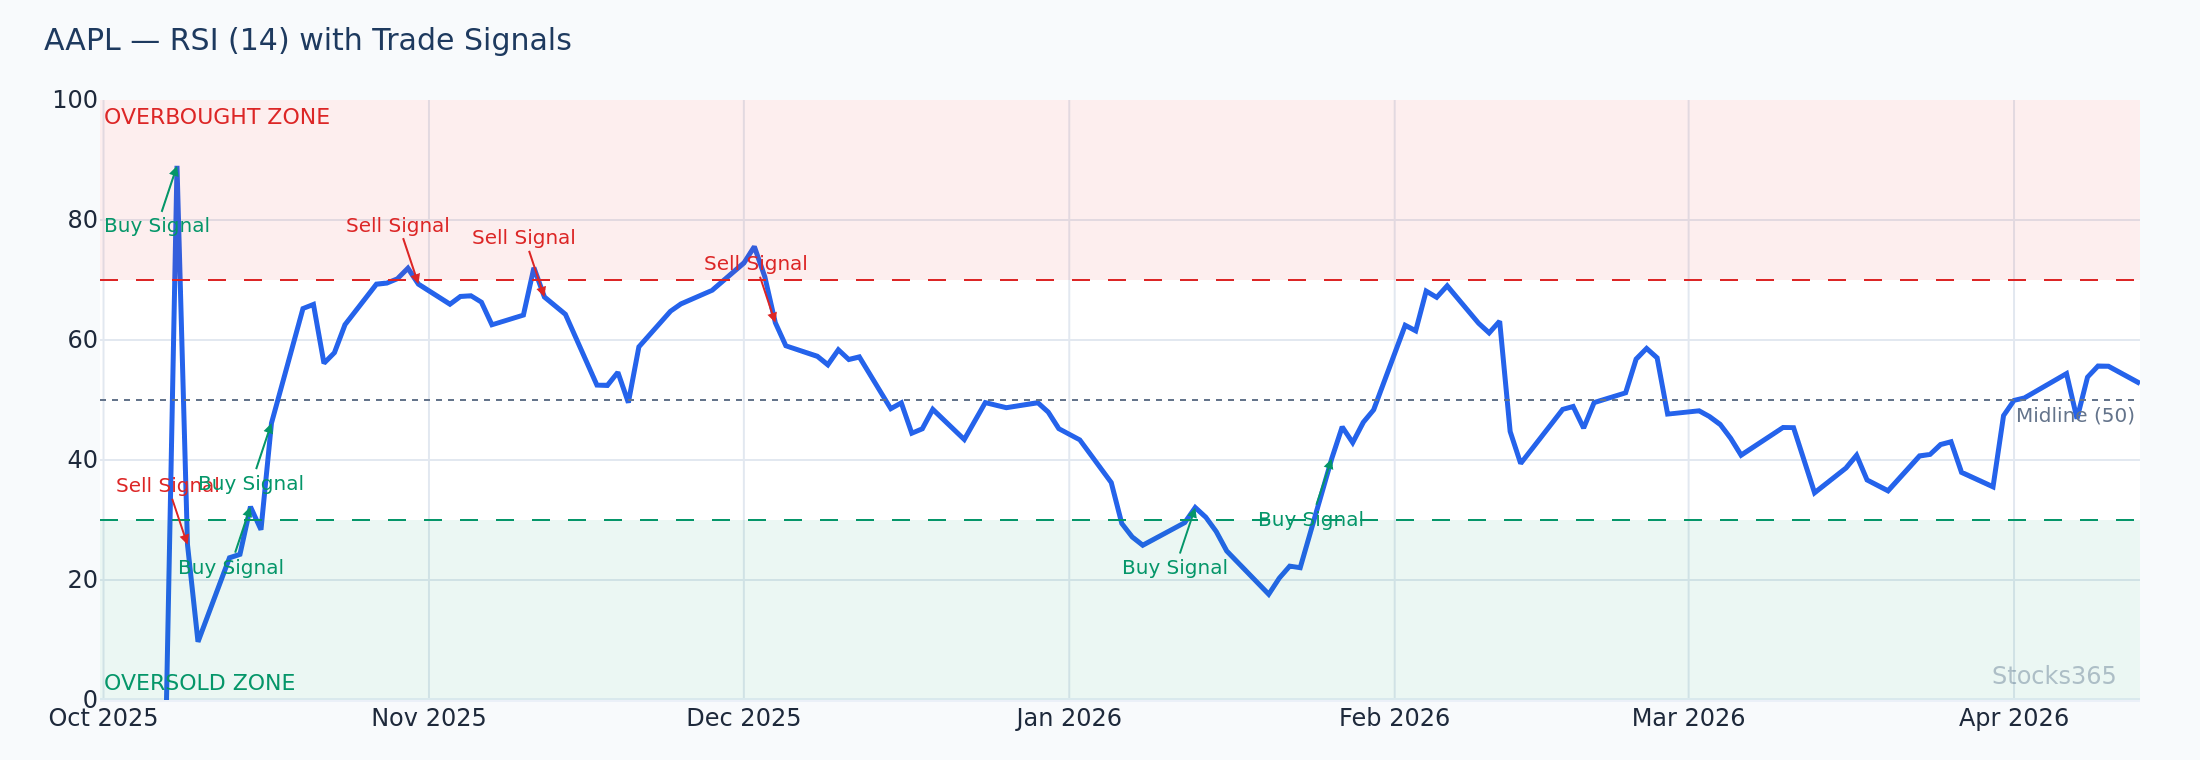
This chart highlights a bearish RSI divergence on AAPL — price is making a higher high while RSI prints a lower high. This momentum divergence doesn't guarantee a reversal, but it shifts the probability. Confirmation comes when price breaks below a recent swing low or when RSI drops decisively below 50.
Here's What Most Traders Get Wrong About RSI
Most traders treat RSI 70 as an automatic sell signal. In strong trending markets, RSI stays above 70 for weeks — sometimes months. Selling every time RSI touches 70 in a bull trend is a losing strategy. The real edge is watching RSI break back below 70 after an extended overbought run. That reversal of momentum, not the initial overbought reading, is where the signal lives.
Similarly, RSI below 30 in a strong downtrend is not a buy signal — it's confirmation the trend is working. The setup forms when RSI recovers back above 30 with price stabilizing.
For more on calibrating overbought and oversold thresholds for different assets and timeframes, see our detailed breakdown of RSI overbought and oversold levels.
Bollinger Bands vs RSI: Head-to-Head Comparison
Let's put these two indicators directly against each other across the dimensions that matter most to active traders.
Signal Type
- Bollinger Bands: Price-relative signals. Bands tell you where price is relative to its recent volatility envelope.
- RSI: Momentum signals. RSI tells you how fast price is moving and whether buying or selling pressure is dominant.
These are fundamentally different measurements. One is about where price is. The other is about how fast it got there.
Trending vs. Ranging Markets
- Bollinger Bands perform better in ranging markets for mean-reversion trades. In trends, the squeeze-to-breakout setup works well, but simple band-touch reversals fail frequently.
- RSI performs better in trending markets for momentum confirmation. RSI divergence is particularly powerful for identifying when a trend is losing steam.
Lagging vs. Leading Characteristics
Both indicators are primarily lagging — they're derived from past price data. But RSI tends to give slightly earlier signals on momentum shifts, while Bollinger Bands are inherently reactive to volatility changes that have already occurred.
Neither indicator predicts the future. Both increase the probability of being on the right side of a move.
Ease of Interpretation
- Bollinger Bands are visually intuitive — the bands are overlaid directly on price, making pattern recognition faster.
- RSI requires learning to read a separate oscillator and understanding divergence, which has a steeper learning curve.
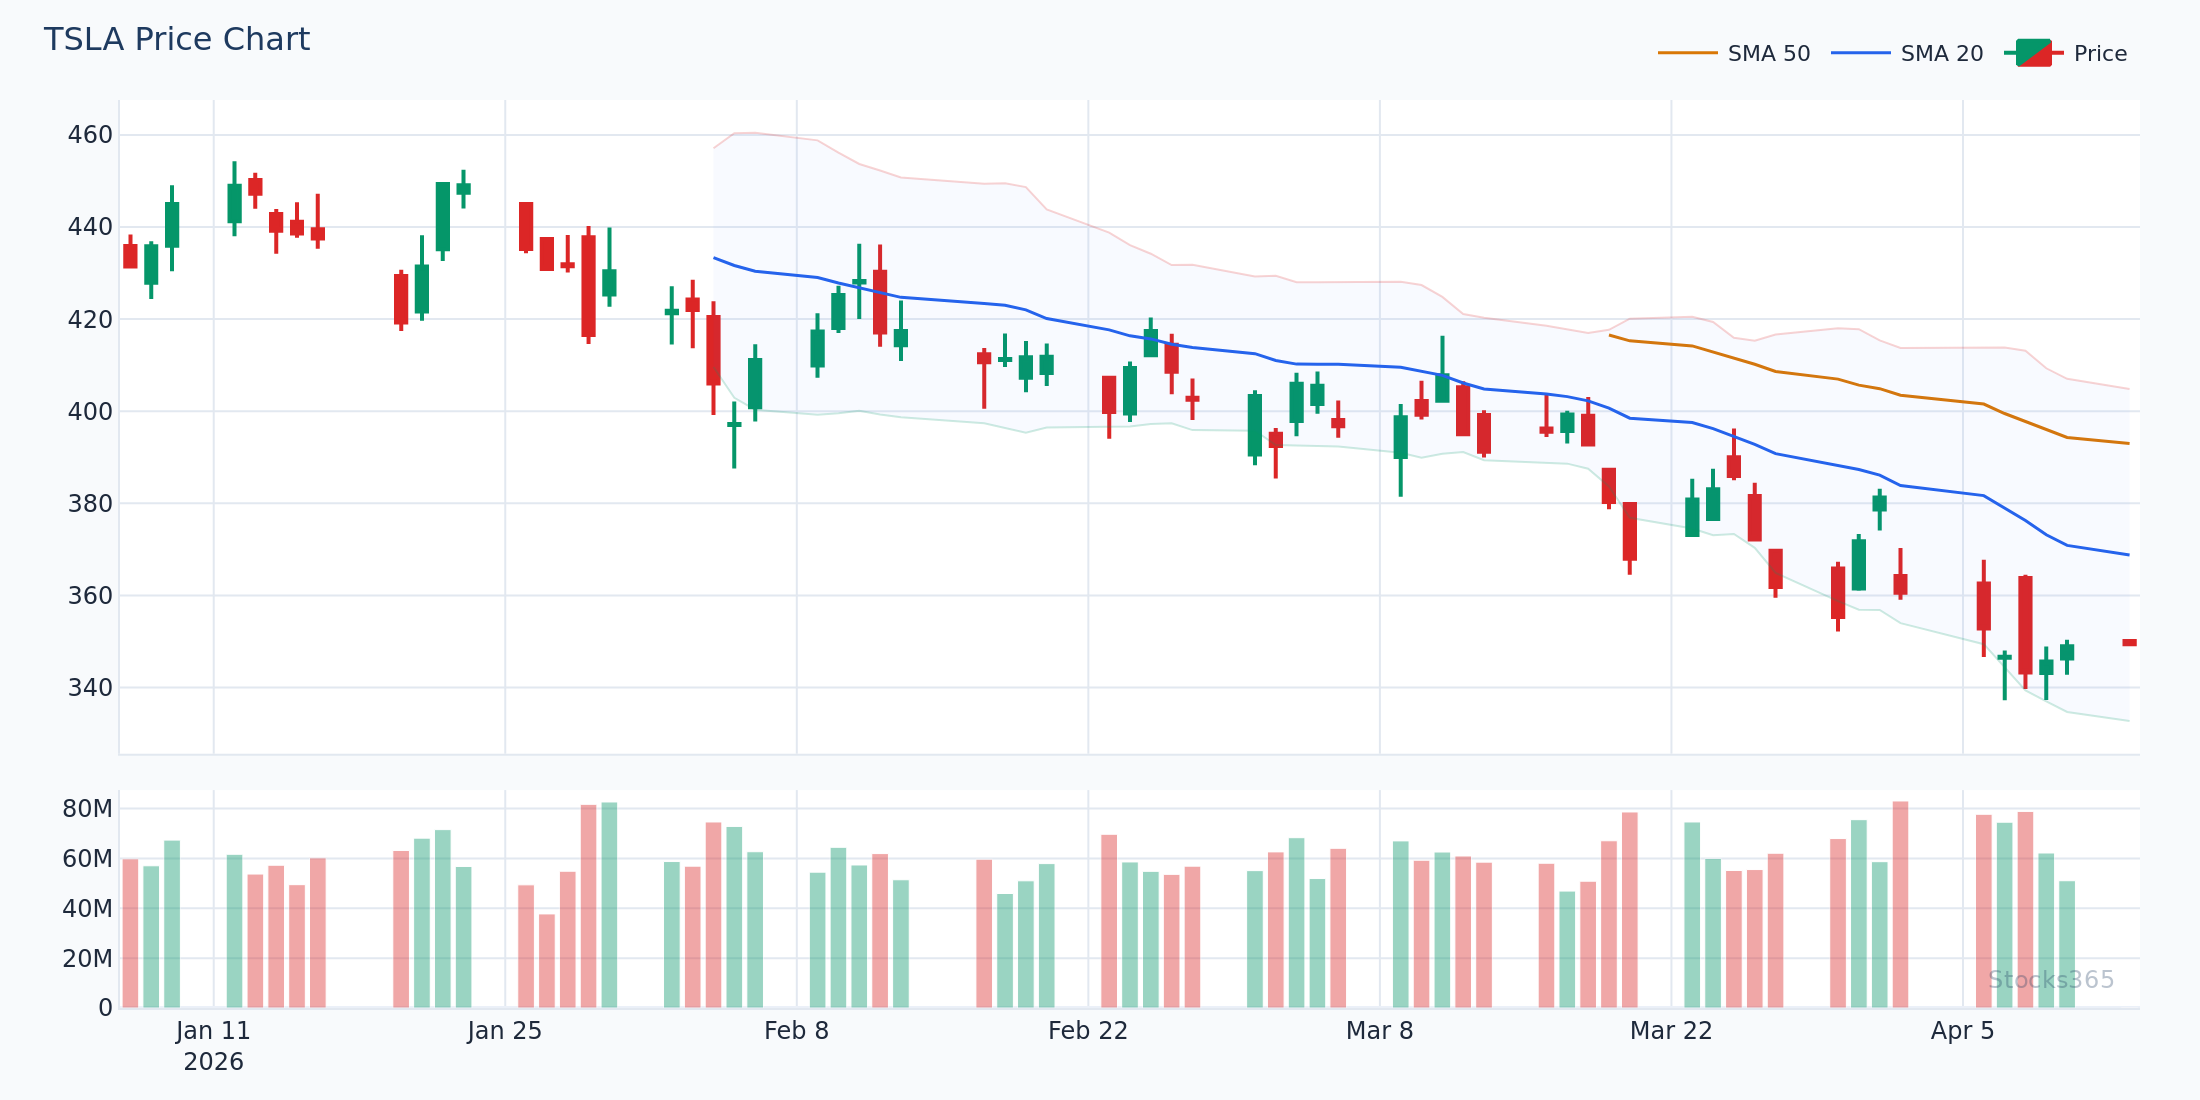
This setup shows TSLA rejecting the upper Bollinger Band after a rapid expansion from a squeeze. Note how volume confirmation matters here — a rejection without elevated volume often fails to follow through. A close back inside the band on above-average volume strengthens the mean-reversion case significantly.
The Real Performance Data: What the Numbers Say
Theoretical comparisons are useful. But data cuts through the debate faster.
Our analysis of 3,691 RSI overbought reversal signals found a 47.0% win rate over a 10-day holding period, with a profit factor of 0.85. Critically, performance varied dramatically by asset class — crypto led with a 65.3% win rate, while commodities lagged at just 40.7%. The headline number looks weak, but the asset-class breakdown tells a much more actionable story. See the full dataset at Stocks365 Insights.
Stocks365 research across 3,278 Bollinger Upper Band touch signals showed a 49.8% win rate with a profit factor of 0.89 — marginally stronger than isolated RSI overbought signals, but still below 50% as a standalone trigger. Again, crypto outperformed at 56.8%, and commodities underperformed at 42.0%.
The takeaway is sharp: neither indicator produces an edge in isolation. Asset class selection and confluence matter far more than which indicator you choose.
When Bollinger Bands Win
Bollinger Bands have a clear advantage in specific scenarios:
- Volatility trading: The squeeze setup is unmatched for identifying pre-breakout compression. No single-line oscillator replicates this.
- Mean-reversion in ranges: When price oscillates between clear support and resistance, band-touch entries with candlestick confirmation work consistently.
- Visual clarity: For traders who want context overlaid on price directly, bands provide immediate visual reference without a second chart panel.
- Identifying abnormal moves: Price beyond two standard deviations is statistically rare. Bands quantify how unusual a move is in real time.
When RSI Wins
RSI has clear advantages in its own domain:
- Divergence detection: RSI divergence — particularly hidden divergence — is one of the highest-probability reversal signals available to discretionary traders.
- Trend strength confirmation: RSI holding above 50 in an uptrend confirms the trend is healthy. A drop below 50 is often the first warning of regime change.
- Momentum timing: For entering pullbacks in strong trends, RSI dipping to 40-50 before recovering is a cleaner entry trigger than waiting for a band touch.
- Multi-timeframe analysis: RSI scales well across timeframes. Weekly RSI above 50 + daily RSI recovering from oversold is a powerful confluence that bands don't easily replicate.
To get the most out of RSI, the period setting matters enormously. A 14-period RSI behaves very differently from a 7-period or 21-period version. Our guide on RSI settings and period selection covers how to match the setting to your timeframe and strategy.
The Real Answer: Combining Bollinger Bands and RSI
Stop treating this as a competition. The most effective setups use both indicators together to create confluence-based entries that neither produces alone.
Setup 1: Bollinger Lower Band + RSI Oversold Recovery
Price tags the lower Bollinger Band. RSI simultaneously drops below 30 and then begins recovering back above 30. The entry signal is the RSI recrossing 30 while price stabilizes inside the band. This dual confirmation reduces false signals substantially compared to acting on either trigger alone.
Confirmation: A bullish candlestick pattern (engulfing, hammer) at the lower band on above-average volume seals the setup.
Setup 2: Bollinger Squeeze + RSI Momentum Confirmation
Bands compress into a squeeze. RSI sits near 50 — neutral momentum. When the breakout fires and price breaches the upper band, RSI simultaneously accelerating above 55-60 confirms the move has genuine momentum behind it. A breakout with RSI stalling near 50 is a warning sign — the move may be false.
Setup 3: Upper Band Touch + Bearish RSI Divergence
Price rallies to tag the upper Bollinger Band. At the same time, RSI is making a lower high than the previous upper-band touch. This combination — band extension plus momentum divergence — is one of the cleanest reversal setups in technical analysis. The confluence shifts probability significantly in favor of a pullback.
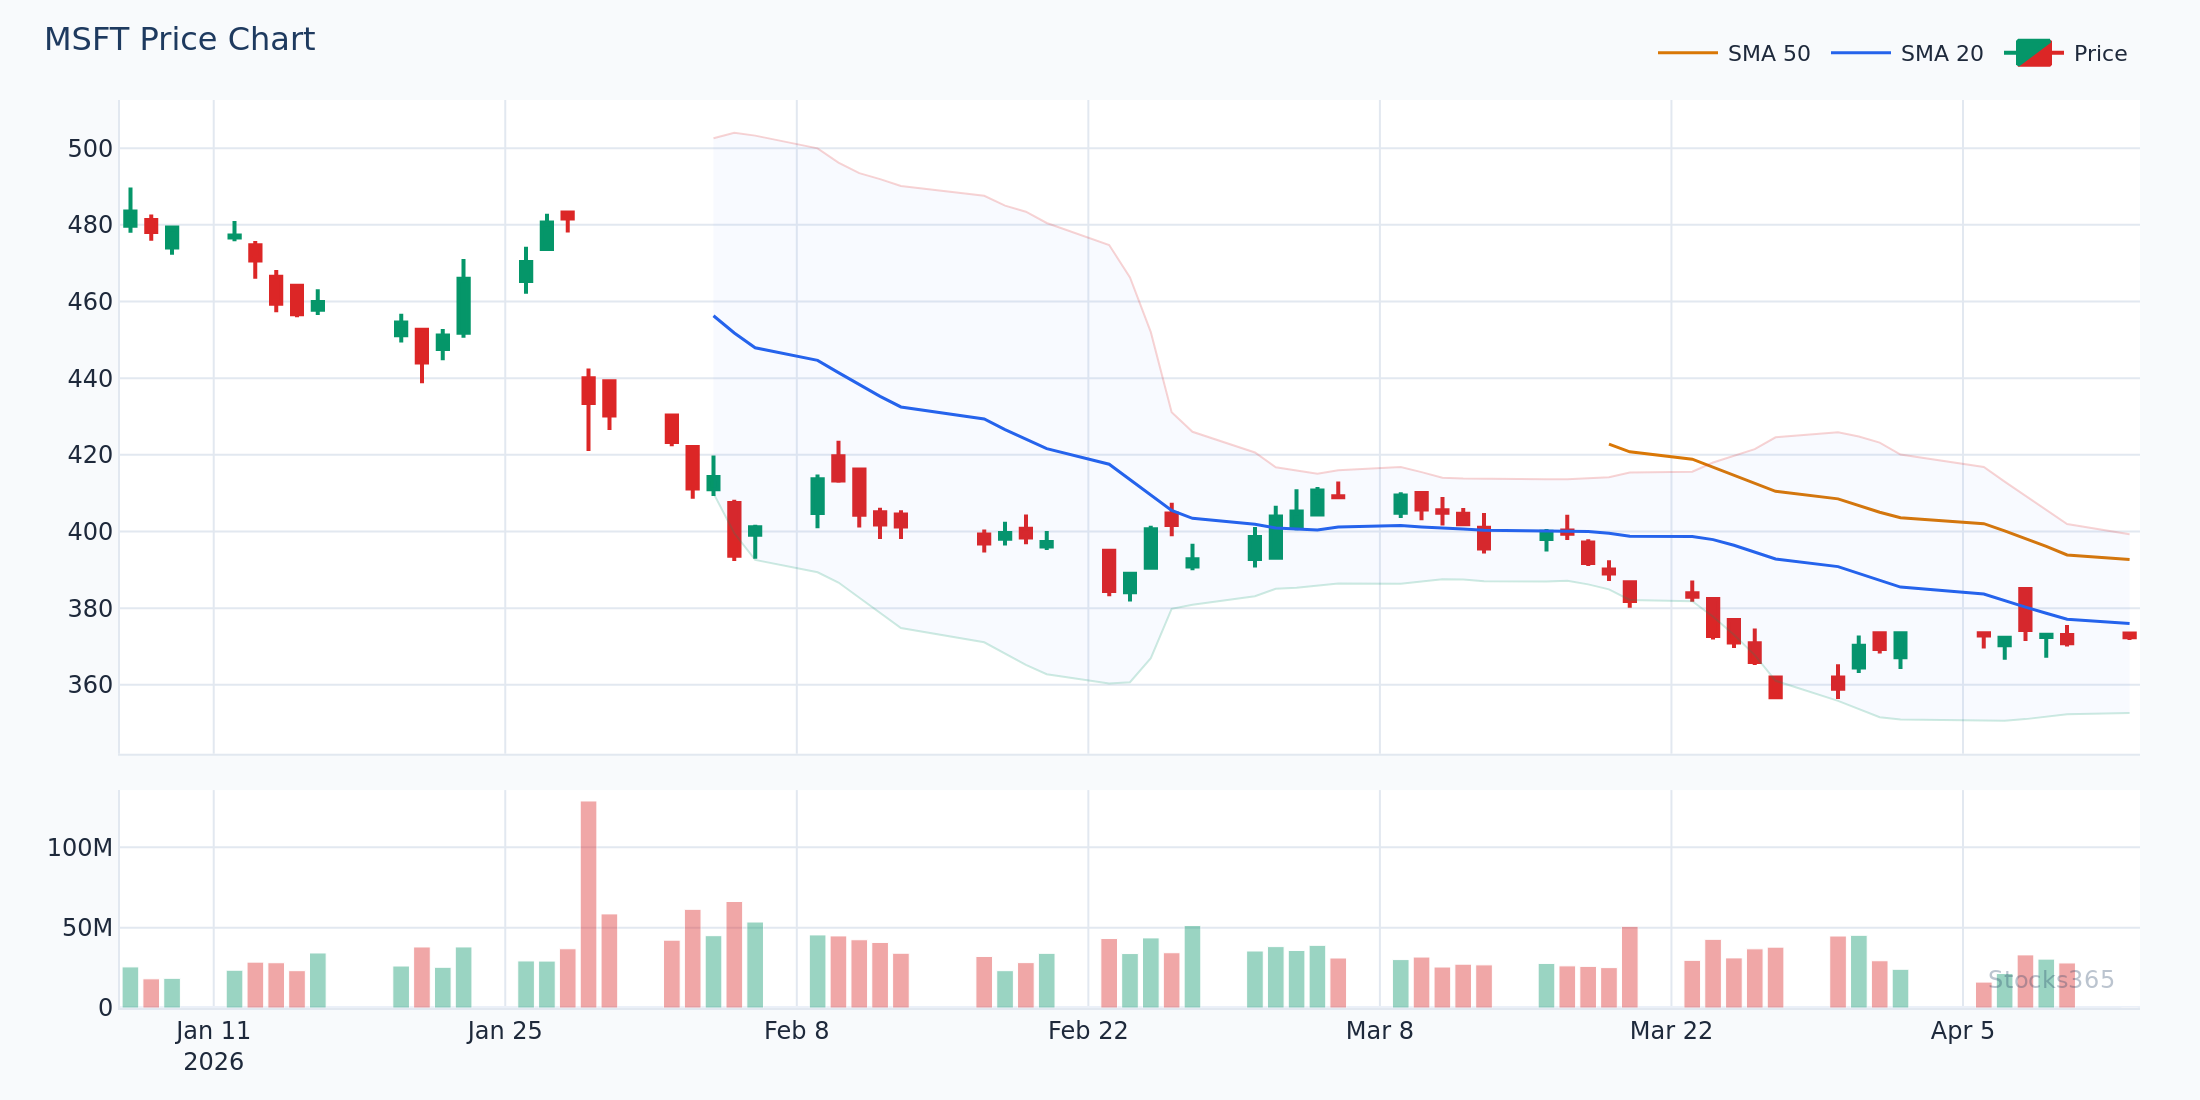
This MSFT chart illustrates the upper band touch plus RSI divergence setup in action. The prior peak shows RSI confirming the move; the current peak shows RSI lagging. This divergence while price is extended beyond two standard deviations creates a high-quality short-term mean-reversion opportunity. Invalidation occurs if price closes above the upper band with RSI also making a new high.
Bollinger Bands vs RSI Across Different Asset Classes
Asset class context changes everything. The data confirms this clearly.
Crypto: Both indicators show elevated win rates in crypto versus other asset classes. Crypto's volatility profile creates more extreme band touches and deeper RSI oversold readings — both of which tend to snap back more aggressively. For crypto traders, RSI divergence after a 20%+ drawdown has historically been one of the most reliable bounce signals available.
Equities: Individual stocks respond well to RSI momentum signals, especially in trending conditions. Bollinger squeeze setups work particularly well on high-beta growth names where volatility compression precedes earnings or catalyst events.
Commodities: Both indicators underperform in commodities — the data shows this clearly, with win rates below 43% for standalone signals. Commodity markets are driven more by macro and supply-demand fundamentals than by technical momentum. Use both indicators more conservatively here, requiring stronger confluence before acting.
If you're comparing RSI against other oscillators beyond Bollinger Bands, our guide on RSI vs the Stochastic Oscillator covers another important comparison that many traders find useful.
Common Mistakes When Using Bollinger Bands and RSI
- Using default settings on all timeframes: A 20-period Bollinger Band and 14-period RSI on a 1-minute chart behave very differently than on a daily chart. Calibrate your settings to your trading timeframe.
- Trading every band touch: In a strong trend, lower band touches are continuation opportunities — not reversals. Context of the trend always overrides band position.
- Ignoring divergence: This is where significant edge lives. RSI divergence, especially hidden bullish and bearish divergence, is frequently the earliest warning of a trend shift.
- Treating overbought/oversold as binary: RSI above 70 in a strong uptrend is bullish, not bearish. Context determines the interpretation — always.
- Ignoring volume: Both indicators work better when volume confirms the signal. A band breakout on light volume is suspicious. An RSI recovery on surging volume is reliable.
What to Watch For
- Bollinger squeeze breakouts on high-beta tech stocks: When band width drops below the 20th percentile of its recent range, prepare for a volatility expansion of two to three ATRs. The RSI direction at breakout (above or below 50) tells you which way to lean.
- RSI divergence on crypto after a 20%+ drawdown: When price makes a lower low but RSI makes a higher low, the selling momentum is fading. This setup has historically preceded sharp bounces — but always wait for price to stabilize before entering.
- Lower band touch plus RSI below 30 in equity uptrends: In a confirmed uptrend, this dual oversold signal often marks the end of a normal pullback. The entry is RSI recovering back above 30 with price closing inside the lower band.
- Upper band touch plus RSI bearish divergence in overbought markets: When broader market conditions are stretched and individual names show this confluence, the reversal trades tend to have both technical and macro wind at their back.
- Failed band breakouts on low volume: When price briefly breaches the upper or lower band but closes back inside on below-average volume, the move is likely exhausted. RSI confirming the fade (turning back from overbought/oversold) strengthens the case for a reversal entry.
How to Start Applying This in Your Trading
The path forward is simple. Pick one setup. Master it before adding complexity.
Start with the lower band touch plus RSI oversold recovery. It's the most visually clear, the easiest to define entry and exit criteria for, and it works across multiple asset classes. Once you can identify it consistently and execute it mechanically, layer in divergence analysis.
For a complete step-by-step framework for implementing RSI in your trading, including how to combine it with price structure and volume, see our comprehensive guide on how to use RSI in trading. And if you're new to RSI entirely, our beginner's guide to RSI covers the fundamentals before you advance.
You can also explore live signals combining Bollinger Bands, RSI, and the Stocks365 trust score on the Stocks365 signals dashboard, or check specific setups like the current AAPL signal to see how these indicators apply in real time.
Key Takeaways
- Bollinger Bands measure volatility and price position. RSI measures momentum. They are complementary, not competing.
- Neither indicator produces a reliable edge in isolation — standalone signals show win rates near or below 50%.
- Crypto responds best to both indicators; commodities respond worst. Asset class selection matters as much as indicator selection.
- The strongest setups combine both: band touches confirmed by RSI levels, breakouts confirmed by RSI momentum, divergence appearing at band extremes.
- In trending markets, RSI 70 is not a sell signal — watch for RSI to break back below 70 as the actual trigger.
- Bollinger squeeze breakouts are most reliable when RSI confirms the direction at the moment of expansion.
- Volume confirmation elevates the reliability of signals from both indicators significantly.
How Stocks365 Uses This
Stocks365 integrates both Bollinger Bands and RSI as components within its Trust Score system — a composite scoring engine built from 12+ technical indicators. RSI contributes to the momentum and regime scoring layers, flagging whether a given asset is in a trending or oscillating state and whether momentum is accelerating or fading. Bollinger Band width and price position feed into the volatility scoring layer, identifying whether a squeeze setup is present and how extended current price action is relative to recent norms.
When RSI divergence appears simultaneously with a band extreme, the Trust Score reflects the heightened confluence — elevating or reducing signal confidence based on the agreement between momentum and volatility signals. This multi-indicator agreement approach is precisely why single-indicator trading underperforms: the Trust Score weights consensus, not individual readings.
Explore how this plays out across live instruments on the Stocks365 dashboard.