
How Is MACD Calculated? A Complete Guide to the Formula and Math
The Moving Average Convergence Divergence indicator — better known as MACD — is one of the most widely used tools in technical analysis. Traders rely on it to spot trend direction, momentum shifts, and potential entry and exit points. But here's the thing: most traders use MACD without truly understanding the math powering it.
If you want to trade with genuine conviction, knowing how MACD is calculated gives you a decisive edge. You'll understand why it lags, how it reacts to price, and when its signals are most reliable. In this guide, we break down every component of the MACD formula — step by step, with real numbers — so you can apply it intelligently in any market condition.
Key Insight: MACD was developed by Gerald Appel in the late 1970s. Despite being nearly five decades old, it remains one of the most relevant and widely applied momentum indicators in modern trading, from equities and crypto to forex and futures.
What Is MACD? A Quick Overview Before the Math
MACD is a trend-following momentum indicator that shows the relationship between two exponential moving averages (EMAs) of an asset's price. Unlike a simple moving average, which weights all data points equally, the EMA gives more weight to recent price data — making it more responsive to current market conditions.
The MACD consists of three core components:
- MACD Line — The difference between the 12-period EMA and the 26-period EMA
- Signal Line — A 9-period EMA of the MACD Line
- Histogram — The visual representation of the distance between the MACD Line and the Signal Line
Each of these components is derived from a chain of calculations. To truly understand how MACD is calculated, you need to start at the foundation: the Exponential Moving Average.

Step 1 — How to Calculate the Exponential Moving Average (EMA)
The EMA is the building block of the entire MACD calculation. Before you can compute any part of the MACD, you need to understand how the EMA works.
The EMA Formula
The formula for calculating an EMA is:
EMA = (Current Price × Multiplier) + (Previous EMA × (1 − Multiplier))
Where the Multiplier (also called the smoothing factor) is:
Multiplier = 2 ÷ (N + 1)
Here, N is the number of periods in your EMA. Let's break down the two EMAs used in the standard MACD calculation.
Calculating the 12-Period EMA
For a 12-period EMA, the multiplier is:
Multiplier = 2 ÷ (12 + 1) = 2 ÷ 13 ≈ 0.1538
This means the current price receives approximately 15.38% weight in the EMA calculation, while the previous EMA value carries the remaining 84.62%.
Calculating the 26-Period EMA
For a 26-period EMA, the multiplier is:
Multiplier = 2 ÷ (26 + 1) = 2 ÷ 27 ≈ 0.0741
The 26-period EMA is slower — it reacts more gradually to price changes because each new data point only contributes about 7.41% to the calculation.
A Practical EMA Calculation Example
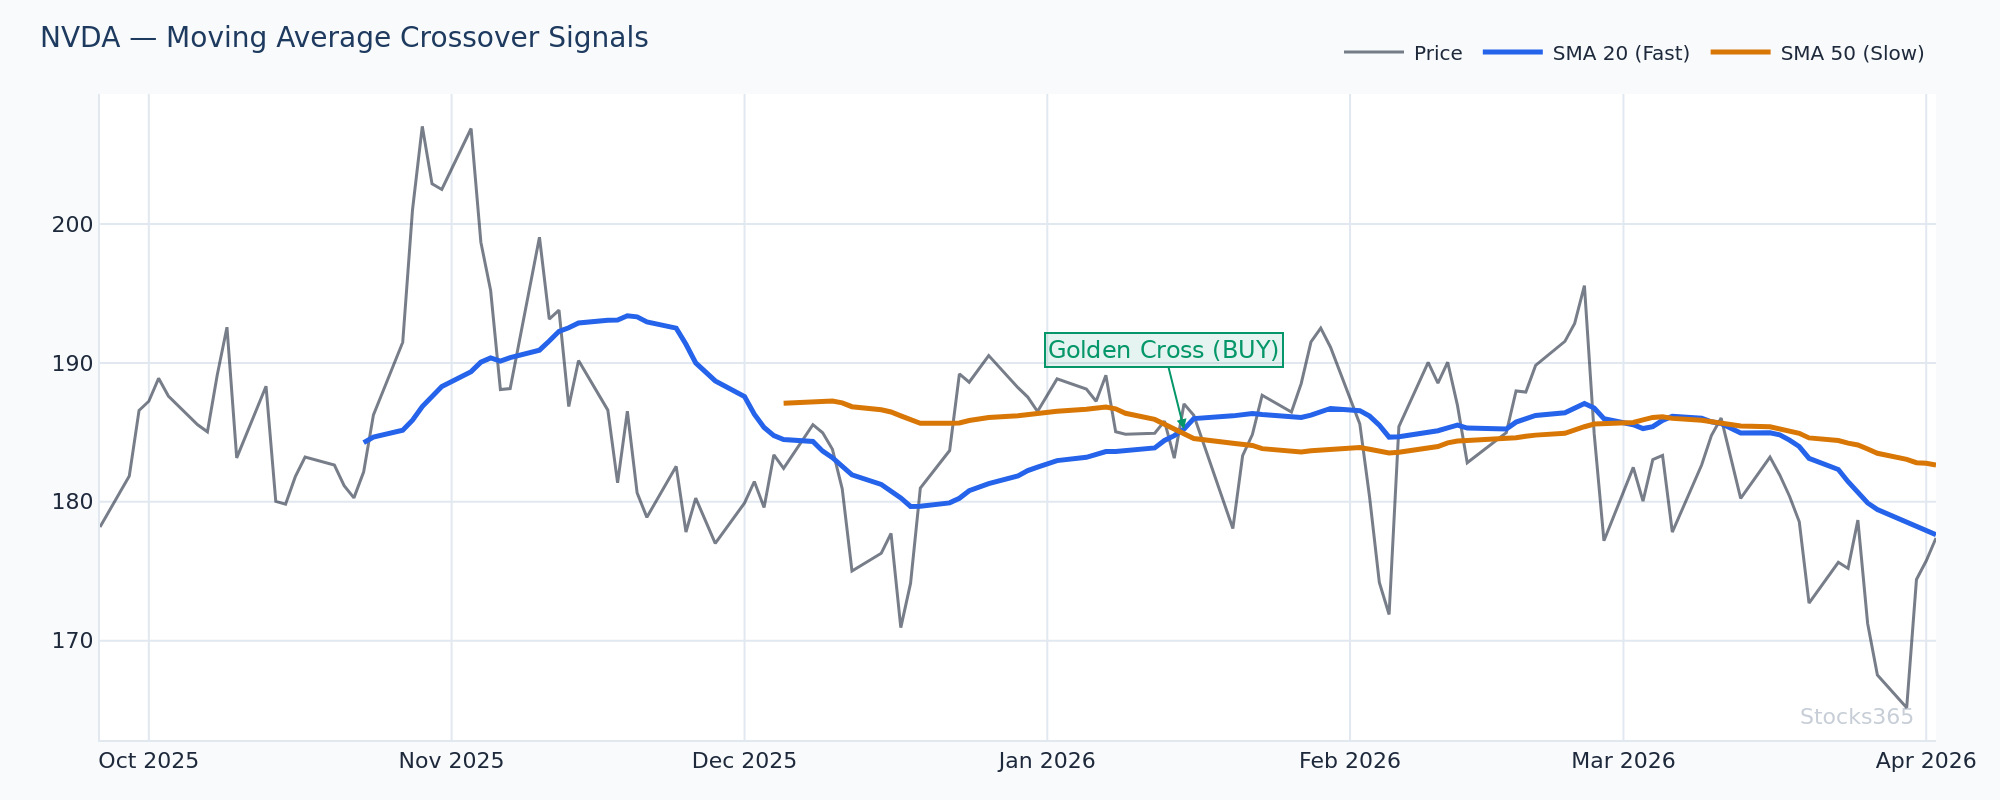
Let's use a simplified example. Suppose NVDA's closing prices over a series of days are as follows, and we've already established a prior 12-period EMA of $850.00:
- Today's closing price: $862.00
- Previous 12-period EMA: $850.00
- Multiplier: 0.1538
12-EMA = ($862.00 × 0.1538) + ($850.00 × 0.8462)
12-EMA = $132.57 + $719.27 = $851.84
Even though price jumped by $12, the 12-period EMA only moved up by $1.84. This smoothing effect is what makes the EMA — and by extension, the MACD — a useful noise filter rather than a reactive signal generator.
Step 2 — How to Calculate the MACD Line
Once you have both EMAs, calculating the MACD Line is straightforward:
MACD Line = 12-Period EMA − 26-Period EMA
When the 12-period EMA is above the 26-period EMA, the MACD Line is positive — indicating bullish momentum. When the 12-period EMA falls below the 26-period EMA, the MACD Line is negative — indicating bearish momentum.
Real Example: MACD Line Calculation
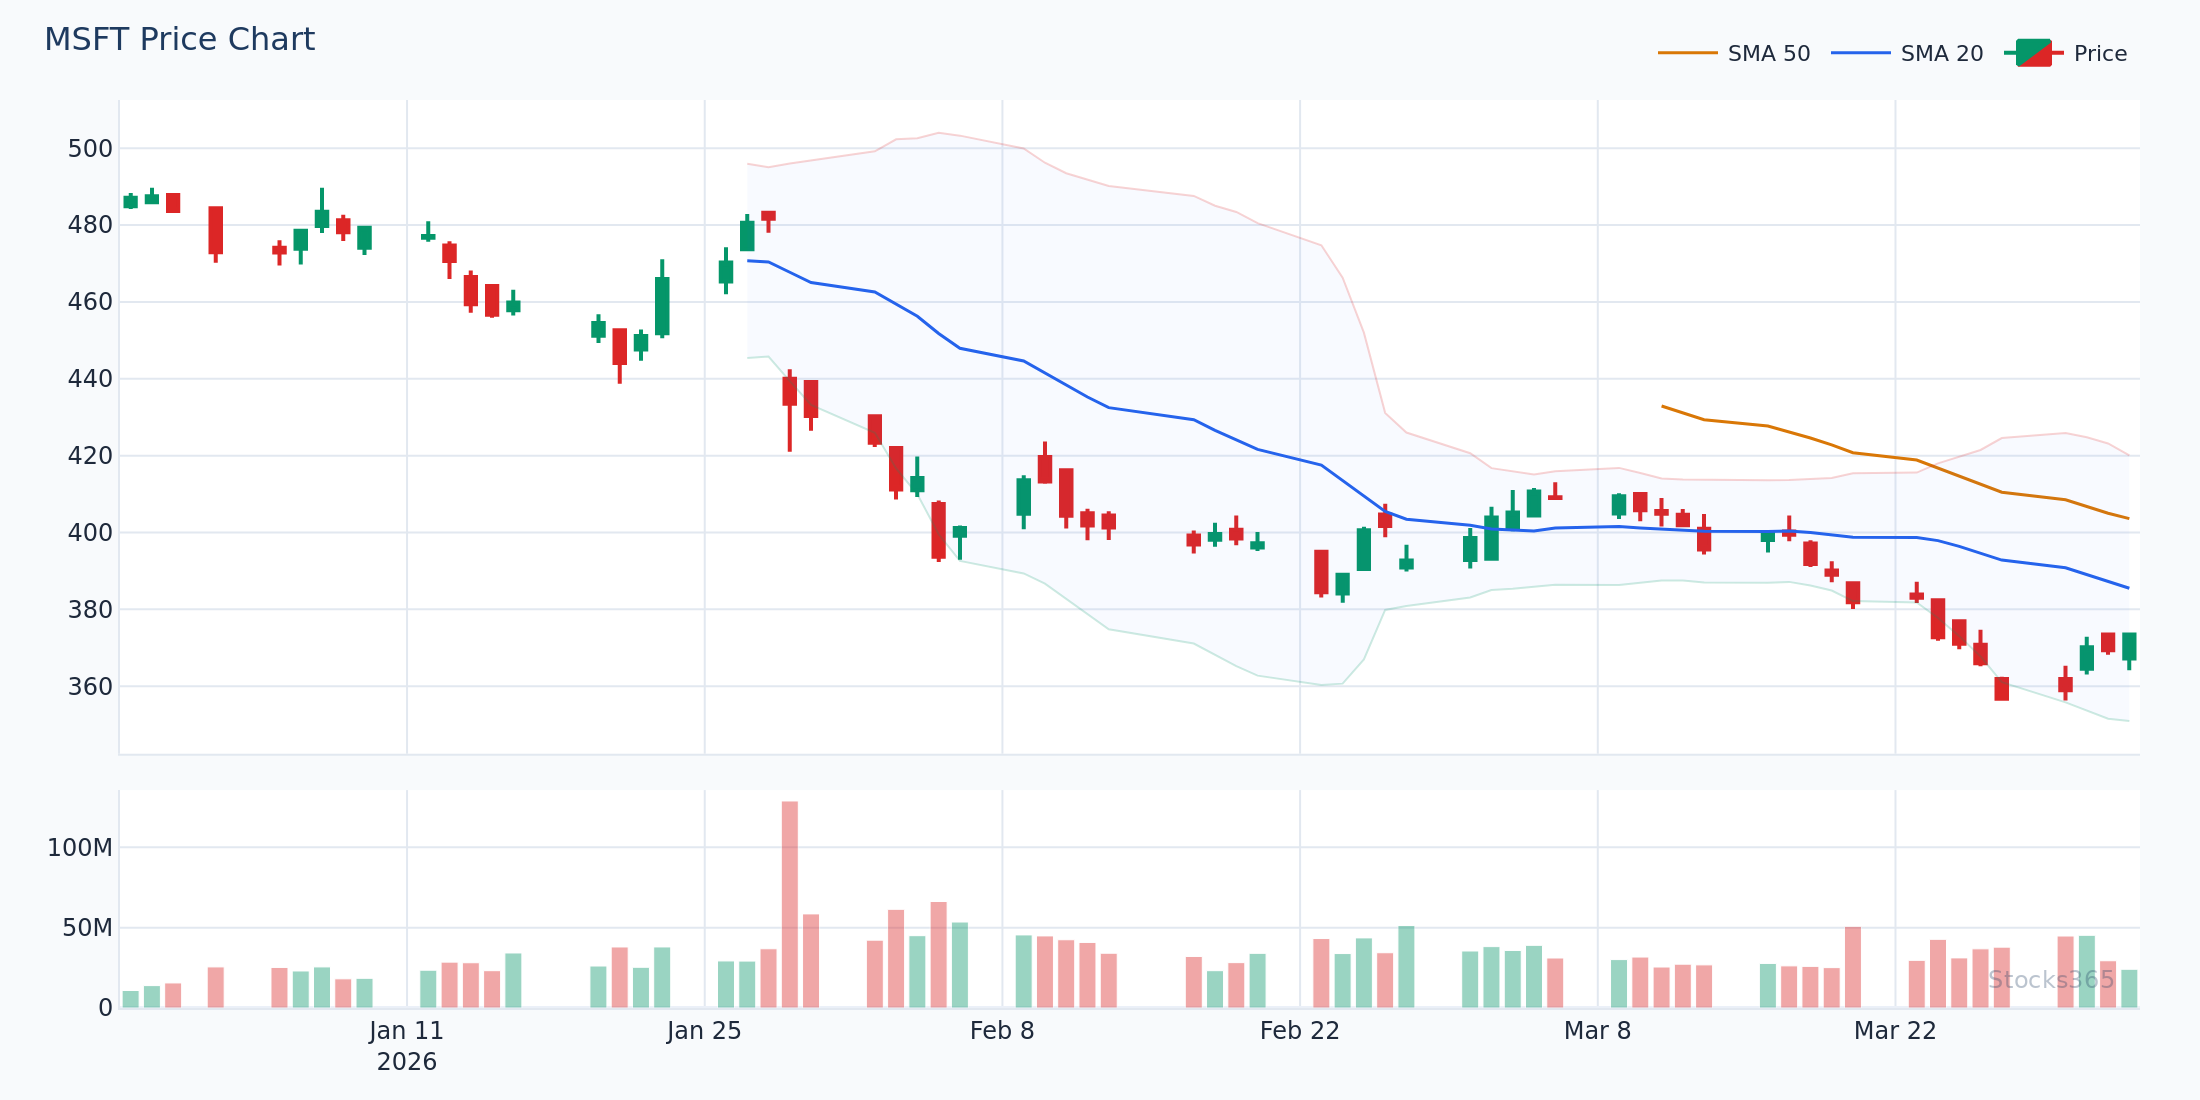
Let's say we're analyzing MSFT and at the close of a particular session:
- 12-period EMA: $415.60
- 26-period EMA: $408.90
MACD Line = $415.60 − $408.90 = +$6.70
A positive MACD Line of +$6.70 tells us that the short-term average is tracking above the long-term average — a sign of upward momentum in MSFT's price action.
Conversely, if the 12-period EMA dropped to $402.50 while the 26-period EMA held at $408.90:
MACD Line = $402.50 − $408.90 = −$6.40
This negative reading signals that downward momentum is in control.
Step 3 — How to Calculate the Signal Line
The Signal Line is a 9-period EMA applied to the MACD Line itself. This additional smoothing creates a lagged version of the MACD Line, which is used to generate crossover signals.
Signal Line = 9-Period EMA of MACD Line
The multiplier for the 9-period EMA is:
Multiplier = 2 ÷ (9 + 1) = 2 ÷ 10 = 0.20
So each new MACD Line value contributes 20% to the Signal Line's value, with the previous Signal Line value contributing 80%.
Signal Line Calculation Example
Continuing with the MSFT example:
- Today's MACD Line: +$6.70
- Previous Signal Line (9-period EMA of MACD): +$5.20
- Multiplier: 0.20
Signal Line = ($6.70 × 0.20) + ($5.20 × 0.80)
Signal Line = $1.34 + $4.16 = $5.50
The Signal Line moved from $5.20 to $5.50, lagging slightly behind the MACD Line's value of $6.70. This gap is what the histogram measures.
Step 4 — How to Calculate the MACD Histogram
The MACD Histogram is perhaps the most visually intuitive part of the indicator. It measures the distance between the MACD Line and the Signal Line:
Histogram = MACD Line − Signal Line
Using our MSFT values:
Histogram = $6.70 − $5.50 = +$1.20
When the histogram is positive, the MACD Line is above the Signal Line — bullish momentum is accelerating. When it's negative, the MACD Line is below the Signal Line — bearish momentum is dominant. When the histogram crosses the zero line, that's often when traders watch for crossover signals.
Pro Tip: Pay close attention to the slope of the histogram, not just its value. A shrinking positive histogram — even before it turns negative — can be an early warning that bullish momentum is fading. The Stocks365 signals dashboard highlights these momentum shifts in real time so you don't have to manually track every bar.
The Full MACD Calculation — Summary Formula
Here's the complete chain of calculations in one place:
- Step 1: Calculate the 12-period EMA of closing prices
- Step 2: Calculate the 26-period EMA of closing prices
- Step 3: MACD Line = 12-EMA − 26-EMA
- Step 4: Signal Line = 9-period EMA of MACD Line
- Step 5: Histogram = MACD Line − Signal Line
The standard MACD settings — (12, 26, 9) — are the default on nearly every charting platform and remain the most commonly used configuration. However, traders do adjust these parameters for different timeframes and strategies, which we'll address in the FAQ section.
Why the MACD Lags — and Why That's Actually Useful
One of the most common criticisms of MACD is that it's a lagging indicator. Because it's based on historical price averages, it will never predict price movements — it reacts to them. But understanding why it lags helps you use it more intelligently.
The 26-period EMA is inherently slow. With a multiplier of only 0.0741, it takes a sustained price move over multiple sessions before the longer EMA significantly shifts. The MACD Line, being the difference between the fast and slow EMAs, therefore doesn't react until a momentum shift has already begun. The Signal Line adds yet another layer of smoothing.
This is actually by design. The lag filters out random noise and short-term price spikes, giving traders more confident signals on higher-probability moves. Traders who use MACD alongside momentum tools — like the RSI indicator — often get a more complete picture of market conditions. Understanding what RSI is and how it complements MACD can significantly improve your signal quality.
MACD vs Signal Line Crossovers — Reading the Math in Action
The most widely followed MACD signal is the crossover between the MACD Line and the Signal Line.
Bullish MACD Crossover
A bullish crossover occurs when the MACD Line crosses above the Signal Line. Mathematically, this means the histogram shifts from negative to positive — the 12-period EMA is pulling away from the 26-period EMA in the upward direction faster than the Signal Line can follow.
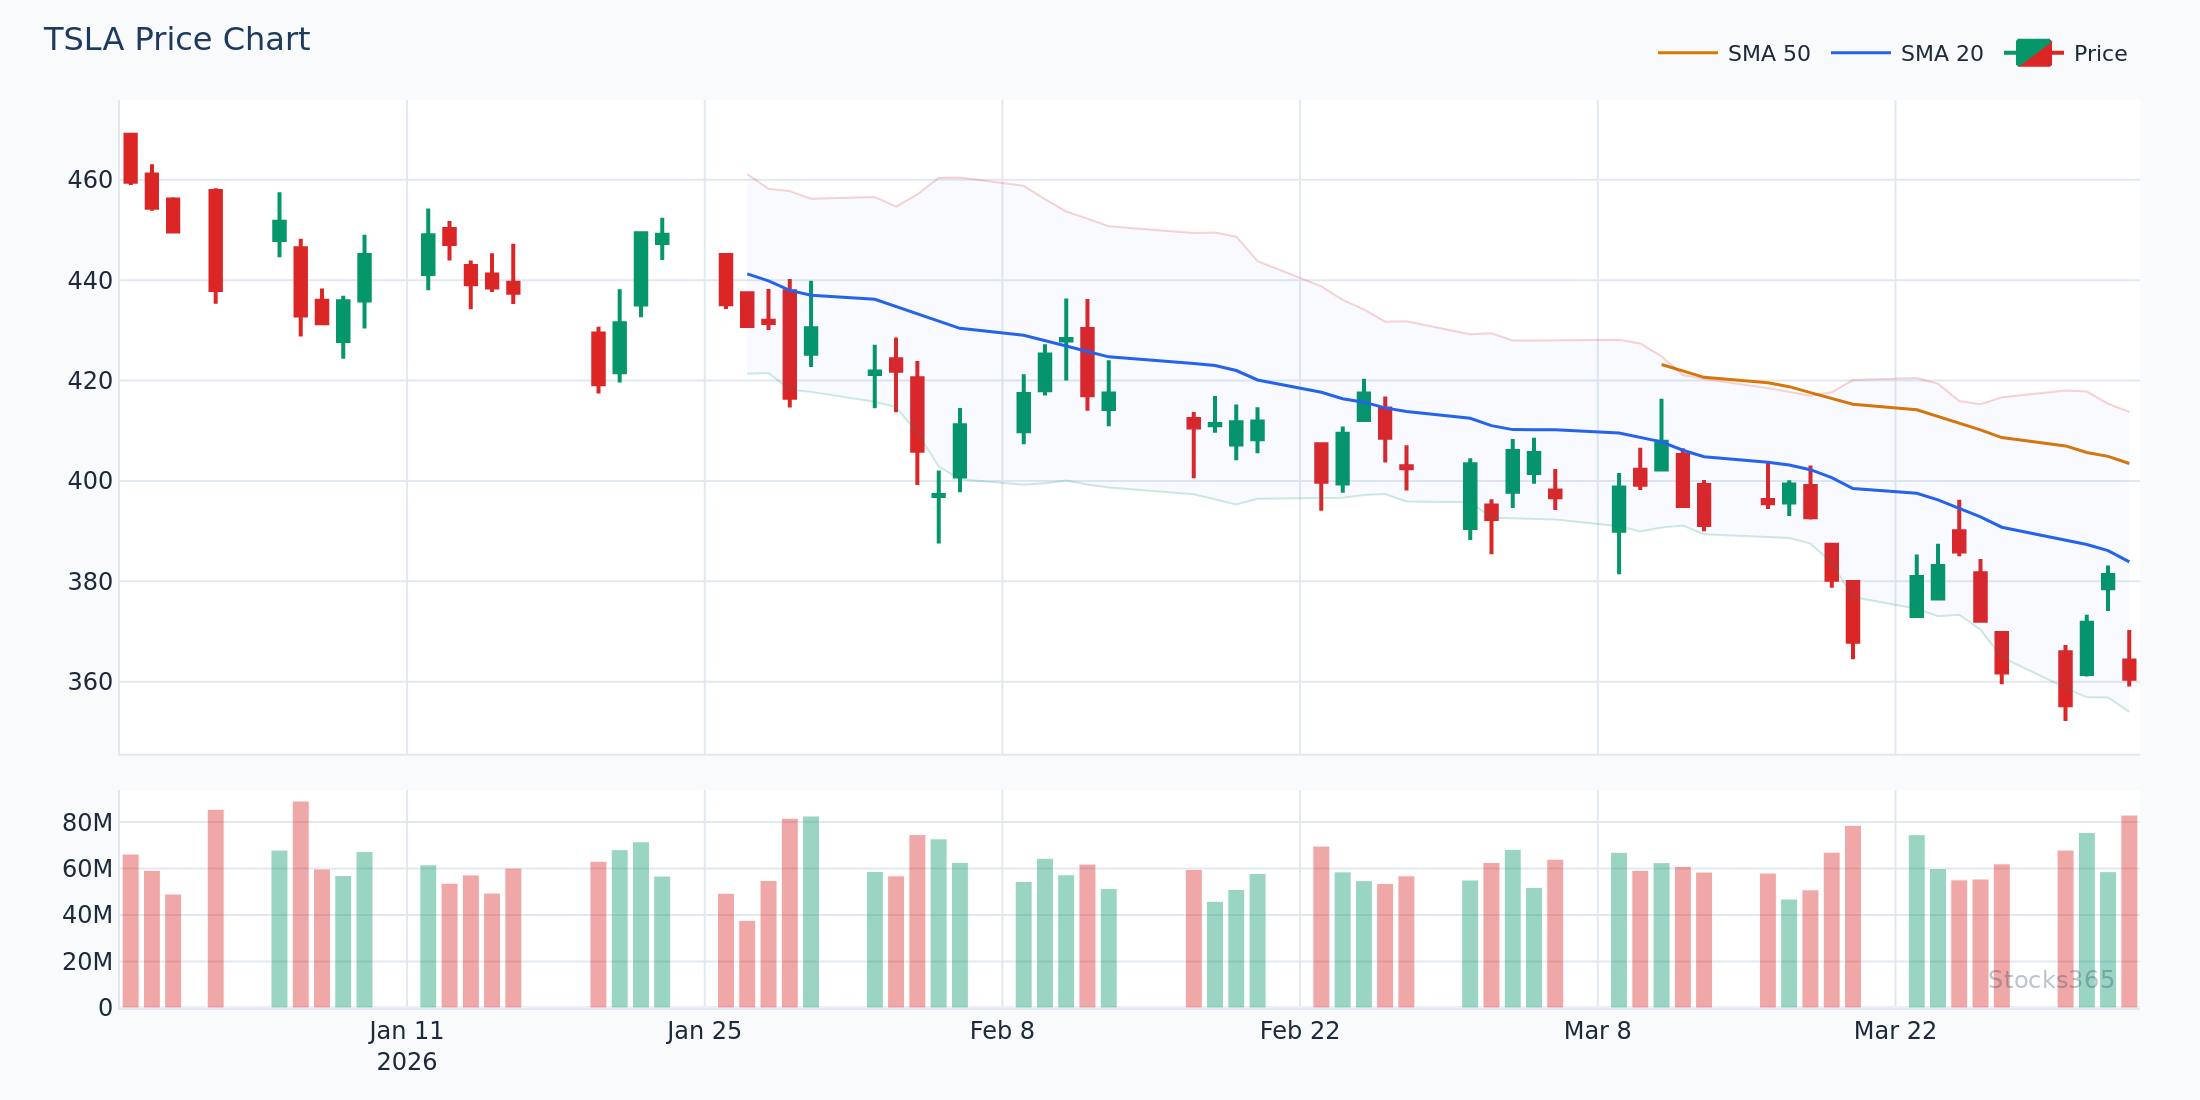
Example: Suppose TSLA's MACD Line moves from −$3.40 to +$1.20 over two sessions while the Signal Line remains at −$1.80. The histogram has just crossed from negative to positive — a classic bullish crossover signal, particularly meaningful if it occurs below the zero line.
Bearish MACD Crossover
A bearish crossover occurs when the MACD Line crosses below the Signal Line. The histogram turns negative, signaling that downward momentum is gaining strength over bullish momentum.
Zero Line Crossovers — Another Key MACD Signal
In addition to Signal Line crossovers, traders also watch for the MACD Line crossing the zero line.
- MACD crosses above zero: The 12-period EMA has moved above the 26-period EMA — confirming that a bullish trend is taking hold
- MACD crosses below zero: The 12-period EMA has dropped below the 26-period EMA — confirming a bearish trend is in place
Zero line crossovers are considered stronger confirmation signals than Signal Line crossovers because they represent a broader shift in the EMA relationship, not just a momentary divergence from the smoothed average. The Stocks365 signals dashboard flags both crossover types so traders can act on them across multiple assets simultaneously — for specific names, you can check individual signal pages like AAPL signals for live MACD status.
MACD and RSI — A Powerful Combination
While MACD excels at measuring momentum direction and magnitude, it tells you less about whether an asset is overbought or oversold at a given level. That's where combining MACD with RSI becomes extremely powerful.
RSI measures the speed and change of price movements on a bounded scale of 0 to 100. When both MACD and RSI send aligned signals — for example, a bullish MACD crossover while RSI is emerging from oversold territory — the probability of a successful trade setup increases meaningfully. You can learn the full mechanics of how to use RSI in trading and pair it directly with the MACD signals you're now computing yourself.
Similarly, RSI divergence — where price makes a new high or low but RSI fails to confirm — works in harmony with MACD divergence to provide high-conviction reversal signals. Advanced traders also watch for hidden RSI divergence, which signals trend continuation rather than reversal, and can be cross-referenced with MACD momentum readings for added confirmation.
Common MACD Calculation Mistakes to Avoid
Even experienced traders make errors when computing or interpreting MACD. Here are the most common pitfalls:
- Using Simple Moving Averages instead of EMAs: MACD specifically requires exponential moving averages. Using SMAs will give you different — and less accurate — results.
- Ignoring the seed value for EMA: The very first EMA in a series is typically seeded using a simple average of the first N closing prices. Using the wrong starting point cascades errors through every subsequent calculation.
- Treating all crossovers equally: A crossover that occurs far from the zero line carries different significance than one near it. Context matters enormously.
- Applying fixed settings to all timeframes: The standard (12, 26, 9) settings work well on daily charts, but may need adjustment for intraday or weekly timeframes. Check out guidance on optimizing indicator period settings for your specific strategy — the same logic applies to MACD parameter tuning.
- Using MACD in isolation: MACD is most powerful when combined with other indicators. For instance, comparing MACD to the RSI vs Stochastic Oscillator framework can help you understand which momentum tool fits best for your specific trading style.
Key Takeaways
📌 MACD Calculation — What You Need to Remember:
- MACD Line = 12-period EMA minus 26-period EMA
- Signal Line = 9-period EMA of the MACD Line (multiplier: 0.20)
- Histogram = MACD Line minus Signal Line
- The 12-EMA multiplier is ≈0.1538; the 26-EMA multiplier is ≈0.0741
- Positive MACD = bullish momentum; negative MACD = bearish momentum
- Crossovers above/below the Signal Line and zero line are the primary trading signals
- MACD lags by design — it's a momentum confirmation tool, not a prediction engine
- MACD is most powerful when combined with RSI and other confirmation indicators
- The Stocks365 signals dashboard applies these calculations automatically across hundreds of assets in real time
Frequently Asked Questions
What is the standard MACD formula?
The standard MACD formula uses three components: the MACD Line (12-period EMA minus 26-period EMA), the Signal Line (9-period EMA of the MACD Line), and the Histogram (MACD Line minus Signal Line). These default settings — often written as MACD(12,26,9) — are the most widely used across all trading platforms and asset classes.
Why does MACD use exponential moving averages instead of simple moving averages?
Exponential moving averages give more weight to recent price data, making them more responsive to current market conditions. Simple moving averages treat all data points equally, which means older price data influences the average just as much as today's close. For a momentum indicator like MACD, responsiveness to recent price action is critical — which is why EMAs are used exclusively in the calculation.
Can I change the MACD settings from the default (12, 26, 9)?
Yes, and many traders do. Short-term traders and scalpers often use faster settings like (5, 13, 5) to generate more frequent signals on intraday charts. Long-term position traders sometimes use slower settings like (19, 39, 9) to reduce noise on weekly charts. However, be aware that changing the settings alters how the EMAs interact and can produce significantly different signals. Always backtest any custom settings against historical data before applying them in live trading.
What does a MACD histogram shrinking toward zero mean?
A shrinking histogram means the gap between the MACD Line and the Signal Line is narrowing. If the histogram was positive and is now moving toward zero, it indicates that bullish momentum is decelerating — a potential early warning that a bearish crossover may be approaching. This divergence between histogram trend and price trend is one of the more subtle — and powerful — signals MACD produces. Many experienced traders consider a shrinking histogram a more actionable early warning than waiting for an actual crossover.
Is MACD better than RSI for identifying momentum?
MACD and RSI measure different aspects of momentum, so comparing them as direct alternatives oversimplifies the question. MACD excels at identifying the direction and relative strength of a trend by comparing two EMAs. RSI measures the speed of price changes on a normalized 0–100 scale and is particularly useful for identifying overbought and oversold conditions. Most professional traders use both together — MACD for trend direction and momentum magnitude, RSI for extremes and divergence signals. Understanding how both are calculated and what they measure makes you a significantly more informed and effective trader.