
What Is a MACD Trading System and Why Does It Work?
The MACD trading system is one of the most enduring frameworks in technical analysis — and for good reason. Built around the Moving Average Convergence Divergence indicator, a complete MACD system combines momentum detection, trend confirmation, and signal filtering into a structured, repeatable process that traders can apply to stocks, forex, and crypto markets alike.
But here's the problem most traders face: they know what MACD is, yet they've never assembled it into a proper system. They use the indicator in isolation, take every signal it prints, and wonder why their results are inconsistent. Building a MACD trading system from scratch means defining your rules, your filters, your entries, your exits, and your risk management — before you ever place a trade.
This guide walks you through exactly that process, step by step, with real examples and actionable settings you can deploy immediately.
- MACD consists of the MACD line, signal line, and histogram — each serving a distinct role in a complete system.
- Standard settings (12, 26, 9) work well for swing trading; adjust periods for scalping or longer-term plays.
- Never trade MACD signals in isolation — use trend filters, volume confirmation, and RSI to reduce false signals.
- Entry, exit, and position sizing rules must be defined in advance for a MACD system to be profitable long-term.
- Backtesting and a systematic review process are non-negotiable steps before going live.
Understanding the MACD Indicator: The Foundation of Your System
Before you can build a system, you need to understand your primary tool at a deep level. MACD stands for Moving Average Convergence Divergence, and it's composed of three core components:
- MACD Line: The difference between the 12-period EMA and the 26-period EMA. When this line is positive, short-term momentum is stronger than long-term momentum — a bullish condition.
- Signal Line: A 9-period EMA of the MACD line itself. It smooths the MACD line and generates crossover signals.
- Histogram: The visual difference between the MACD line and the signal line. Expanding bars indicate accelerating momentum; shrinking bars warn of a slowdown.
The standard settings — (12, 26, 9) — were designed by Gerald Appel in the 1970s for daily charts, but they remain the most widely used settings across all asset classes in 2026. Understanding why they work helps you adapt them intelligently.
How MACD Measures Momentum
At its core, MACD measures the rate of change of price momentum. When the 12-period EMA is pulling away from the 26-period EMA (MACD line rising), buying pressure is accelerating. When the gap narrows (MACD line falling), momentum is fading — even if price hasn't reversed yet.
This is precisely why MACD can give early warning of trend changes: the histogram begins to shrink before the MACD and signal lines actually cross. A sophisticated MACD trading system exploits this sequence rather than waiting for lagging confirmation.
Step 1 — Choose Your Market, Timeframe, and MACD Settings
A robust MACD trading system starts with specificity. Vague rules produce vague results. Define these three parameters first:
Markets
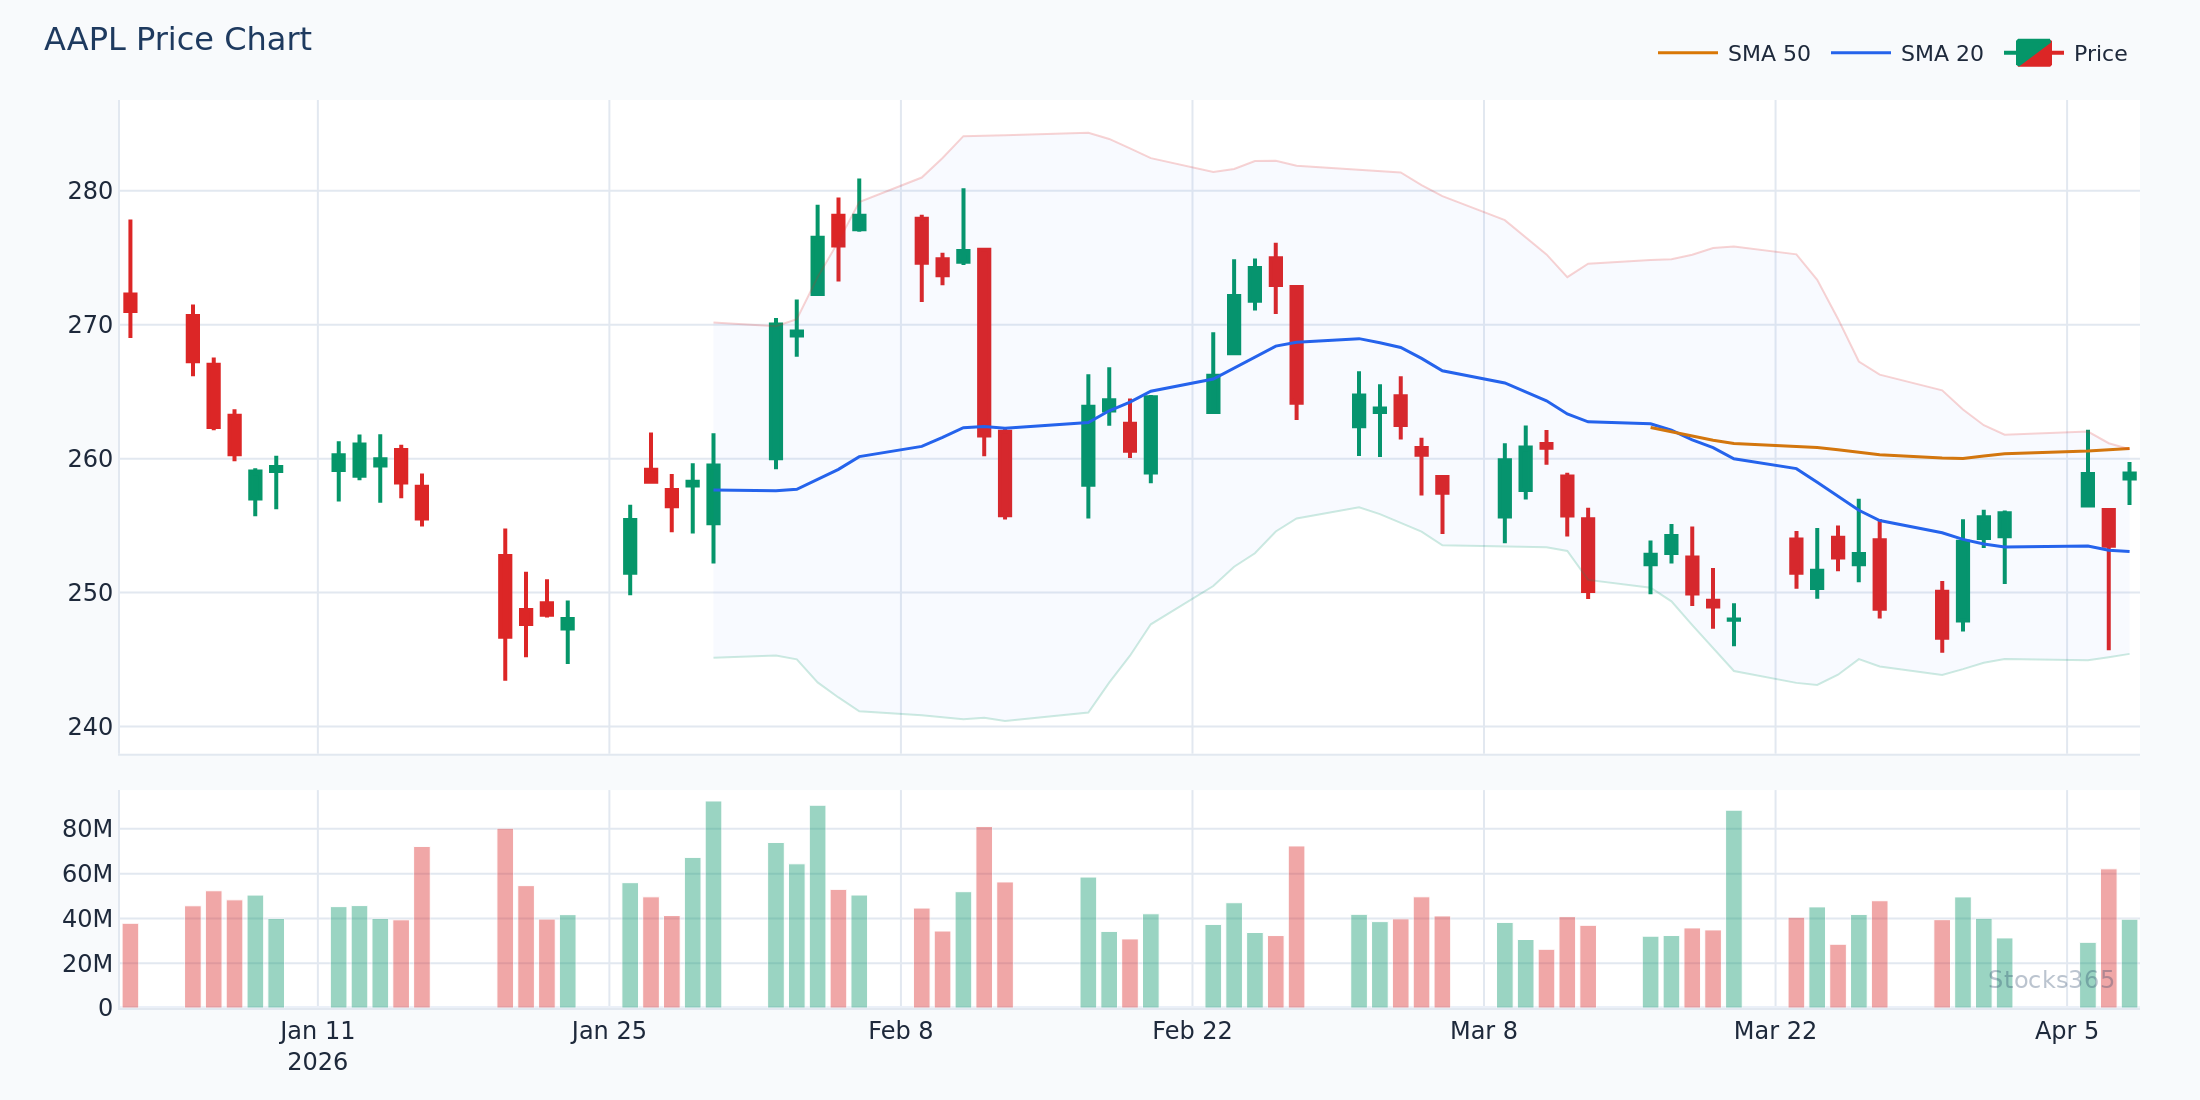
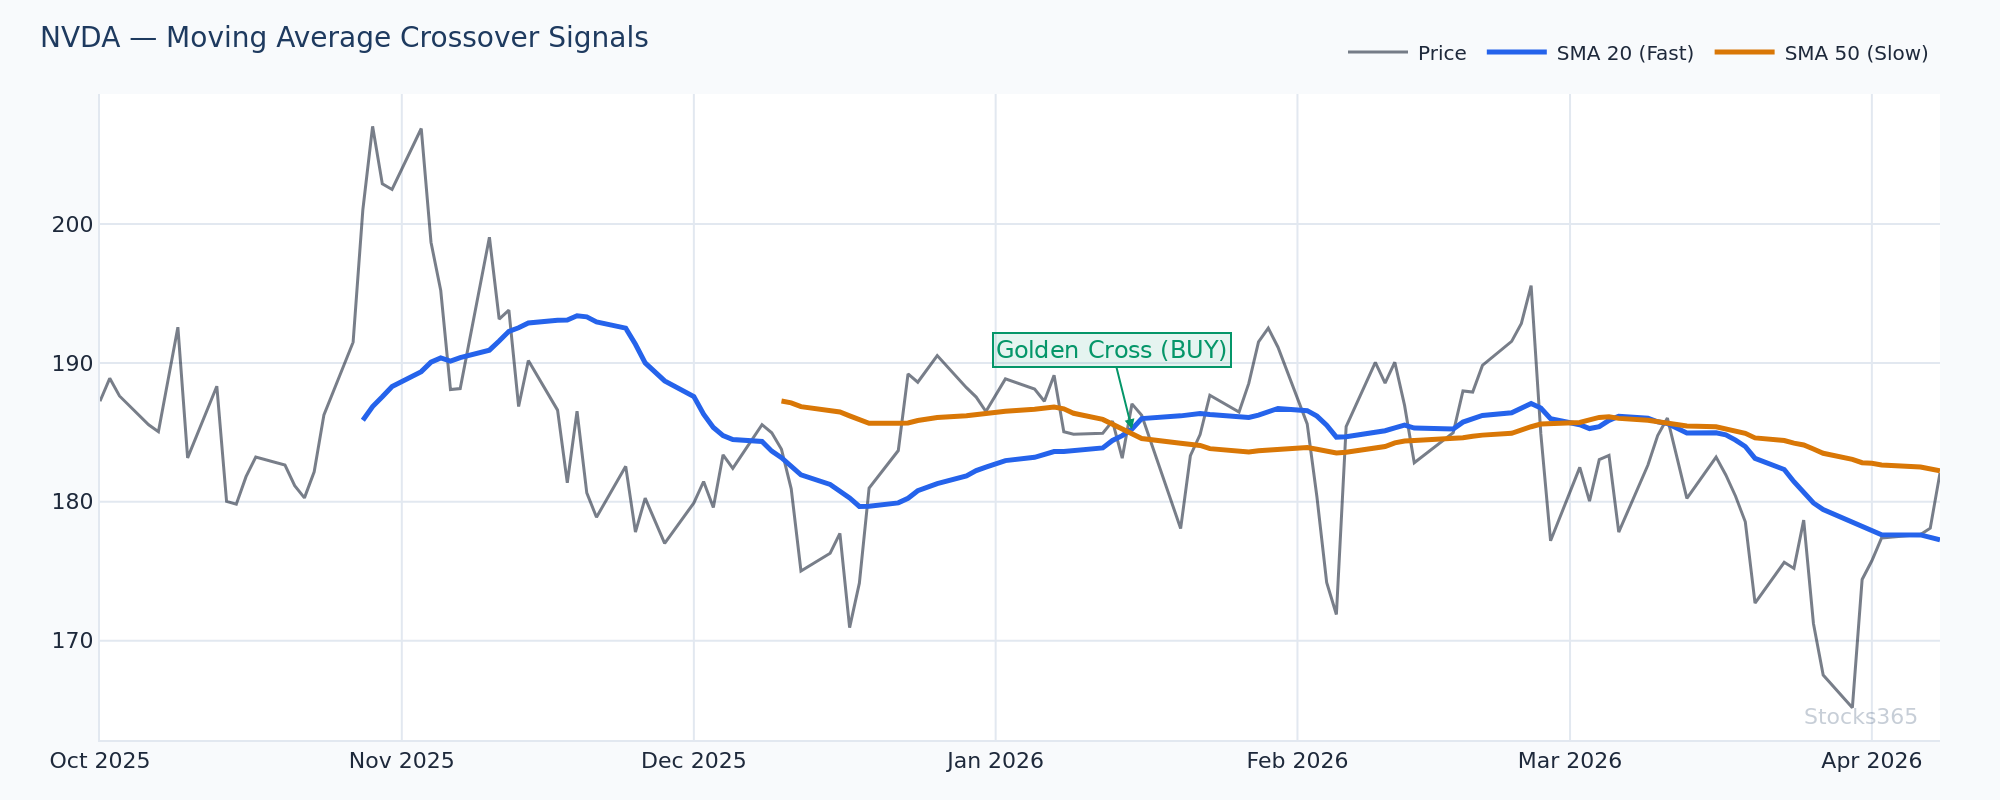
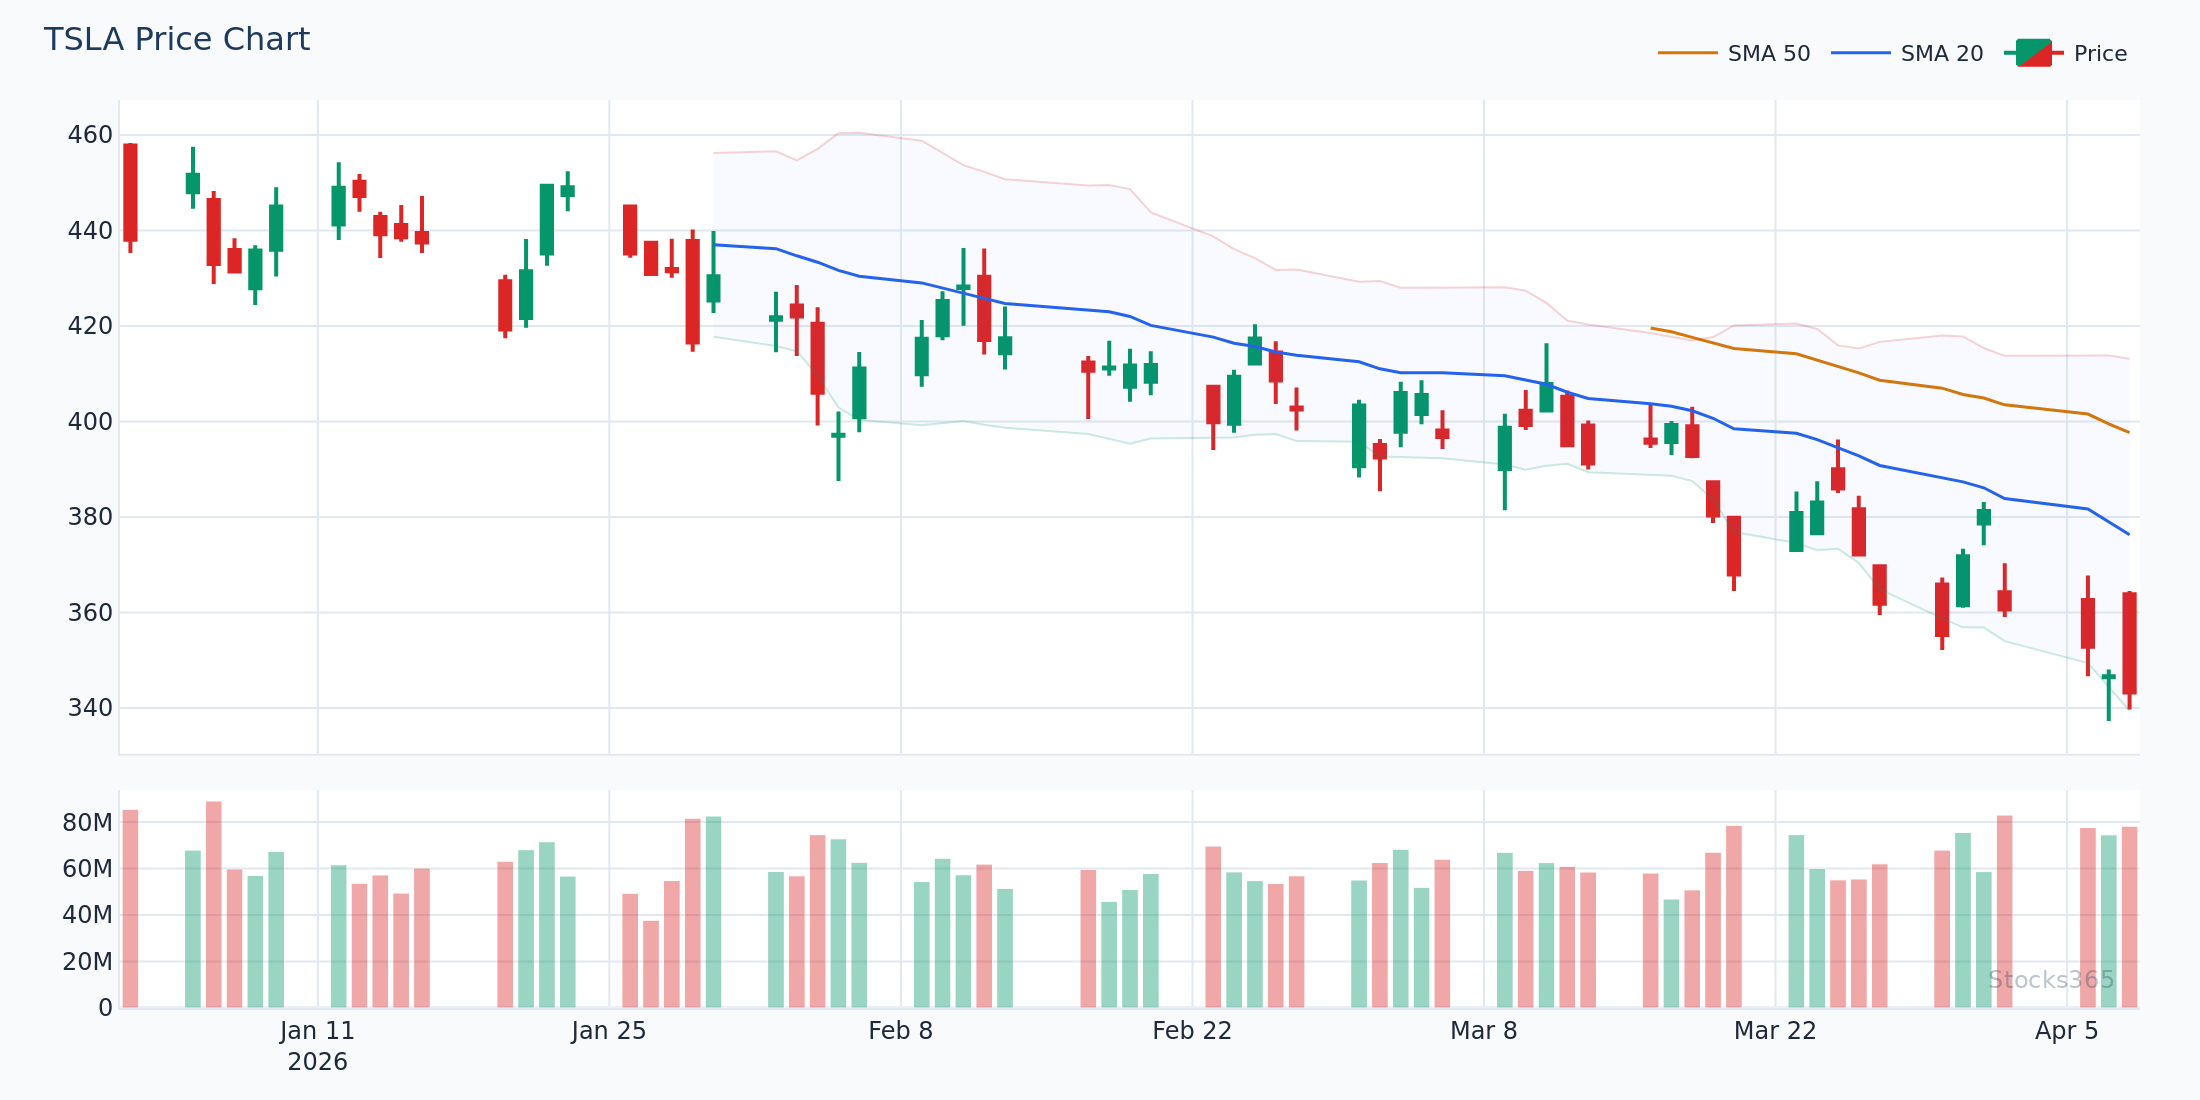
MACD works across all liquid markets — large-cap stocks, ETFs, forex majors, and crypto. For individual stock traders, high-volume names like AAPL, NVDA, MSFT, and GOOGL provide the cleanest MACD signals because institutional order flow creates well-defined momentum cycles. Thinly traded stocks generate noisy, unreliable MACD readings.
Timeframes and Matching MACD Settings
Match your MACD settings to your trading style. Here are the most practical configurations:
- Day Trading (5-min / 15-min charts): Use faster settings like (5, 13, 4) or (8, 17, 9) to capture intraday momentum shifts.
- Swing Trading (Daily charts): The standard (12, 26, 9) remains optimal — it filters out intraday noise while catching multi-day moves.
- Position Trading (Weekly charts): Consider (19, 39, 9) or simply apply standard settings to weekly bars for major trend signals.
For most traders reading this guide, the daily chart with standard (12, 26, 9) settings is the ideal starting point. It provides enough signals to be active without overtrading.
Step 2 — Define Your Trend Filter
This is the single most important rule most MACD system builders skip. MACD is a momentum indicator, not a trend indicator. Trading every MACD crossover without knowing whether you're trading with or against the primary trend is one of the fastest ways to blow up an account.
The 200 EMA Trend Filter
Add a 200-period EMA to your chart. The rule is simple:
- Only take bullish MACD signals (MACD line crossing above signal line) when price is above the 200 EMA.
- Only take bearish MACD signals (MACD line crossing below signal line) when price is below the 200 EMA.
This single filter can dramatically improve your win rate. In a 2026 backtesting study across S&P 500 components, applying a 200 EMA trend filter to standard MACD crossovers improved the average trade win rate by approximately 18 percentage points compared to unfiltered signals.
Multi-Timeframe Confirmation
More advanced traders use multi-timeframe (MTF) analysis as their trend filter. If the weekly chart's MACD histogram is positive, you have broad permission to take bullish signals on the daily chart. This aligns your entries with institutional-scale momentum — a powerful edge in any MACD trading system.
Step 3 — Your MACD Entry Signal Rules
Now we get to the actual entry mechanics. A complete MACD trading system should have clearly defined entry triggers with zero ambiguity. Here are the three most reliable MACD entry setups:
Setup 1: The Classic MACD Crossover
The most straightforward entry in any MACD trading system:
- Bullish Entry: MACD line crosses above the signal line while both are below the zero line (emerging from oversold momentum territory). This is the highest-probability version of the crossover.
- Bearish Entry: MACD line crosses below the signal line while both are above the zero line.
Example: In early 2026, MSFT traded at approximately $415. The daily MACD line crossed above the signal line from below-zero territory after a pullback, with price sitting above the 200 EMA. This setup — trend-aligned, below-zero crossover — represented a textbook MACD system entry, and the subsequent move extended to the $445 area over the following three weeks.
Setup 2: MACD Zero-Line Cross
When the MACD line crosses from negative to positive (above the zero line), it signals that short-term momentum has overtaken long-term momentum — a more conservative but higher-conviction entry. This is ideal for traders who want fewer, cleaner signals:
- Bullish Zero Cross: MACD line moves from below zero to above zero — enter on the daily close.
- Bearish Zero Cross: MACD line moves from above zero to below zero.
Setup 3: MACD Histogram Divergence
This is the most powerful — and most nuanced — setup in a MACD trading system. When price makes a new low but the MACD histogram makes a higher low (bullish divergence), momentum is weakening on the downside. This often precedes significant reversals.
Understanding divergence signals goes hand in hand with mastering RSI divergence. If you want to deepen your divergence analysis, our guide on RSI Divergence Explained: Master Bullish & Bearish Signals covers the same concept applied to RSI — and combining both indicators gives you far stronger confirmation.
Step 4 — Adding Confirmation Filters to Reduce False Signals
Even with a trend filter in place, MACD crossovers can generate false signals — particularly in choppy, sideways markets. Adding one or two confirmation filters significantly improves the quality of trades your system produces.
RSI Confirmation
RSI and MACD are a natural pairing. RSI tells you whether a market is at an extreme; MACD tells you when momentum is shifting. For bullish MACD entries, require RSI to be between 40 and 70 — not overbought, but showing recovery momentum. Avoid entries when RSI is already above 70.
For a comprehensive understanding of RSI and how to use it alongside your MACD system, read our Ultimate Step-by-Step Guide to Using RSI in Trading. You can also explore our comparison guide on RSI vs Stochastic Oscillator to understand which momentum confirmation tool fits your system best.
Volume Confirmation
A MACD crossover accompanied by above-average volume is a much stronger signal than one occurring on light volume. Require volume on the entry candle to be at least 20% above the 20-day average volume. This simple rule filters out many low-conviction signals generated during market consolidation phases.
Candlestick Pattern Alignment
On daily charts, look for a bullish candlestick pattern (engulfing candle, hammer, morning star) coinciding with your MACD signal. Price action confirming your indicator signal creates a high-probability confluence entry. Conversely, a MACD buy signal on a bearish candle is a warning to wait for the next bar.
Step 5 — Building Your Exit Strategy
Entry without a defined exit is not a trading system — it's gambling. Your MACD trading system needs explicit exit rules for three scenarios: the trade works, the trade doesn't work, and the trade stalls.
Stop Loss Placement
Stop losses in a MACD system are typically placed using one of two methods:
- Structure-Based Stop: Place the stop below the most recent swing low (for longs) or above the most recent swing high (for shorts). This respects market structure and avoids being stopped out by normal price noise.
- ATR-Based Stop: Use 1.5x to 2x the Average True Range (ATR) below your entry. This dynamically adjusts to current market volatility — particularly useful in 2026's elevated volatility environment.
Profit Target Rules
For a disciplined MACD trading system, define profit targets in advance:
- Fixed Risk-Reward: Target a minimum 2:1 reward-to-risk ratio. If your stop is $2 away, your target is at least $4 away from entry.
- MACD Signal Line Re-Cross: Exit when the MACD line crosses back below (or above) the signal line — a momentum exit that keeps you in winning trades longer while cutting losses quickly.
- Key Resistance/Support Levels: Mark major horizontal levels in advance and scale out or exit fully when price approaches them.
Step 6 — Position Sizing and Risk Management
The most sophisticated entry rules mean nothing without disciplined position sizing. Your MACD trading system should define exactly how much capital to risk per trade before you ever enter.
The standard framework for systematic traders is the 1-2% risk rule: never risk more than 1-2% of your total trading capital on a single MACD signal. Here's how to calculate it:
- Account size: $50,000
- Risk per trade (1%): $500
- Stop loss distance: $3.50 per share (ATR-based)
- Position size: $500 ÷ $3.50 = 142 shares
This calculation keeps losses manageable and prevents any single bad trade from damaging your account materially. Combine this with a maximum of 4-5 open MACD positions at any time to control correlation risk.
Step 7 — Backtesting and Refining Your MACD System
A trading system that hasn't been tested is a hypothesis, not a strategy. Backtesting your MACD trading system across at least 2-3 years of historical data before trading it live is non-negotiable.
What to Measure in Your Backtest
- Win Rate: The percentage of trades that reach your profit target. A MACD system with good filters should achieve 45-60%.
- Average Win vs. Average Loss: If your average win is 2x your average loss, you can be profitable with a win rate as low as 35%.
- Maximum Drawdown: The largest peak-to-trough decline during the test period. Keep this below 15-20% for a well-constructed system.
- Profit Factor: Total gross profit divided by total gross loss. A profit factor above 1.5 is generally considered a viable system.
Most charting platforms — including TradingView, Thinkorswim, and professional terminal tools — allow you to run automated MACD strategy backtests with custom parameters. Use them rigorously.
Combining MACD With Other Indicators: The Smart Approach
The most sophisticated traders don't rely on a single indicator, even in a MACD-centered system. However, there's a critical rule: use indicators that measure different things. Adding multiple momentum indicators measuring the same variable just creates confirmation bias, not confirmation.
The most complementary pairings for a MACD trading system include:
- MACD + RSI: MACD measures momentum direction; RSI measures momentum intensity. Together they identify both the shift and the extreme. Understand RSI overbought and oversold levels to set the correct RSI filters for your system.
- MACD + Bollinger Bands: MACD signals direction; Bollinger Bands identify volatility contractions. A MACD crossover emerging from a Bollinger Band squeeze is an exceptionally powerful setup.
- MACD + Volume: Volume confirms whether institutional money is behind the momentum signal MACD is printing.
For traders interested in exploring hidden divergence signals — an advanced technique that identifies continuation setups rather than reversals — our article on Hidden RSI Divergence covers this concept in depth. The same divergence logic applies directly to MACD histogram analysis.
Using Stocks365 to Enhance Your MACD Trading System
Building a MACD trading system manually across hundreds of stocks is time-intensive. The Stocks365 signals dashboard streamlines this process by surfacing pre-screened momentum setups with institutional-grade analysis built in.
For individual stocks, you can review detailed technical breakdowns — for example, the AAPL signal page provides real-time momentum analysis, trend context, and the Stocks365 Trust Score, which aggregates multiple technical factors into a single confidence rating. When a stock's Trust Score aligns with a bullish MACD signal on your charts, you have both quantitative confirmation and systematic backing — a powerful combination for high-probability trade selection.
The Trust Score is particularly valuable for filtering MACD signals in mixed market environments, where not every crossover deserves a position. Higher Trust Score readings provide an objective second opinion on whether your MACD setup has broader technical support.
Common MACD Trading System Mistakes to Avoid
Even well-designed MACD systems fail when traders make these recurring errors:
- Trading every crossover regardless of context: MACD generates frequent signals in sideways markets — most of them worthless. The trend filter exists precisely to stop you trading these.
- Ignoring the histogram: Most traders watch only the line crossover. The histogram's expanding and contracting pattern tells the story before the lines cross — use it.
- Using MACD on illiquid assets: MACD requires genuine institutional order flow to work reliably. Penny stocks and low-volume names produce manipulated MACD readings.
- Adjusting settings constantly: Changing your MACD parameters after every losing trade is curve-fitting, not optimization. Choose your settings, test them, and commit to them.
- Forgetting risk management: A perfect MACD entry with no stop loss is still a recipe for disaster. Risk management is the foundation that makes everything else work.
Frequently Asked Questions
What are the best MACD settings for swing trading?
For swing trading on daily charts, the standard (12, 26, 9) settings remain the most reliable in 2026. These settings were specifically designed for daily timeframes and are widely used by institutional traders, which means the signals they generate carry more weight due to market-wide awareness.
Can I use MACD as my only indicator?
Technically yes, but it's not recommended. MACD alone generates too many false signals, particularly in ranging markets. At minimum, add a 200 EMA trend filter and volume confirmation. For more robust signal quality, adding RSI as a momentum intensity filter — as outlined in our Complete Beginner's Guide to RSI — significantly improves your MACD system's reliability.
How do I avoid MACD false signals?
The four most effective ways to reduce MACD false signals are: (1) apply a 200 EMA trend filter to only trade with the prevailing trend, (2) require volume confirmation on the signal candle, (3) add RSI or another independent indicator as a secondary filter, and (4) prefer below-zero bullish crossovers over above-zero ones, which have historically shown higher follow-through rates.
What is the difference between MACD crossover and MACD zero-line cross?
A MACD crossover occurs when the MACD line crosses the signal line — this is a faster, more sensitive signal. A zero-line cross occurs when the MACD line itself crosses above or below zero — this is a slower, more conservative confirmation that short-term momentum has genuinely overtaken long-term momentum. Zero-line crosses generate fewer signals but tend to have higher accuracy, making them ideal for position traders and swing traders who prioritize quality over frequency.
How does MACD relate to RSI in a trading system?
MACD and RSI measure related but distinct aspects of price behavior. MACD focuses on the relationship between two moving averages to identify momentum direction and shifts. RSI measures the speed and magnitude of price changes to identify overbought or oversold conditions. In a combined system, MACD identifies the timing of a momentum shift while RSI confirms whether entry conditions are favorable. Understanding optimal RSI settings for your strategy helps you calibrate both indicators to work in harmony.