
How to Read Bollinger Bands: A Step-by-Step Guide
Bollinger Bands are one of the most versatile and widely used technical indicators in trading. Whether you're analyzing stocks, crypto, or forex, knowing how to read Bollinger Bands correctly can give you a powerful edge — helping you identify volatility shifts, potential breakouts, and high-probability entry points before the crowd catches on.
In this comprehensive step-by-step guide, you'll learn exactly what Bollinger Bands are, how they're constructed, and — most importantly — how to interpret every signal they generate in real market conditions.
- Bollinger Bands consist of a middle band (20-period SMA) flanked by an upper and lower band set 2 standard deviations apart.
- The Bollinger Band squeeze signals a pending breakout — one of the most reliable setups in technical analysis.
- Price touching the upper band is not automatically overbought; context and confirmation matter.
- Combining Bollinger Bands with momentum indicators like RSI significantly improves signal accuracy.
- The %B indicator and bandwidth are advanced tools that quantify band position and volatility precisely.
- Stocks365 Trust Scores can help you validate Bollinger Band signals before you act on them.
What Are Bollinger Bands? The Foundation You Need
Developed by legendary technical analyst John Bollinger in the early 1980s, Bollinger Bands are a statistical chart overlay that measures a market's volatility and relative price levels over a given period. Unlike fixed support and resistance lines, Bollinger Bands are dynamic — they expand and contract automatically as market conditions change.
The indicator is built on a simple but powerful concept: prices tend to stay within a predictable range based on recent volatility. When that range is violated, it often signals a significant move.
The Three Components of Bollinger Bands
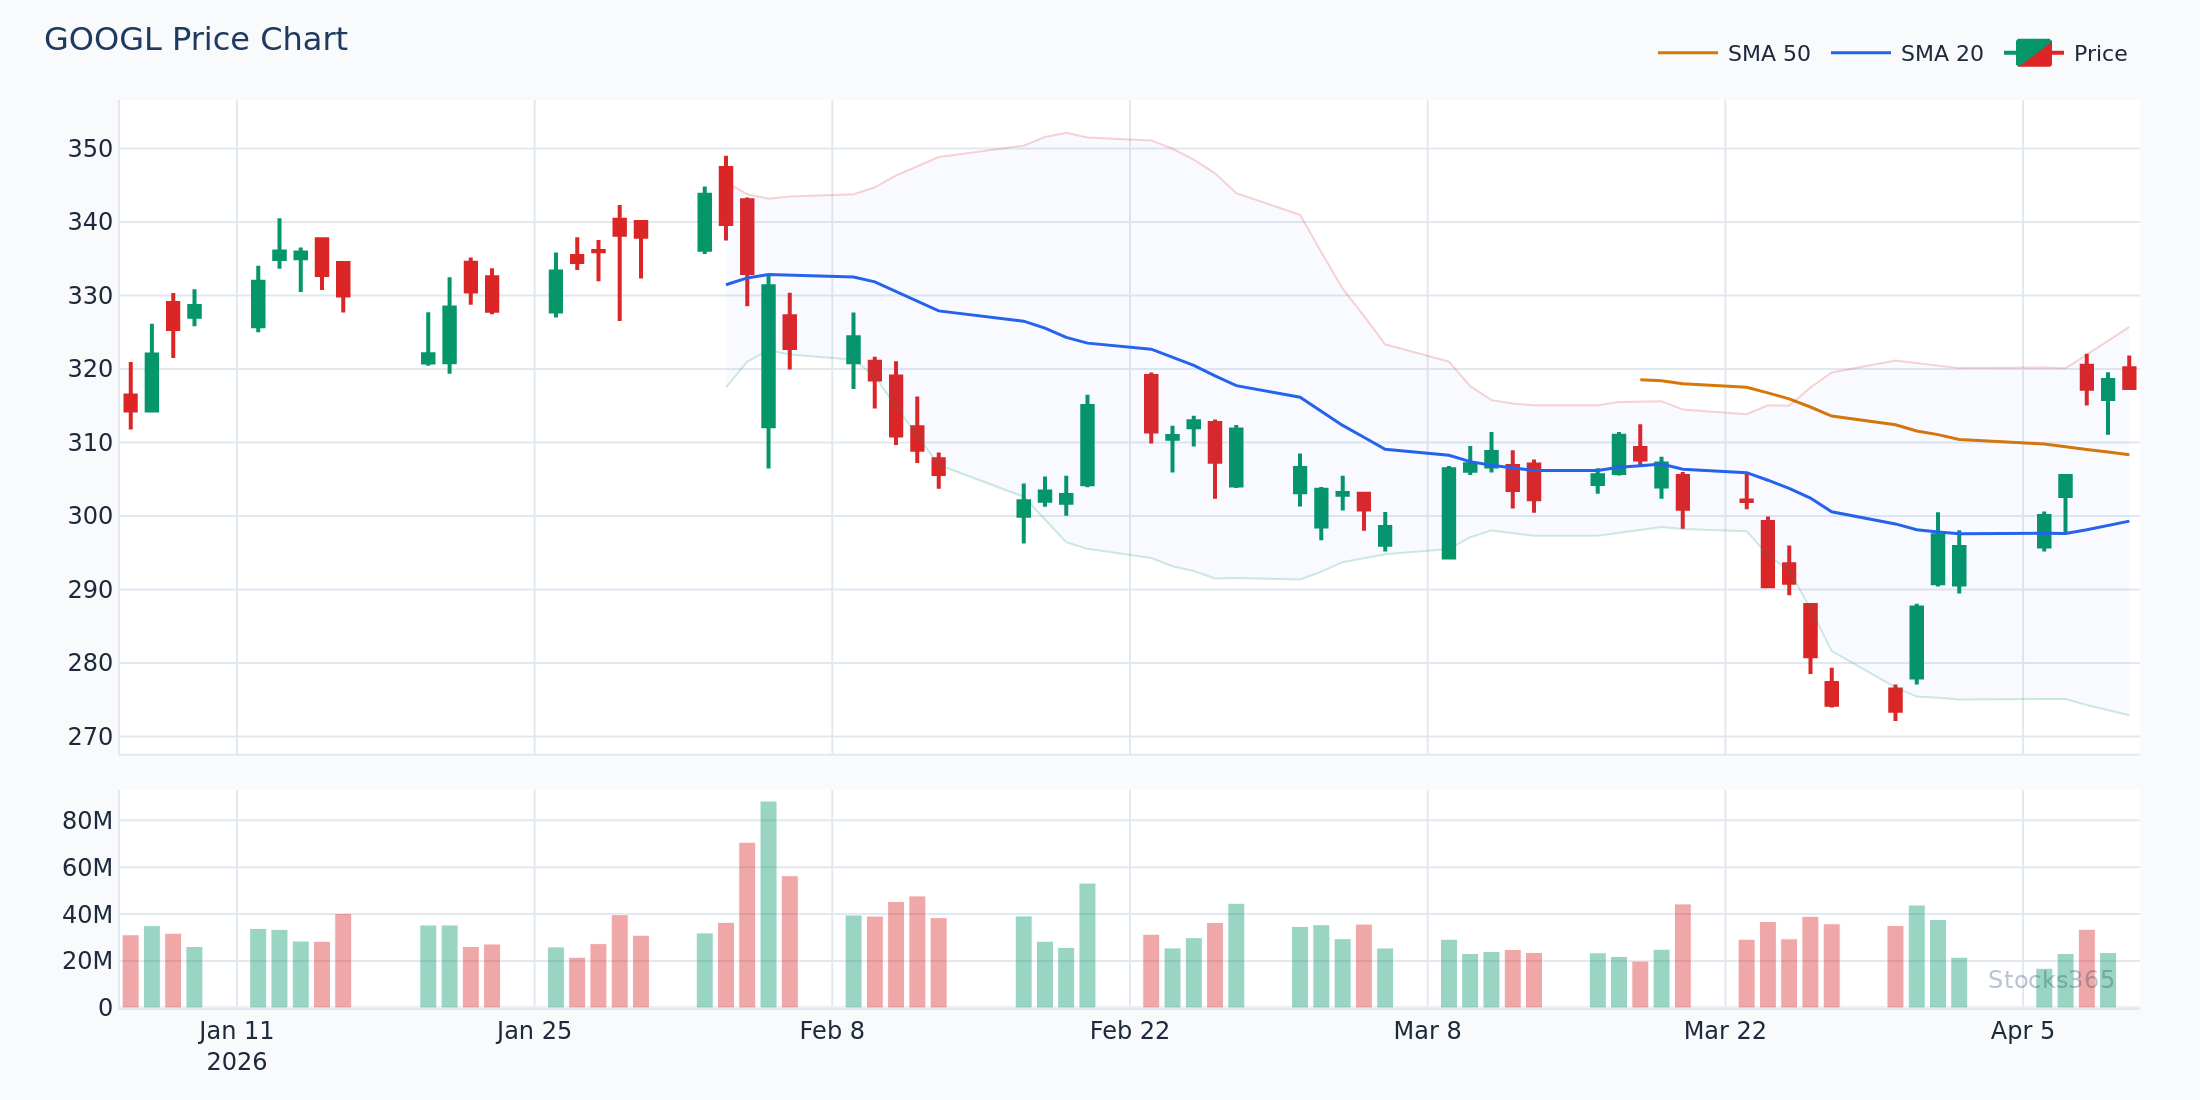
- Middle Band: A 20-period Simple Moving Average (SMA) of closing prices. This acts as the baseline trend indicator.
- Upper Band: The middle band plus 2 standard deviations of price. Represents statistically elevated price territory.
- Lower Band: The middle band minus 2 standard deviations. Represents statistically depressed price territory.
Statistically, roughly 95% of all price action falls within the two bands when using the standard 2 standard deviation setting. This makes breakouts outside the bands genuinely significant events — not noise.
How to Read Bollinger Bands: Step-by-Step
Step 1: Identify the Trend Using the Middle Band
Before analyzing the upper or lower bands, always start with the middle band. The 20-period SMA tells you the prevailing trend direction:
- Rising middle band: Uptrend in progress. Pullbacks to the middle band often represent buying opportunities.
- Falling middle band: Downtrend in progress. Bounces to the middle band are potential shorting opportunities.
- Flat middle band: Market is ranging or consolidating. Prepare for a volatility expansion.
For example, imagine NVDA is trading at $1,150 with a rising 20-period SMA at $1,090. The upward-sloping middle band confirms bullish momentum, making pullbacks toward $1,090 actionable long entries rather than warning signs.
Step 2: Assess Band Width to Gauge Volatility
The distance between the upper and lower bands tells you everything about current market volatility:
- Wide bands: High volatility. The market is making large, fast moves. Risk is elevated but so is opportunity.
- Narrow bands (squeeze): Low volatility. The market is coiling. A significant breakout is likely approaching.
This is where reading Bollinger Bands becomes genuinely powerful. A squeeze doesn't tell you which direction the breakout will occur — but it warns you that one is coming, giving you time to prepare your entry strategy.
Step 3: Interpret Price Position Within the Bands
Where price sits relative to the bands carries significant meaning. Here's how to interpret each scenario:
- Price near the upper band: The market is trading at the high end of its statistical range. In a strong uptrend, this can continue — it's a sign of momentum, not necessarily a sell signal.
- Price near the lower band: Prices are at the low end of the statistical range. In a downtrend, this can persist. In a ranging market, it may represent a mean-reversion buy.
- Price at the middle band: The market is at equilibrium. Directional bias depends on which way price bounces off this level.
"The bands are relative — not absolute. A stock trading at the upper band in a roaring uptrend is showing strength, not exhaustion. Context is everything."
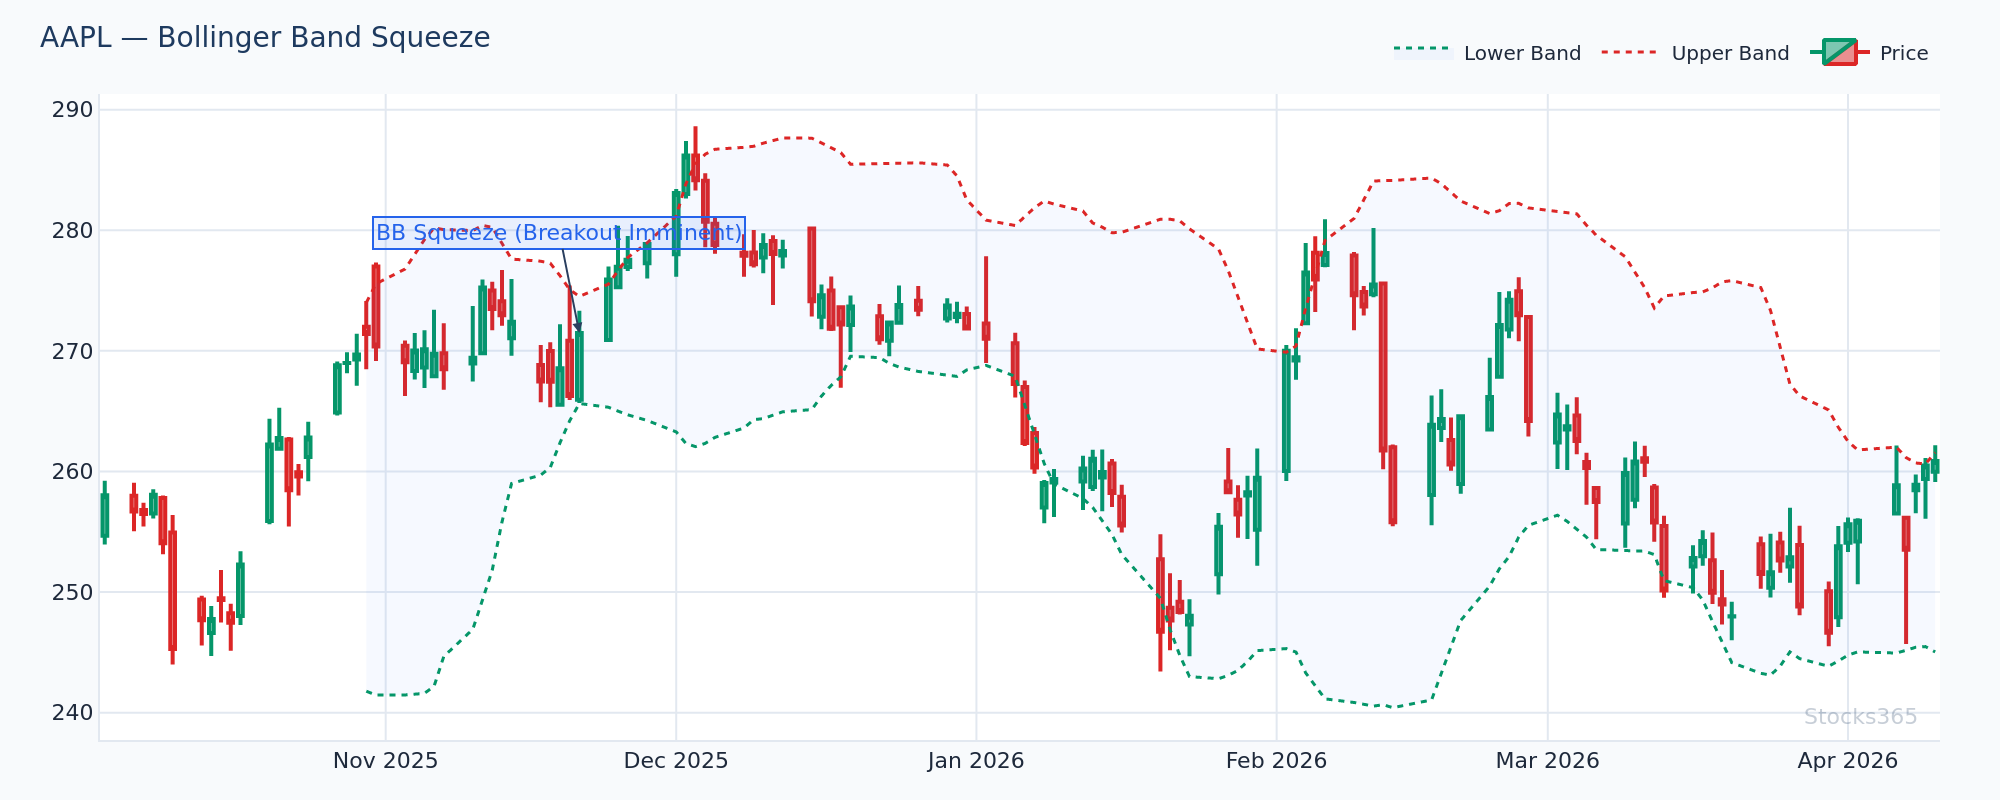
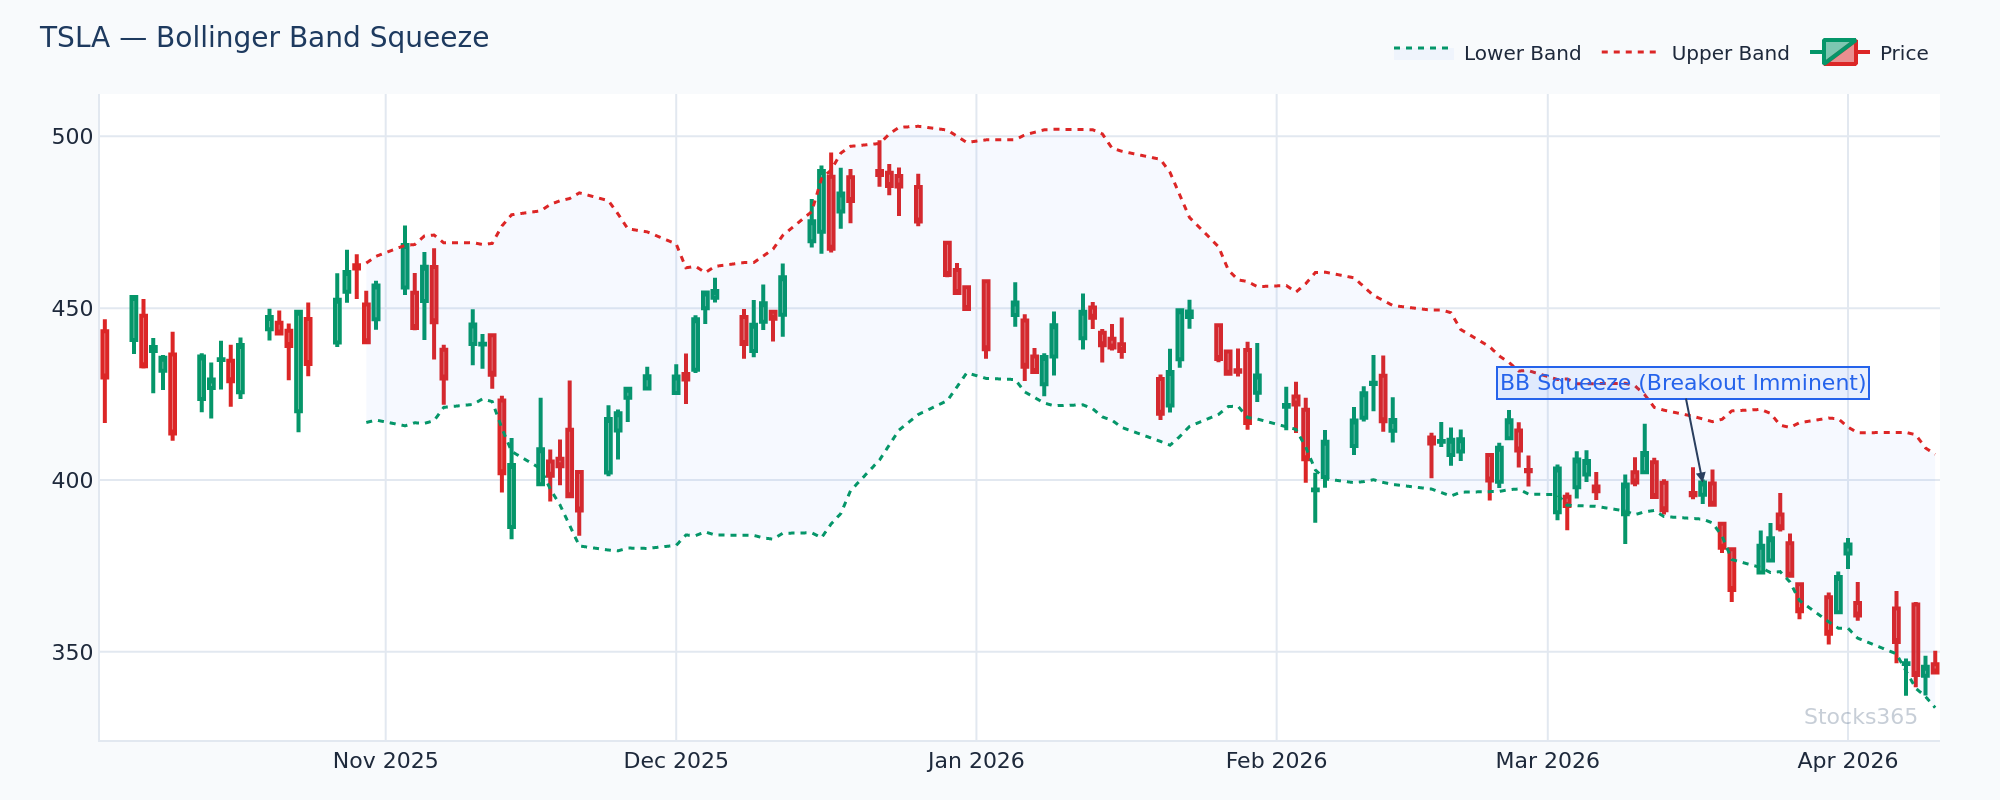
Step 4: Recognize the Bollinger Band Squeeze Signal
The Bollinger Band squeeze is arguably the most powerful pattern the indicator generates. It occurs when volatility compresses to historically low levels — the bands narrow dramatically around the price.
How to identify a squeeze:
- The upper and lower bands are closer together than they've been in months.
- The middle band is relatively flat.
- Volume is typically declining as the market consolidates.
How to trade the squeeze:
- Wait for price to close decisively outside one of the bands — this confirms the breakout direction.
- Enter in the direction of the breakout with a stop just inside the opposite band.
- Use momentum indicators (discussed below) to confirm direction before entering.
Consider a real-world scenario: MSFT consolidates between $420 and $440 for three weeks, with Bollinger Bands narrowing to their tightest level in six months. When price breaks above the upper band at $448 on above-average volume, that's a high-conviction breakout signal. A trader entering at $449 with a stop at $438 (middle band) has a defined risk setup with strong breakout momentum behind it.
Step 5: Identify the W-Bottom and M-Top Patterns
John Bollinger himself highlighted these two reversal patterns as particularly reliable:
W-Bottom (Bullish Reversal):
- Price makes an initial low that touches or breaks the lower band.
- Price bounces back toward the middle band.
- Price pulls back again but does not reach the lower band this time — a higher low forms inside the bands.
- Price then breaks above the middle band with conviction — this is the buy signal.
M-Top (Bearish Reversal):
- Price makes an initial high that touches or breaks the upper band.
- Price pulls back toward the middle band.
- Price rallies again but fails to reach the upper band — a lower high forms inside the bands.
- Price then breaks below the middle band — this is the sell signal.
Advanced Bollinger Band Concepts
Understanding the %B Indicator
The %B indicator quantifies where price sits within the Bollinger Bands on a scale from 0 to 1 (and beyond):
- %B = 1.0: Price is at the upper band.
- %B = 0.5: Price is at the middle band.
- %B = 0.0: Price is at the lower band.
- %B above 1.0: Price has broken above the upper band.
- %B below 0.0: Price has broken below the lower band.
%B is especially useful for scanning stocks programmatically and setting precise alerts — for instance, flagging any stock where %B drops below 0.05 (near the lower band) during a confirmed uptrend.
Bandwidth: Measuring Volatility Precisely
Bandwidth measures the width of the bands as a percentage of the middle band value:
Bandwidth = (Upper Band − Lower Band) / Middle Band × 100
Low bandwidth readings — especially near multi-month lows — are the most reliable way to identify squeeze conditions. When bandwidth on AMZN drops to 3% after averaging 8% over the prior six months, you're looking at a historically compressed volatility environment that's primed to expand.
Combining Bollinger Bands With RSI for Stronger Signals
Bollinger Bands measure volatility and price position. They don't directly measure momentum. That's why pairing them with a momentum oscillator like the Relative Strength Index (RSI) creates a far more complete picture.
The combination works like this:
- Price at lower band + RSI below 30: Potential oversold bounce. High-probability mean-reversion setup. Learn more about interpreting these signals in our guide to RSI Overbought and Oversold Levels.
- Price at upper band + RSI above 70: Potential overbought condition. Consider tightening stops or reducing position size.
- Price breaks upper band + RSI trending higher but not yet overbought: Strong breakout with room to run — often the best trend-following entry.
- Price at lower band but RSI shows bullish divergence: Powerful reversal signal. For a deep dive into divergence-based signals, check out our article on RSI Divergence Explained.
If you're new to RSI and want to understand how it works before combining it with Bollinger Bands, start with our complete beginner's guide to RSI. For those ready to go deeper, our guide on how to use RSI in trading covers practical applications in detail.
Common Bollinger Band Mistakes to Avoid
Mistake 1: Treating Band Touches as Automatic Signals
Price touching the upper band is not a sell signal by itself. In strong trending markets, price can ride the upper band for extended periods — a phenomenon Bollinger called "walking the band." Always require confirmation from at least one other indicator or price action signal before acting on a band touch alone.
Mistake 2: Ignoring the Trend Direction
Lower band touches in a strong downtrend are not buy signals — they're continuation patterns. Always align your Bollinger Band signals with the prevailing trend on a higher timeframe.
Mistake 3: Using Default Settings Without Optimization
The standard 20-period, 2 standard deviation setting works well for most swing trading scenarios, but it's not universal. Day traders often use shorter periods (10 or 14), while position traders may prefer longer settings (50 periods). The same optimization principle applies to RSI — our guide on RSI settings and period optimization covers this concept in depth.
Mistake 4: Confusing Bollinger Bands With Keltner Channels
Bollinger Bands use standard deviation (statistical volatility), while Keltner Channels use Average True Range (price range volatility). The two are related but distinct. Many advanced traders use both together — when Bollinger Bands contract inside Keltner Channels, it signals an extremely high-probability squeeze setup.
Bollinger Bands in Practice: A Real Trading Scenario
Let's walk through a complete trade example using Bollinger Bands on AAPL in 2026:
AAPL has been in a steady uptrend for six weeks, with the 20-period SMA rising consistently. Over the past 10 days, the stock consolidates between $215 and $222, with Bollinger Band bandwidth dropping to its lowest level in four months — a clear squeeze setup.
You check the AAPL signal page on Stocks365 and note a high Trust Score supporting the bullish bias, with RSI sitting at 54 — neither overbought nor oversold, leaving plenty of room to run. For a deeper understanding of comparing RSI with other momentum tools, our RSI vs Stochastic Oscillator guide is an excellent reference.
On day 11, AAPL closes at $226 — breaking above the upper Bollinger Band at $224 on a 40% volume surge. With the squeeze breakout confirmed, the uptrend intact, and RSI rising but not yet overbought, you enter long at $226.50 with:
- Entry: $226.50 (just above the breakout candle's close)
- Stop loss: $219.50 (just below the middle band)
- Target: $240 (projecting the bandwidth distance above the breakout point)
- Risk/Reward: Approximately 1:2
This is a textbook Bollinger Band squeeze breakout trade — high conviction, defined risk, logical target based on the band structure itself. You can monitor evolving signals in real time through the Stocks365 signals dashboard.
For traders who want to go even further with RSI-based confirmation, understanding hidden RSI divergence can add another confirmation layer to breakout setups like this one. And if you want to fully understand the math behind your momentum signals, our breakdown of how RSI is calculated demystifies the formula completely.
Bollinger Band Settings: What Works Best?
Standard Settings (Most Traders)
- Period: 20
- Standard Deviations: 2
- Best for: Daily and 4-hour swing trading
Short-Term Settings (Day Traders)
- Period: 10–14
- Standard Deviations: 1.5–2
- Best for: Intraday charts (15-min, 1-hour)
Long-Term Settings (Position Traders)
- Period: 50
- Standard Deviations: 2.1
- Best for: Weekly charts and longer-term trend trading
Frequently Asked Questions
What do Bollinger Bands tell you?
Bollinger Bands tell you two primary things: the current volatility level of a market (via band width) and the relative price position within that volatility range (via where price sits between the bands). Together, these insights help traders identify breakouts, reversals, and mean-reversion opportunities with statistical context behind them.
Is touching the upper Bollinger Band a sell signal?
Not automatically. In strong uptrends, price can "walk" along the upper band for extended periods — a sign of powerful momentum, not exhaustion. A band touch only becomes a meaningful sell signal when combined with confirming evidence: a bearish candlestick reversal pattern, a bearish RSI divergence, or an M-Top formation completing inside the bands.
What is a Bollinger Band squeeze and how do I trade it?
A Bollinger Band squeeze occurs when the bands narrow significantly, indicating that volatility has compressed to historically low levels. To trade it, wait for a confirmed breakout — a candle closing decisively outside either band, ideally on elevated volume. Enter in the breakout direction, place your stop on the opposite side of the middle band, and target a move roughly equal to the band width at the time of the squeeze.
What is the best indicator to use with Bollinger Bands?
RSI (Relative Strength Index) is widely considered the best companion indicator for Bollinger Bands. RSI adds momentum context that Bollinger Bands lack — confirming whether a move to the upper or lower band represents genuine momentum or an exhausted extreme. Volume indicators and MACD are also commonly paired with Bollinger Bands for additional confirmation.
Can Bollinger Bands work on all timeframes and asset classes?
Yes. Bollinger Bands were designed to be adaptive — because they're based on standard deviation, they automatically adjust to the volatility characteristics of any market and timeframe. They work effectively on stocks, ETFs, crypto, forex, and futures, across timeframes ranging from 1-minute intraday charts to monthly position-trading charts. You may need to adjust the period setting to match the timeframe's typical cycle length.