
MACD Cheat Sheet: Your Complete Quick Reference Guide for 2026
The Moving Average Convergence Divergence (MACD) indicator remains one of the most powerful tools in a trader's arsenal — yet most traders only scratch the surface of what it can do. This MACD cheat sheet is designed to be your go-to quick reference for every signal type the indicator generates, from basic crossovers to advanced divergence setups that most traders completely miss.
Whether you're scanning hundreds of tickers on the Stocks365 signals dashboard or analyzing a single position, having a structured reference for MACD signals will sharpen your decision-making and keep you consistent under pressure. Let's break down every signal type, what it means, and exactly how to trade it.
Key Takeaways:
• MACD generates four primary signal types: line crossovers, zero-line crosses, histogram reversals, and divergence
• Bullish signals occur when the MACD line crosses above the signal line or zero line
• Bearish signals occur when the MACD line crosses below the signal line or zero line
• Divergence between price and MACD often precedes major trend reversals
• Hidden divergence signals trend continuation, not reversal
• Always confirm MACD signals with volume and at least one additional indicator
• The standard MACD settings (12, 26, 9) work well for most timeframes
What Is MACD? A 60-Second Refresher
Before diving into the cheat sheet, a quick foundation is essential. MACD is a trend-following momentum indicator that shows the relationship between two exponential moving averages (EMAs) of a security's price.
The three core components are:
- MACD Line: 12-period EMA minus the 26-period EMA
- Signal Line: 9-period EMA of the MACD line
- Histogram: The visual difference between the MACD line and signal line
When the MACD line is above zero, the short-term average is above the long-term average — bullish momentum. When it's below zero, bearish momentum dominates. The signal line smooths out the MACD line to reduce noise, and crossovers between them generate the most widely-used trade signals.
MACD pairs exceptionally well with oscillators like RSI. If you want to deepen your understanding of complementary momentum tools, check out our guide on RSI vs Stochastic Oscillator for a comparison of two of the most popular oscillators used alongside MACD.
MACD Cheat Sheet: Signal Type #1 — Line Crossovers
Line crossovers are the most common and widely-traded MACD signals. They occur when the MACD line crosses above or below the signal line.
Bullish MACD Crossover
- What happens: MACD line crosses above the signal line
- What it means: Short-term momentum is accelerating faster than the smoothed average — buying pressure is increasing
- Best zone: Most powerful when the crossover occurs below the zero line (deeply oversold territory)
- Action: Consider long entry or adding to existing long positions
- Confirmation: Look for increasing volume, price breaking above a key resistance, or RSI rising above 50
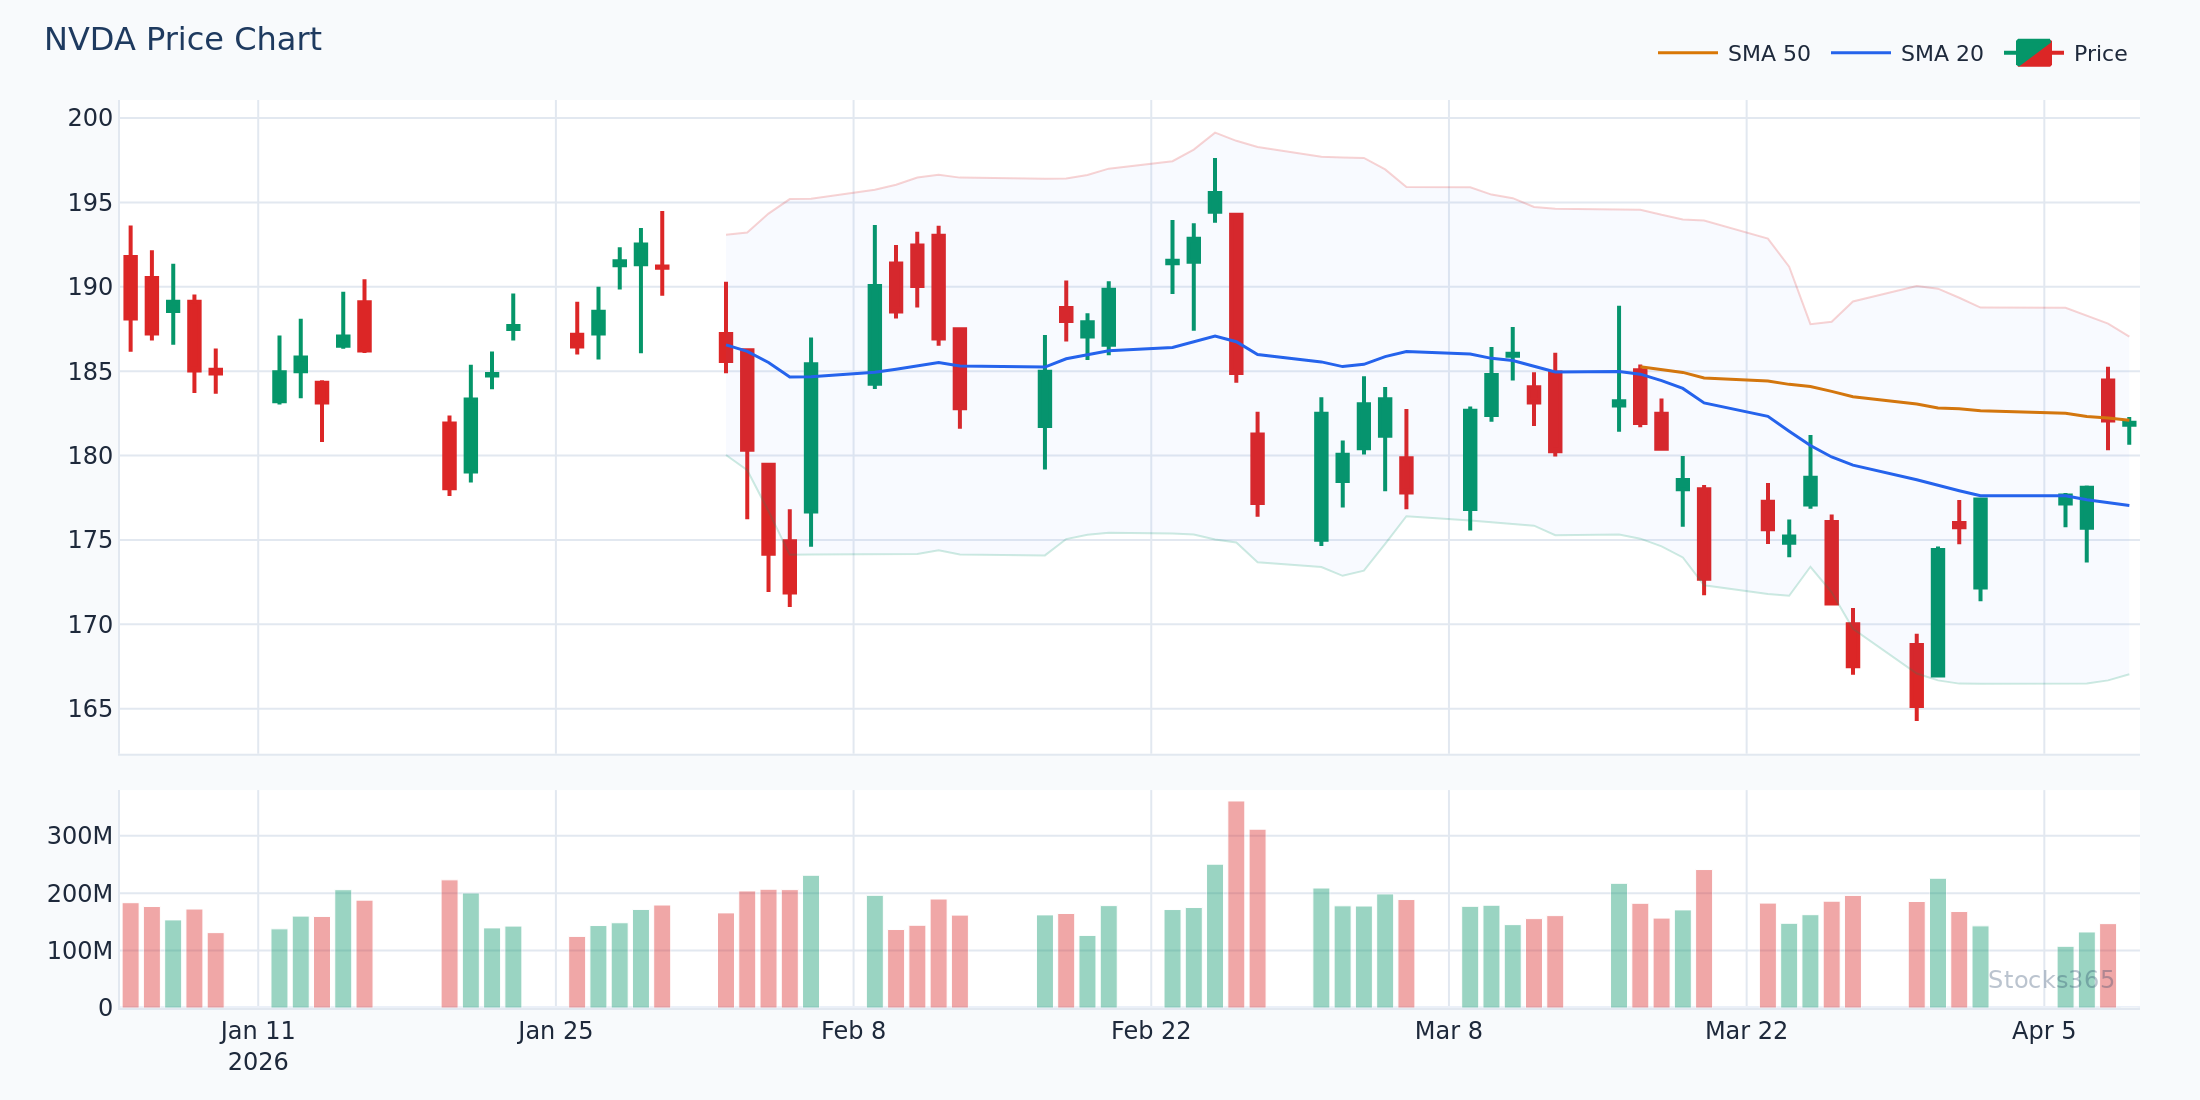
Example: In early 2026, NVDA traded down to the $580 support level. The MACD line crossed above the signal line while both were well below zero, and the histogram flipped from red to green. Traders who entered on that crossover confirmation captured a significant move back toward $650 as the bullish signal proved valid.
Bearish MACD Crossover
- What happens: MACD line crosses below the signal line
- What it means: Short-term momentum is weakening relative to the smoothed average — selling pressure is increasing
- Best zone: Most powerful when the crossover occurs above the zero line (overbought territory)
- Action: Consider short entry, tightening stop losses on longs, or reducing long exposure
- Confirmation: Look for declining volume on rallies, price breaking below key support, or RSI dropping below 50
Pro tip: Crossovers that occur in the middle of the histogram (near zero) are far less reliable than crossovers that happen at extremes. Filter out weak crossover signals by requiring them to form at least 0.5 standard deviations away from zero on the histogram.
MACD Cheat Sheet: Signal Type #2 — Zero Line Crosses
Zero line crosses — when the MACD line itself crosses above or below zero — are slower signals but represent more significant shifts in market momentum. Many professional traders consider these the most reliable MACD signals because they confirm a genuine trend shift.
Bullish Zero Line Cross
- What happens: MACD line crosses from negative to positive (above zero)
- What it means: The 12-period EMA has definitively crossed above the 26-period EMA — a true bullish trend shift
- Reliability: Very high — this signal has already been tested as the MACD line had to first cross the signal line to get here
- Action: Strong trend-following buy signal; ideal for swing traders and position traders
- Risk: Entry is later in the move; more momentum may already be priced in
Bearish Zero Line Cross
- What happens: MACD line crosses from positive to negative (below zero)
- What it means: The short-term EMA has fallen decisively below the long-term EMA — a confirmed bearish trend
- Reliability: Very high — confirmation of a trend already in progress
- Action: Exit long positions, consider shorts; strong signal for trend-following strategies
- Risk: Significant downside may have already occurred before this signal triggers
Understanding how momentum indicators confirm trend shifts is critical. If you use RSI alongside MACD for zero line analysis, our deep dive on how to use RSI in trading will show you exactly how to align both signals for higher-probability trades.
MACD Cheat Sheet: Signal Type #3 — Histogram Analysis
The MACD histogram is arguably the most underutilized component of the indicator. While most traders focus on crossovers, the histogram provides early warning signals before crossovers occur — giving you a significant timing edge.
Histogram Expansion (Momentum Building)
- What it looks like: Histogram bars growing progressively larger (either in positive or negative territory)
- Bullish reading: Green bars growing taller above zero — bulls are gaining strength
- Bearish reading: Red bars growing deeper below zero — bears are gaining strength
- Action: Stay with the prevailing trend; this is not the time to counter-trade
Histogram Contraction (Momentum Fading)
- What it looks like: Histogram bars shrinking back toward zero
- Bullish signal: Red bars getting shorter (bearish momentum fading) — potential bullish reversal ahead
- Bearish signal: Green bars getting shorter (bullish momentum fading) — potential bearish reversal ahead
- Action: Prepare for a potential crossover; tighten stops and watch for entry opportunities
Histogram Divergence from Zero
When the histogram reaches an extreme high or low and begins to retreat toward zero while price continues in its original direction, this is often the earliest warning signal of a momentum shift — sometimes appearing several candles before any official crossover.
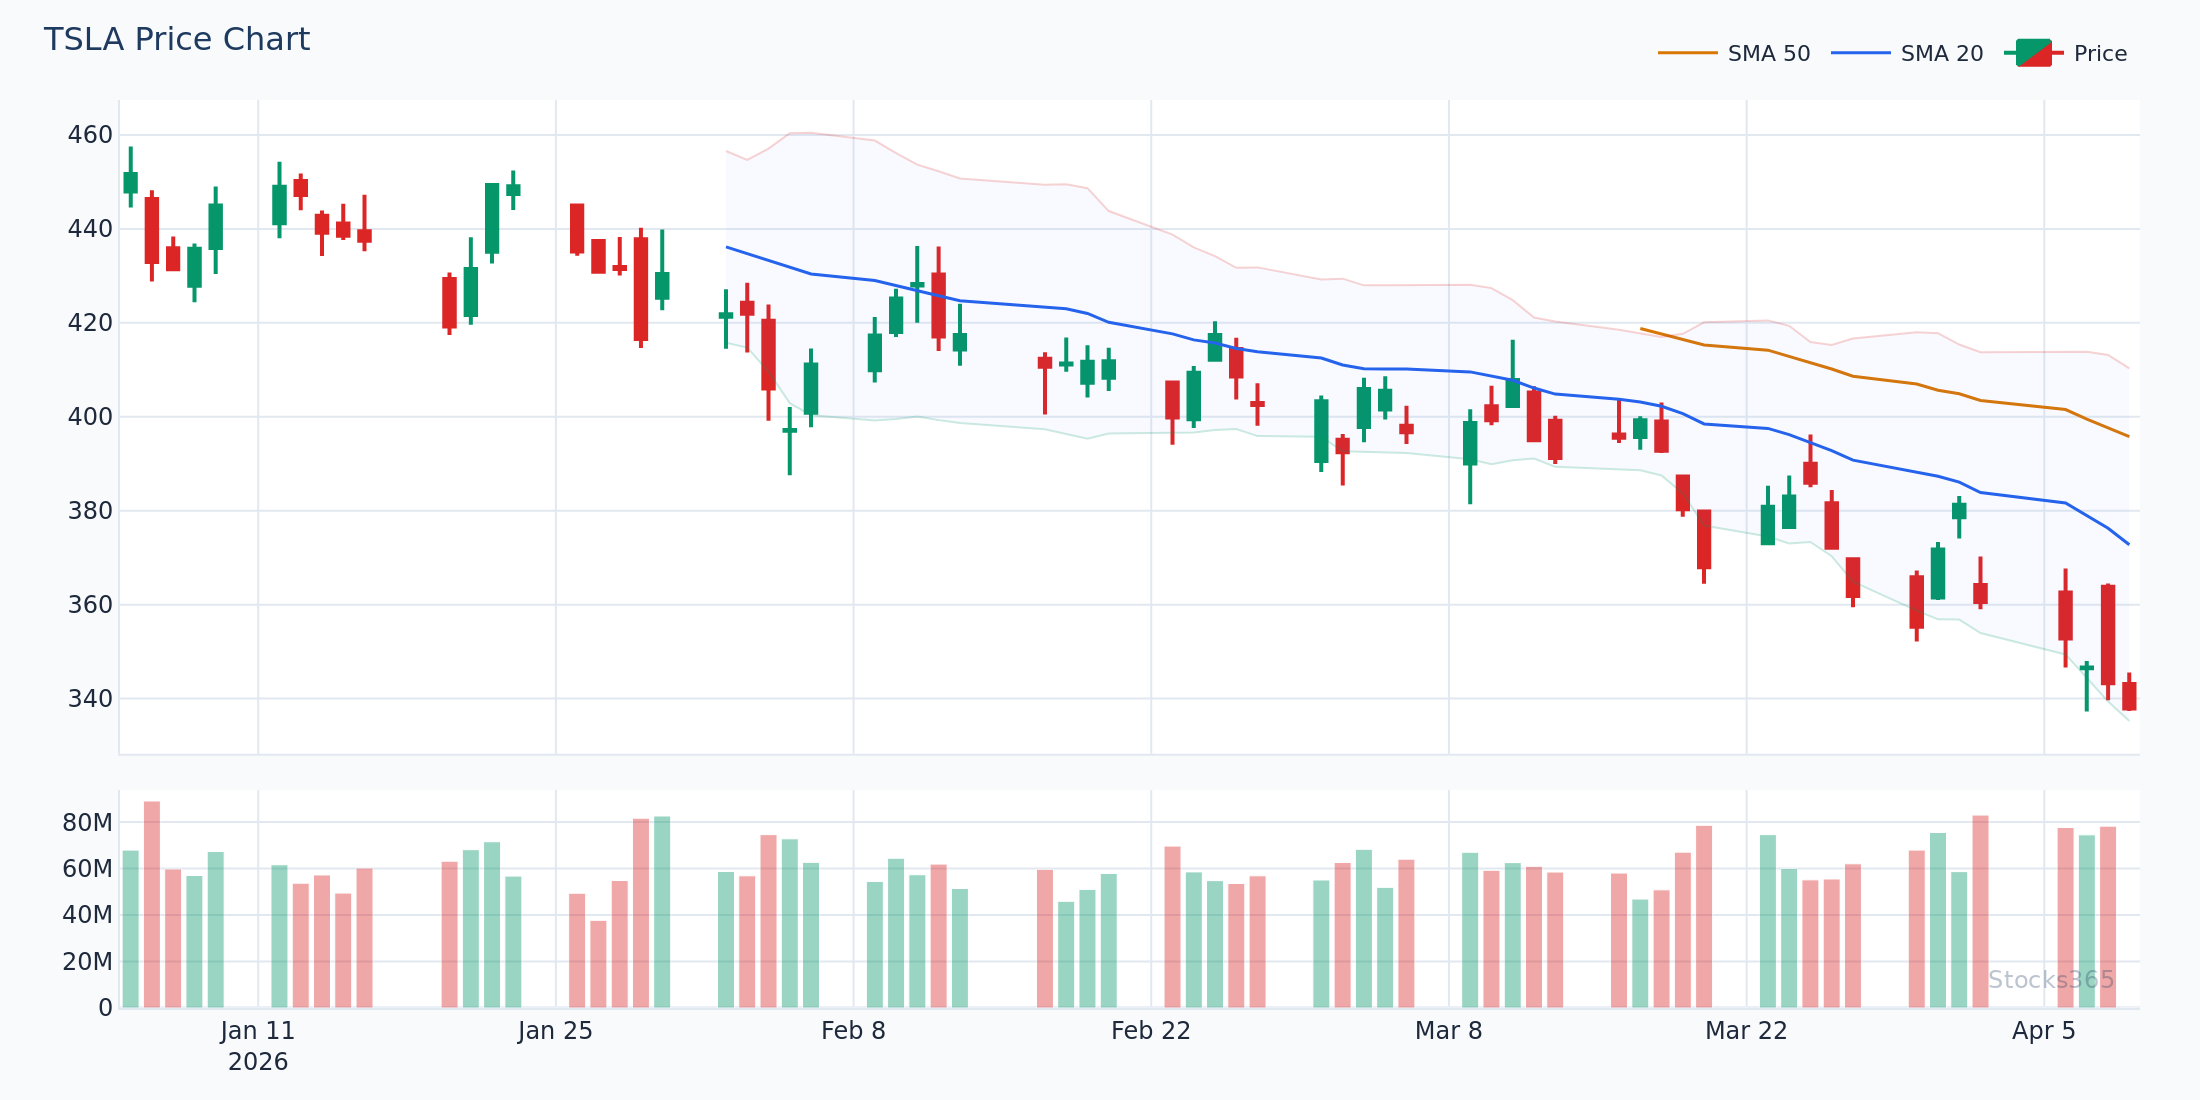
Example: TSLA's histogram reached extreme positive values around $340 earlier in 2026. As the histogram bars began contracting while price made a marginal new high, experienced traders identified the divergence and reduced long exposure ahead of a 12% pullback to the $298 support zone.
MACD Cheat Sheet: Signal Type #4 — Classic Divergence
MACD divergence is where the indicator truly separates skilled traders from beginners. Divergence occurs when the price action and MACD move in opposite directions — and it's one of the most reliable warning signals of an impending trend reversal.
Bullish MACD Divergence
- Setup: Price makes a lower low, but MACD makes a higher low
- Meaning: Despite price falling to new lows, bearish momentum is weakening — bulls are quietly gaining ground
- Reliability: Higher on longer timeframes (daily and weekly charts)
- Entry trigger: Wait for MACD line to cross above the signal line before entering
- Stop loss: Just below the most recent price low
Bearish MACD Divergence
- Setup: Price makes a higher high, but MACD makes a lower high
- Meaning: Despite price reaching new highs, bullish momentum is deteriorating — distribution may be occurring
- Reliability: Most powerful at significant resistance levels or after extended uptrends
- Entry trigger: Wait for MACD line to cross below the signal line before shorting
- Stop loss: Just above the most recent price high
MACD divergence shares fundamental principles with RSI divergence. For a comprehensive understanding of how divergence works across multiple indicators, our article on RSI divergence explained offers a perfect complement to this MACD cheat sheet.
MACD Cheat Sheet: Signal Type #5 — Hidden Divergence
Hidden divergence is the signal that separates advanced traders from the pack. While classic divergence signals reversals, hidden divergence signals trend continuation — making it invaluable for traders looking to add to positions during pullbacks within a strong trend.
Bullish Hidden Divergence
- Setup: Price makes a higher low (uptrend pullback), but MACD makes a lower low
- Meaning: The uptrend is intact; price is merely consolidating before continuing higher
- Action: Strong buy signal in an established uptrend — ideal for adding to long positions
- Context required: Must be in a confirmed uptrend; this signal is meaningless in sideways or downtrending markets
Bearish Hidden Divergence
- Setup: Price makes a lower high (downtrend bounce), but MACD makes a higher high
- Meaning: The downtrend is intact; price is merely bouncing before resuming lower
- Action: Strong sell/short signal in an established downtrend — ideal for adding to short positions or shorting bounces
- Context required: Must be in a confirmed downtrend
Hidden divergence is a concept that applies powerfully to RSI as well. For a deeper exploration of this advanced technique, our guide on hidden RSI divergence walks through the same concept with RSI-specific examples that will reinforce your understanding of momentum divergence as a whole.
MACD Settings: Which Parameters Work Best?
The standard MACD settings (12, 26, 9) were designed for daily charts and remain the most widely-used configuration. However, adjusting these parameters can make the indicator more responsive to different trading styles and timeframes.
MACD Settings Quick Reference
- Standard (12, 26, 9): Best for daily swing trading; balanced between sensitivity and noise
- Fast (5, 13, 5): Best for intraday or scalping; more signals, more false positives
- Slow (19, 39, 9): Best for weekly position trading; fewer signals, higher reliability
- Crypto-optimized (20, 40, 9): Accounts for crypto's higher volatility on daily charts
The same principle applies to RSI — different periods dramatically change how the indicator behaves. For a parallel deep dive on optimizing indicator periods, see our article on RSI settings and period optimization.
How to Use the MACD Cheat Sheet in Practice
Having all these signals memorized is only useful if you have a systematic approach to applying them. Here's a practical framework for integrating this MACD cheat sheet into your daily trading workflow:
Step 1: Identify the Trend
Before looking at any MACD signal, determine whether the stock is in an uptrend, downtrend, or consolidation on the timeframe you're trading. MACD signals in trending markets are far more reliable than signals in choppy, sideways markets. Use the 50-day and 200-day moving averages as your first filter.
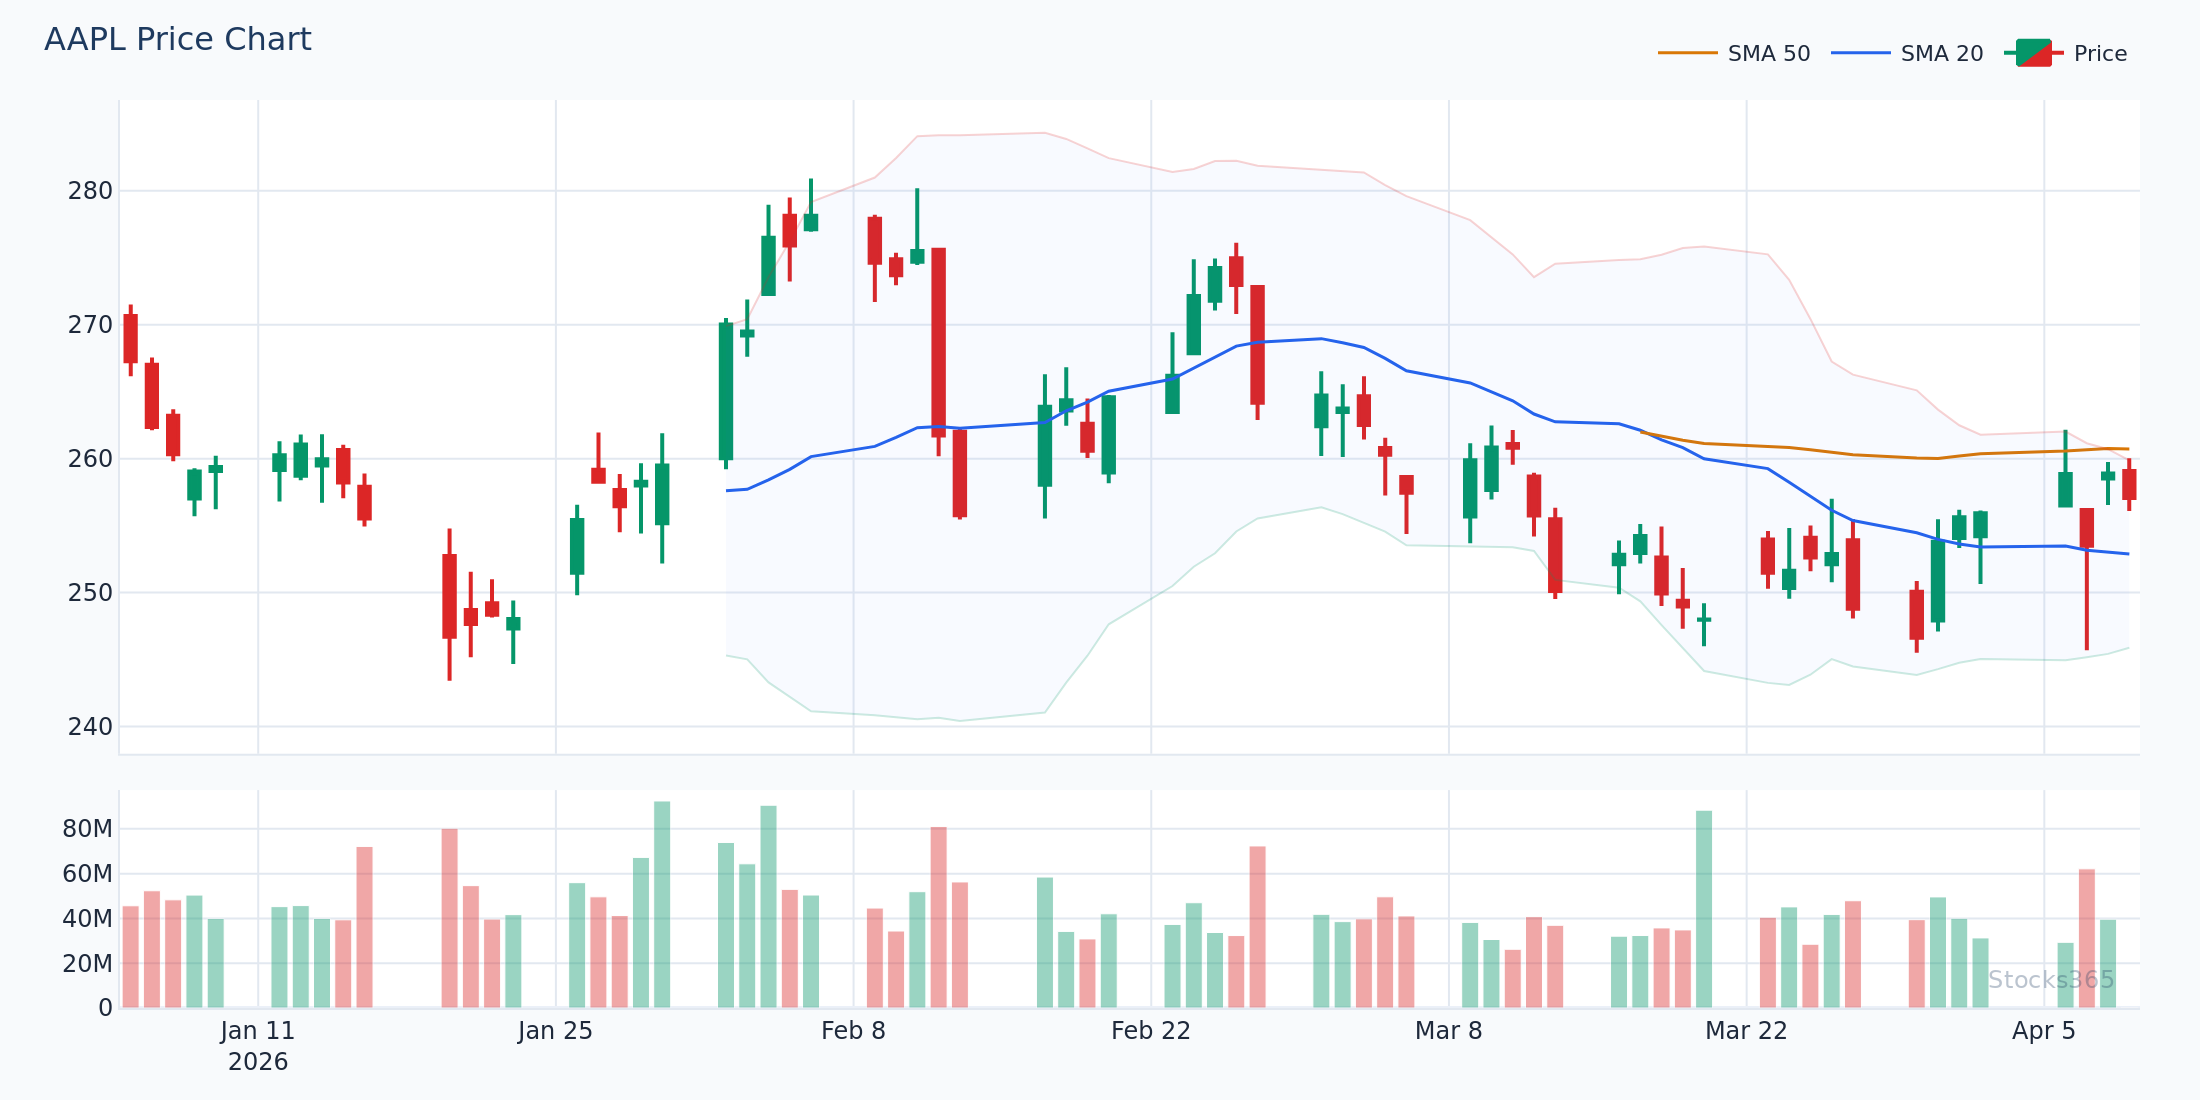
Step 2: Check the Stocks365 Trust Score
When evaluating a potential MACD setup on a specific stock — for example, checking the AAPL signal page — the Stocks365 Trust Score gives you an algorithmic confidence reading that aggregates multiple technical factors. A high Trust Score alongside a MACD crossover signal dramatically increases the probability of a successful trade. Never trade a weak Trust Score setup regardless of how clean the MACD pattern looks.
Step 3: Identify the MACD Signal Type
Using this cheat sheet, classify which signal type is forming:
- Is it a line crossover? Check whether it's happening above or below zero.
- Is it a zero line cross? Confirm the trend context.
- Is the histogram contracting? Look for early momentum warnings.
- Is there divergence? Determine whether it's classic (reversal) or hidden (continuation).
Step 4: Seek Confirmation
No MACD signal should be traded in isolation. Pair your MACD cheat sheet reading with at least one of the following confirming factors:
- RSI crossing above/below 50 (see our RSI overbought and oversold guide)
- Volume spike confirming the move
- Price breaking a key technical level (support, resistance, trendline)
- Bollinger Band squeeze breaking out in the signal direction
Step 5: Define Risk Before Entry
Every trade needs a defined stop loss before entry. For MACD setups:
- Crossover trades: Stop below the swing low (for longs) or above the swing high (for shorts)
- Divergence trades: Stop beyond the divergence extreme (below the lower low for bullish divergence)
- Zero line cross trades: Stop at the zero line itself — if MACD recrosses back, the thesis is broken
Common MACD Mistakes to Avoid
Even with a complete MACD cheat sheet at your disposal, these mistakes can still erode your edge:
- Trading every crossover: In ranging markets, MACD generates continuous false crossovers. Only trade crossovers that align with the broader trend direction.
- Ignoring timeframe alignment: A bullish crossover on a 5-minute chart means very little if the daily chart shows a strong downtrend. Always confirm on higher timeframes first.
- Forgetting that MACD is lagging: MACD is a lagging indicator — it confirms momentum shifts, it doesn't predict them. Use it to confirm what price action is already suggesting, not as a crystal ball.
- Treating divergence as immediate: Divergence can persist for many candles before resolving. Never enter a divergence trade without a triggering crossover or price confirmation.
- Using MACD alone: MACD works best as part of a complete system. If you're new to building multi-indicator strategies, start with our beginner-friendly complete guide to RSI as a foundation for understanding momentum indicators.
Frequently Asked Questions
What is the most reliable MACD signal?
The zero line cross is generally considered the most reliable MACD signal because it confirms a definitive shift in the relationship between the two underlying moving averages. However, reliability must always be assessed in context — zero line crosses in strongly trending markets are far more dependable than those occurring in sideways, choppy conditions. Combining a zero line cross with high volume and RSI confirmation above or below 50 significantly improves accuracy.
How do I use this MACD cheat sheet for day trading?
For day trading, use faster MACD settings (such as 5, 13, 5) on 5-minute or 15-minute charts, and focus primarily on histogram analysis and line crossovers rather than zero line crosses (which are too slow for intraday moves). Always confirm against the higher timeframe (60-minute or daily) trend direction. The Stocks365 signals dashboard can help you identify the strongest intraday setups with real-time filtering.
What's the difference between MACD divergence and hidden divergence?
Classic MACD divergence signals a potential trend reversal — price and MACD move in opposite directions at a swing high or low. Hidden divergence signals trend continuation — price pulls back within a trend while MACD makes a contrary extreme, indicating the underlying trend is still intact. Classic divergence is most useful for identifying potential tops and bottoms, while hidden divergence is most useful for finding re-entry points within an established trend.
Should I change the default MACD settings?
The default settings of 12, 26, 9 are the industry standard for daily charts and are used by the vast majority of traders and algorithms, which actually increases their self-fulfilling reliability. For beginners, stick with the defaults until you have significant experience reading MACD signals. Advanced traders can experiment with adjusted settings for specific timeframes or asset classes (crypto, futures, etc.), but should always backtest any changes before deploying them with real capital.
Can MACD be used with other indicators?
Absolutely — and it should be. MACD is most powerful when used in combination with other tools. RSI is the most popular companion indicator, as it measures overbought/oversold conditions that MACD doesn't capture. Volume analysis, Bollinger Bands, and moving average systems all complement MACD effectively. For guidance on building a complete indicator toolkit, explore our guides on how RSI is calculated to understand the mathematical foundations that make these indicators work together.