
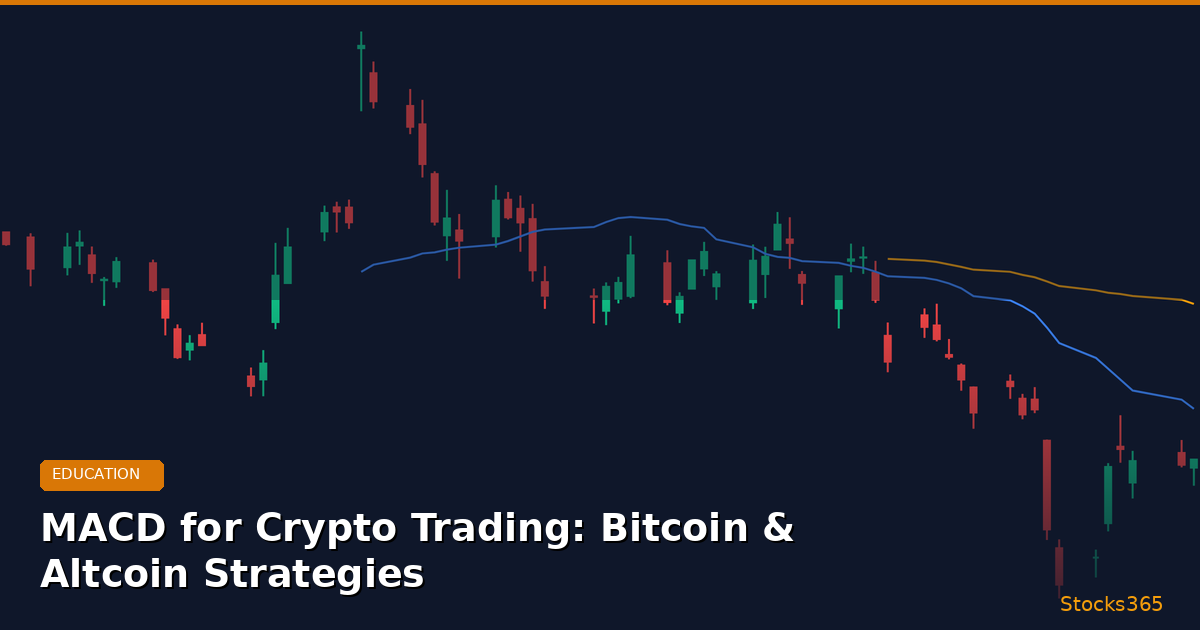
MACD Crypto Strategy: The Complete Guide for Bitcoin & Altcoin Traders
The Moving Average Convergence Divergence (MACD) indicator is one of the most powerful tools available to cryptocurrency traders. Whether you're scalping Bitcoin on a 15-minute chart or swing trading altcoins over several weeks, a well-executed MACD crypto strategy can dramatically improve your entry and exit timing — and ultimately, your profitability.
In 2026, crypto markets remain as volatile as ever. With Bitcoin regularly swinging 5–10% in a single session and altcoins capable of doubling or halving in days, having a reliable technical framework isn't optional — it's essential. This guide breaks down exactly how to use MACD for crypto trading, covering Bitcoin-specific strategies, altcoin adaptations, divergence signals, and multi-timeframe confirmation techniques.
Key Insight: The MACD indicator was designed for stock markets in the 1970s — but its core logic is arguably even more powerful in the 24/7, high-volatility world of cryptocurrency trading.
What Is MACD? A Quick Refresher for Crypto Traders
Before diving into strategy, let's ground ourselves in the mechanics. The MACD indicator consists of three components:
- MACD Line: The difference between the 12-period and 26-period Exponential Moving Averages (EMAs)
- Signal Line: A 9-period EMA of the MACD line
- Histogram: The visual difference between the MACD line and the Signal line
Standard settings (12, 26, 9) work well for daily and 4-hour charts in crypto, but we'll explore optimized settings for different crypto trading styles later in this guide. Understanding how moving averages are calculated helps you appreciate why MACD responds differently to Bitcoin's explosive moves versus the more gradual trends seen in traditional equities.
If you're also working with momentum oscillators in your toolkit, our guide on RSI vs Stochastic Oscillator provides excellent context for comparing momentum-based signals — many of the principles apply directly to combining those tools with MACD.
Why MACD Works Especially Well for Cryptocurrency
Crypto markets have unique characteristics that actually enhance MACD's effectiveness:
- Strong trending behavior: Bitcoin and major altcoins regularly produce sustained directional moves of 20–100%+, which is where MACD thrives
- 24/7 markets: MACD's EMA-based calculations incorporate continuous price action without overnight gaps distorting signals
- High retail participation: Self-fulfilling prophecy is real — when millions of retail traders watch the same MACD crossovers, those signals gain added significance
- Volatility cycles: Crypto's compression-and-explosion price behavior creates textbook MACD histogram divergence patterns
Understanding momentum in crypto is critical. If you're new to momentum indicators in general, our Complete Beginner's Guide to RSI provides foundational knowledge that pairs naturally with MACD analysis.
Core MACD Crypto Strategies
Strategy 1: The MACD Crossover for Bitcoin Trend Trading
The most fundamental MACD crypto strategy is the crossover — and for good reason. When the MACD line crosses above the Signal line, it signals building bullish momentum. When it crosses below, bearish momentum is accelerating.
Bitcoin Crossover Trade Example (Daily Chart):
- Bitcoin consolidates between $82,000 and $88,000 for two weeks
- The MACD histogram starts shrinking from deeply negative territory
- The MACD line crosses above the Signal line at $85,400
- Entry: Long at $85,800 on the next daily candle open
- Stop Loss: Below the recent swing low at $81,500
- Target: Previous resistance at $94,000–$96,000
The key nuance here: not all crossovers are equal. A crossover that occurs when the MACD line is well below the zero line (deeply oversold territory) carries far more weight than a crossover near zero. This is the same principle discussed in mastering overbought and oversold signals — context matters enormously.
Strategy 2: MACD Zero Line Cross for Altcoin Momentum Trades
The zero line cross is often overlooked by beginners but is a favorite of professional altcoin traders. When the MACD line crosses above zero, it means the 12-period EMA has crossed above the 26-period EMA — a confirmed trend change.
Altcoin Zero Line Cross Setup:
- Wait for a significant altcoin (ETH, SOL, AVAX) to complete a correction phase
- Watch for MACD line approaching zero from below
- Enter long when MACD line breaks above zero with a rising histogram
- Use the zero line as your ongoing trend filter — only take long signals while MACD stays above zero
This strategy is particularly effective during altcoin season — those multi-month periods when Bitcoin's dominance fades and capital rotates aggressively into alternative cryptocurrencies.
Strategy 3: MACD Histogram Divergence — The High-Probability Reversal Signal
MACD divergence is where the indicator truly earns its reputation as a professional-grade tool. Divergence occurs when price makes a new high (or low) but the MACD histogram or line does not confirm it — signaling weakening momentum and a potential reversal.
Bullish MACD Divergence Example:
- Ethereum drops from $3,800 to $3,100 (first low) — MACD histogram reaches -45
- ETH then drops again to $2,950 (lower low) — but MACD histogram only reaches -28
- Price made a lower low, but momentum made a higher low — classic bullish divergence
- Entry: Long at $3,050 when price bounces and MACD histogram starts rising
- Stop: Below $2,880
- Target: $3,500+ as divergence resolves
Bearish MACD Divergence Example:
- Solana rallies from $140 to $185 — MACD peaks at +32
- SOL pushes to a new high of $194 — MACD only reaches +19
- Price made a higher high but momentum made a lower high — bearish divergence confirmed
- Short Entry: $191 when price starts declining
- Stop: Above $197
- Target: $165–$168 support zone
MACD divergence and RSI divergence are complementary signals. When both indicators show divergence simultaneously, the signal becomes exceptionally powerful. To master RSI divergence signals, our dedicated guide on RSI Divergence: Bullish & Bearish Signals is essential reading — use it alongside this MACD guide for maximum edge.
For advanced traders, Hidden RSI Divergence signals can also be identified on the MACD histogram using the same logic — these are continuation signals that most retail traders completely miss.
Optimizing MACD Settings for Crypto Trading
Standard Settings vs. Crypto-Optimized Settings
The default MACD settings (12, 26, 9) were designed for daily stock charts with 5-day trading weeks. Crypto's 24/7 nature and higher volatility mean traders often get better results with adjusted parameters.
Recommended MACD Settings by Crypto Trading Style:
- Scalping (1m–15m charts): MACD (5, 13, 5) — faster response, more signals, requires strict risk management
- Day Trading (1h–4h charts): MACD (8, 21, 5) — balanced sensitivity for intraday crypto moves
- Swing Trading (4h–Daily charts): MACD (12, 26, 9) — standard settings work excellently at this timeframe
- Position Trading (Daily–Weekly charts): MACD (19, 39, 9) — slower settings to filter noise during multi-week or multi-month Bitcoin trends
This mirrors the logic of optimizing indicator periods for specific market conditions — a concept we explore in depth in our guide to RSI Settings: Mastering the Best Period for Your Strategy. The same principle applies directly to MACD period optimization.
Timeframe Selection: The MACD Crypto Trader's Framework
Professional crypto traders don't look at a single timeframe. They use a top-down approach:
- Weekly chart: Identify the macro trend — is MACD above or below zero?
- Daily chart: Identify swing trade opportunities and key crossovers
- 4-hour chart: Time entries within the daily trend direction
- 1-hour chart: Fine-tune entry price and confirm momentum alignment
Only take trades where at least two timeframes show aligned MACD signals. A bullish crossover on the 4-hour that aligns with a bullish MACD on the daily significantly improves win rate.
Combining MACD with Other Indicators for Crypto
MACD + RSI: The Crypto Trader's Power Combination
MACD and RSI measure different aspects of momentum, making them highly complementary rather than redundant. MACD is a trend-following momentum indicator, while RSI is a mean-reversion oscillator. Together, they provide a more complete market picture.
Combined Signal Rules:
- High-confidence long: MACD bullish crossover + RSI rising from below 40 + price above key support
- High-confidence short: MACD bearish crossover + RSI declining from above 60 + price below key resistance
- Divergence confluence: Both MACD and RSI showing bearish divergence simultaneously = extremely high-probability reversal signal
Understanding how RSI is calculated helps you see exactly why it complements MACD — they use different mathematical approaches to measure the same underlying force of price momentum. Our article on How RSI Is Calculated breaks this down step by step.
For a complete operational guide on deploying RSI signals alongside MACD in live trading, see our comprehensive resource on How to Use RSI in Trading.
MACD + Volume Analysis for Crypto
Volume is the fuel behind price moves. A MACD bullish crossover accompanied by expanding volume is far more reliable than one occurring on thin volume. In crypto, watch for:
- MACD crossover with volume 1.5x or greater than the 20-period average volume = strong signal
- MACD crossover on declining volume = treat with caution, wait for confirmation
- Histogram expansion with spike in volume = trend likely to continue
MACD Crypto Strategy: Common Mistakes to Avoid
Mistake 1: Trading Every Crossover in Sideways Markets
MACD is a trend-following indicator — it performs poorly in choppy, range-bound markets. When Bitcoin is consolidating in a tight range, MACD will generate frequent false crossovers (called "whipsaws"). Before applying your MACD strategy, check whether the market is trending or ranging using a simple ADX reading or by visually inspecting price structure.
Mistake 2: Ignoring the Zero Line Context
A bearish crossover occurring when the MACD line is at +80 carries much more weight than one at +5. Always note the absolute position of MACD relative to zero when evaluating any signal.
Mistake 3: Using MACD in Isolation
No single indicator should drive trading decisions. MACD is a signal generator — confluence with price structure, volume, and complementary indicators like RSI dramatically improves accuracy. Use the Stocks365 Signals Dashboard to cross-reference technical signals with trust score data, giving you a multi-dimensional view of any asset's momentum profile.
Mistake 4: Applying Identical Settings Across All Crypto Assets
Bitcoin moves differently from a low-cap altcoin. A MACD setting that works perfectly for BTC's smooth daily trends may generate constant noise on a volatile small-cap token. Always backtest your chosen settings on the specific asset you're trading.
Advanced MACD Concepts for Serious Crypto Traders
MACD Histogram Slope Analysis
Instead of waiting for a full crossover, sophisticated traders read the MACD histogram's slope for early entries. When the histogram is still negative but each bar is getting shorter (less negative), momentum is shifting before the official crossover occurs. This technique allows entries 1–3 candles earlier than a standard crossover signal.
Hidden MACD Divergence for Trend Continuation
While regular divergence signals reversals, hidden divergence signals trend continuation. In a bullish trend:
- Price makes a higher low (normal pullback in an uptrend)
- MACD histogram makes a lower low (appears bearish)
- This is actually a hidden bullish divergence — the trend is likely to continue upward
This advanced concept mirrors the hidden divergence principles covered in our article on Hidden RSI Divergence — and the two signals used together create some of the highest-probability setups available to technical traders.
MACD for Crypto Futures and Leveraged Trading
For traders using crypto futures or perpetual contracts, MACD settings require extra consideration. With leverage amplifying both gains and losses:
- Use slower MACD settings on higher timeframes to avoid overleveraged entries on false signals
- Only enter MACD-based positions in clear trending markets, not consolidations
- Set hard stop losses based on technical invalidation points (swing highs/lows), not arbitrary percentage losses
- Consider the funding rate environment — a heavily long-skewed funding rate can override technical signals
The Stocks365 trust score system provides an additional layer of validation here — when our algorithmic trust score aligns with a MACD signal on a major crypto-correlated asset, the conviction level rises significantly. Explore live signal examples across assets at pages like /signal/AAPL to see how multi-factor signal analysis works in practice.
Key Takeaways
MACD Crypto Strategy — Summary of Core Principles:
- ✅ MACD crossovers are most reliable when occurring far from the zero line
- ✅ Zero line crosses confirm trend changes — use them as a bias filter for all trades
- ✅ MACD divergence (both regular and hidden) provides the highest-probability reversal and continuation signals
- ✅ Optimize MACD settings (12,26,9 for swing; 8,21,5 for day trading; 19,39,9 for position trading) based on your style
- ✅ Always confirm MACD signals with volume, price structure, and complementary indicators like RSI
- ✅ Use multi-timeframe analysis — minimum two aligned timeframes before entering a position
- ✅ Avoid MACD strategies during sideways, choppy market conditions — wait for trend establishment
- ✅ Hidden MACD divergence identifies high-probability trend continuation setups missed by most retail traders
Frequently Asked Questions
What is the best MACD setting for crypto trading?
The best MACD setting depends on your trading style. For swing trading Bitcoin and major altcoins on daily or 4-hour charts, the standard (12, 26, 9) works well. For day trading on 1-hour charts, (8, 21, 5) provides faster and more responsive signals. For long-term position trading, consider (19, 39, 9) to filter out noise. Always backtest your preferred settings on the specific crypto asset before trading live.
Is MACD reliable for altcoin trading?
MACD can be highly reliable for altcoin trading, especially on higher timeframes (4-hour and daily). However, low-liquidity altcoins can generate more false signals due to erratic price movements and thin order books. For altcoins, consider using slightly faster MACD settings and always confirm signals with volume analysis and price structure. MACD works best during trending altcoin markets and should be used cautiously during consolidation phases.
How do I confirm a MACD crypto signal before entering a trade?
Confirm MACD signals using a multi-factor approach: (1) Check that the signal aligns with the higher timeframe trend direction, (2) Confirm with RSI — a MACD bullish crossover is stronger when RSI is rising from below 40, (3) Look for volume expansion on the crossover candle, (4) Ensure the signal occurs near a key price structure level (support, resistance, or moving average). The more confirming factors present, the higher the probability of a successful trade.
What is the difference between MACD divergence and a MACD crossover?
A MACD crossover occurs when the MACD line crosses the Signal line — it's a direct momentum trigger signal based purely on the indicator's own components. MACD divergence, by contrast, compares the indicator's behavior to actual price action — when price makes a new extreme (high or low) but MACD does not confirm it, that divergence suggests weakening momentum and a potential reversal. Divergence signals are generally considered higher probability than simple crossovers because they capture a structural breakdown in the momentum behind a price move.
Can I use MACD alone to trade Bitcoin profitably?
While MACD is a powerful tool, using it in isolation is not recommended for consistent profitability. No single indicator captures the full picture of market dynamics. MACD works best when combined with RSI for momentum confirmation, volume analysis for signal validation, and price structure analysis for context. Many professional traders also use tools like the Stocks365 trust score system to add an additional layer of algorithmic signal validation before committing capital to any trade.