
MACD Swing Trading: Your Complete Strategy Guide for 2026
The Moving Average Convergence Divergence indicator — better known as MACD — remains one of the most powerful tools available to swing traders in 2026. Whether you're holding positions for two days or two weeks, understanding how to read MACD signals correctly can be the difference between consistently profitable trades and costly false entries. This guide covers everything you need: optimal MACD settings for swing trading, entry and exit strategies, confluence techniques, and real-world trade examples.
- The standard MACD (12, 26, 9) settings work well for swing trading, but (8, 21, 5) offers faster signals on daily charts
- MACD crossovers, zero-line crosses, and histogram reversals each provide distinct swing trade entry signals
- MACD divergence is one of the most reliable early-warning signals for trend reversals
- Combining MACD with RSI and volume confirmation dramatically improves signal quality
- Always confirm MACD signals with broader trend context and support/resistance levels
- Stocks365's Trust Score helps filter high-probability MACD setups from low-quality noise
What Is MACD and Why Swing Traders Love It
MACD was developed by Gerald Appel in the late 1970s and measures the relationship between two exponential moving averages (EMAs). It consists of three components:
- MACD Line: The difference between the 12-period EMA and the 26-period EMA
- Signal Line: A 9-period EMA of the MACD line itself
- Histogram: The visual difference between the MACD line and the signal line
For swing traders specifically, MACD hits a sweet spot. Unlike day traders who need sub-minute precision, swing traders work on daily or 4-hour charts where MACD smooths out intraday noise while still responding quickly enough to capture multi-day momentum shifts. The indicator tells you two critical things simultaneously: the direction of momentum and its strength — both essential inputs for timing swing entries and exits.
Best MACD Settings for Swing Trading
The default MACD settings (12, 26, 9) were designed for daily stock charts, making them a natural fit for swing trading. However, the "best" settings depend on your typical holding period and the volatility of the instruments you trade.
Standard Settings (12, 26, 9) — Best for Most Swing Traders
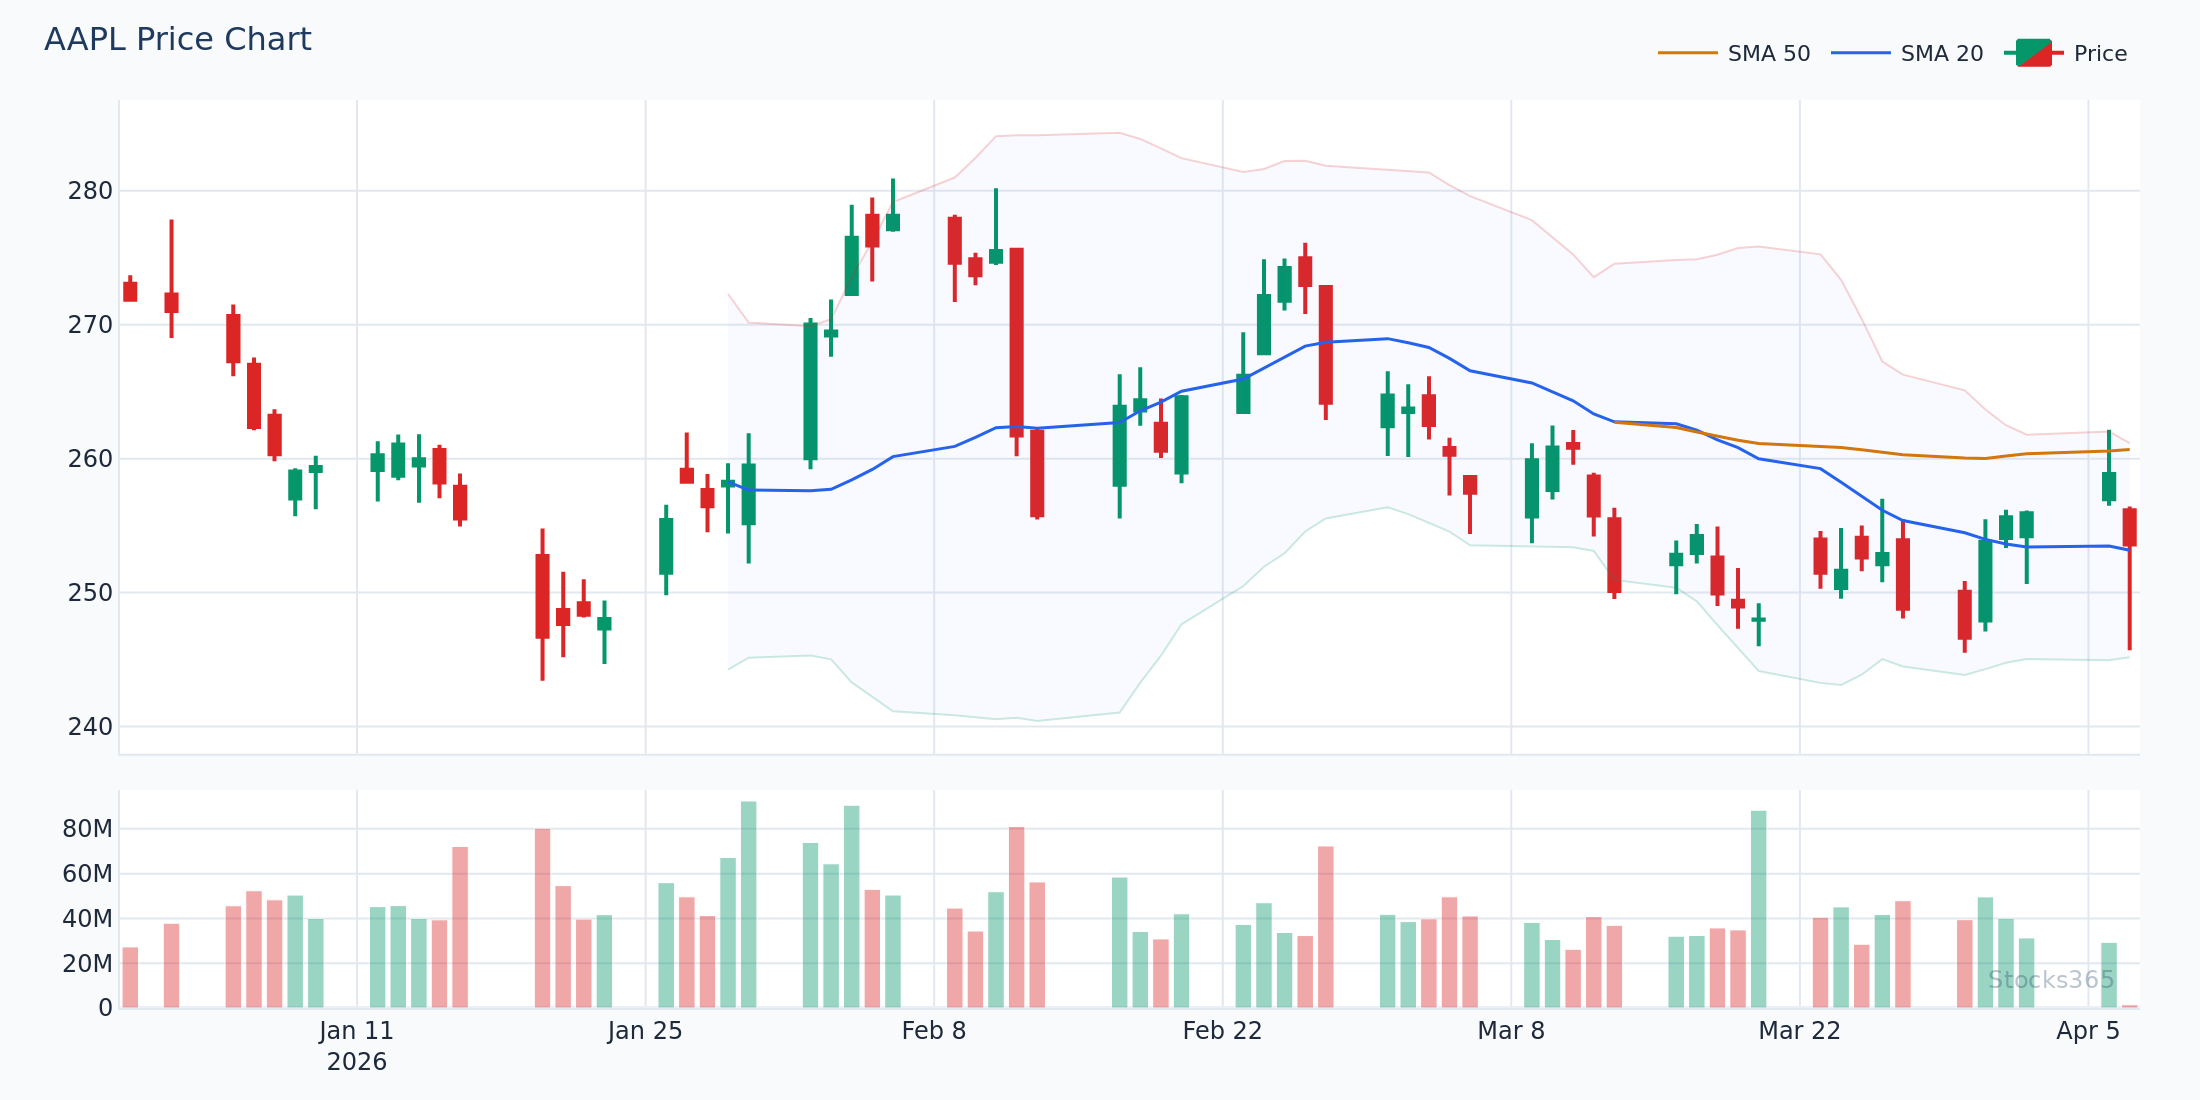
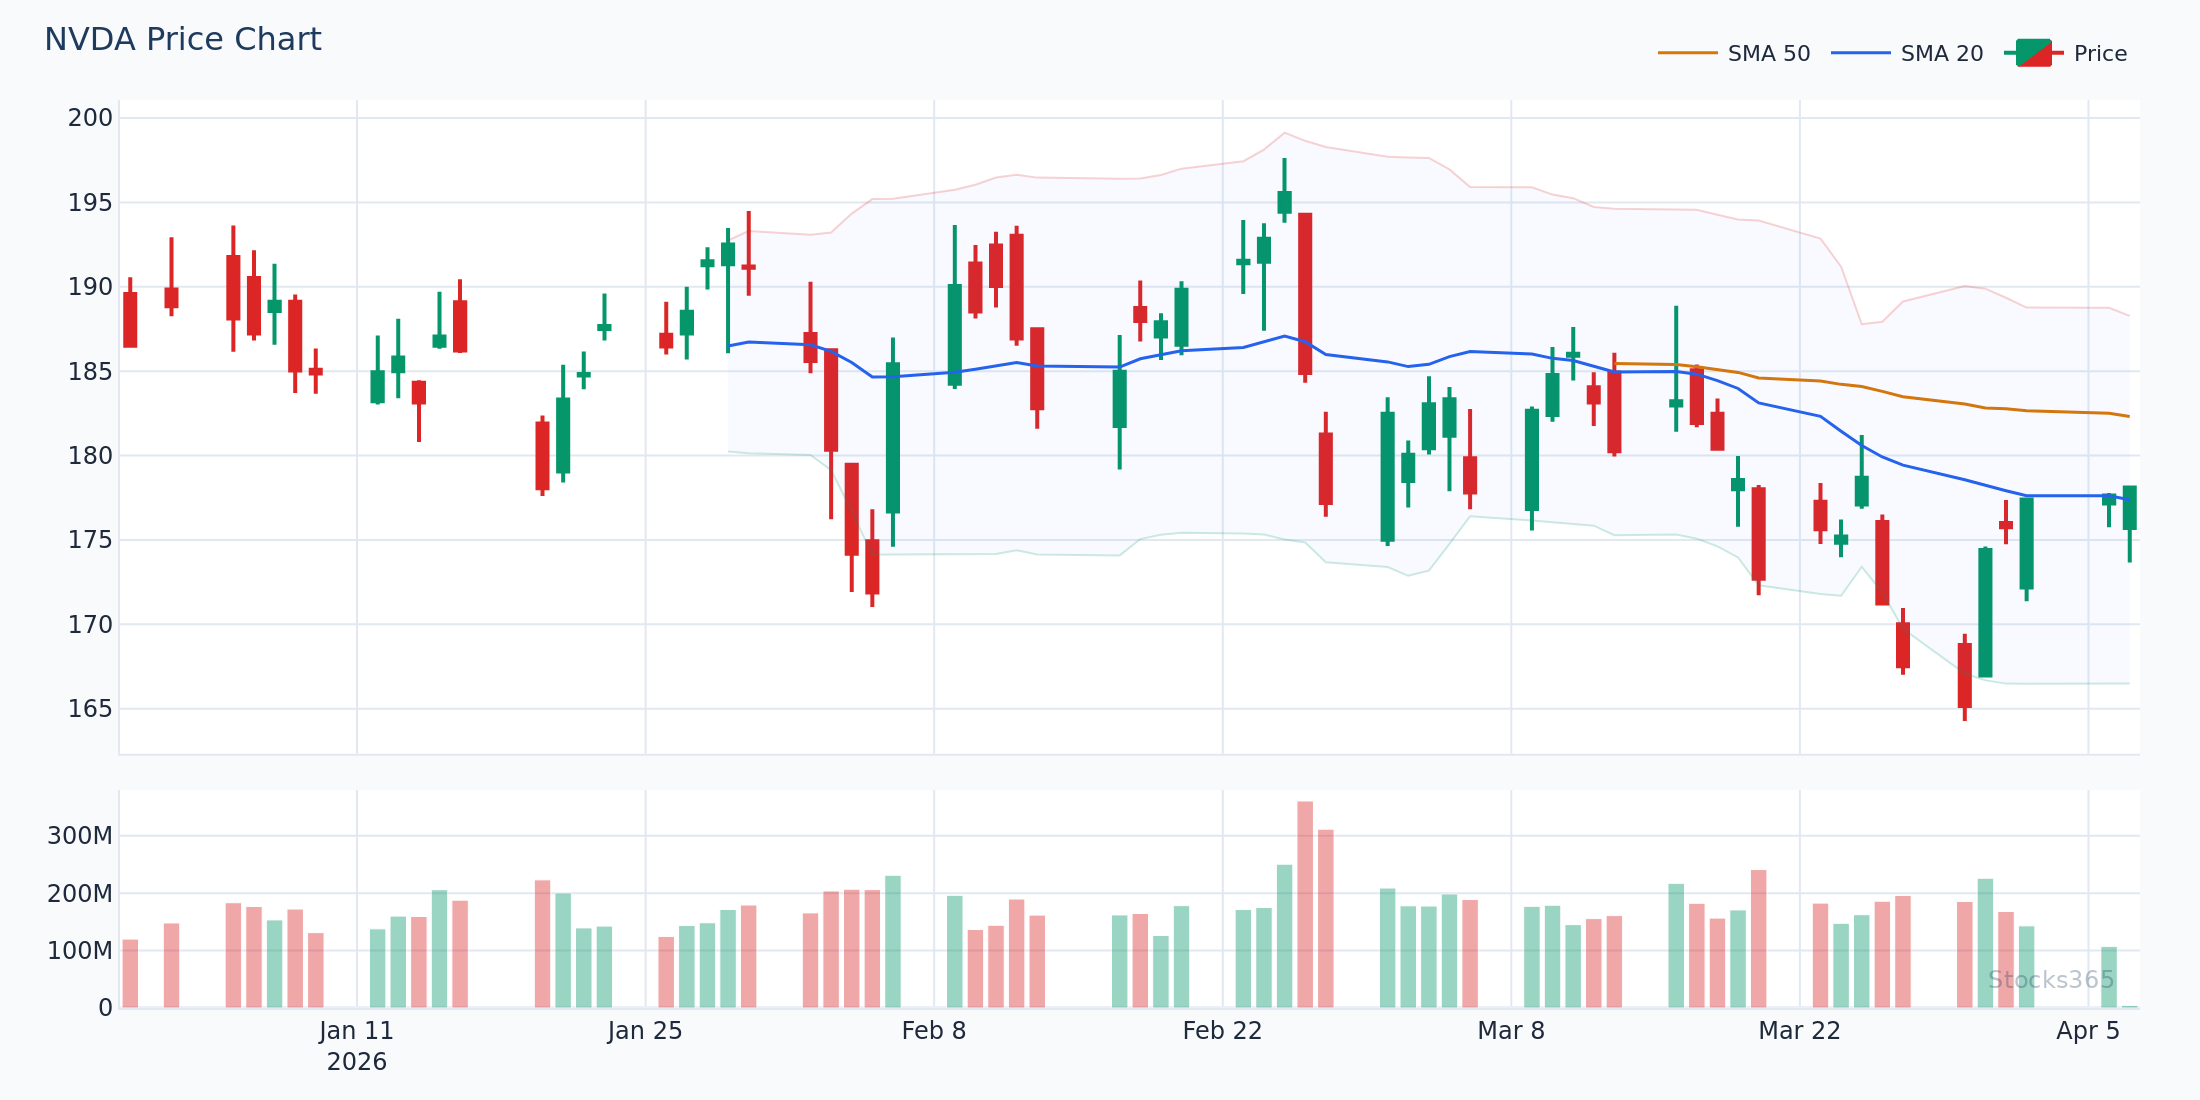
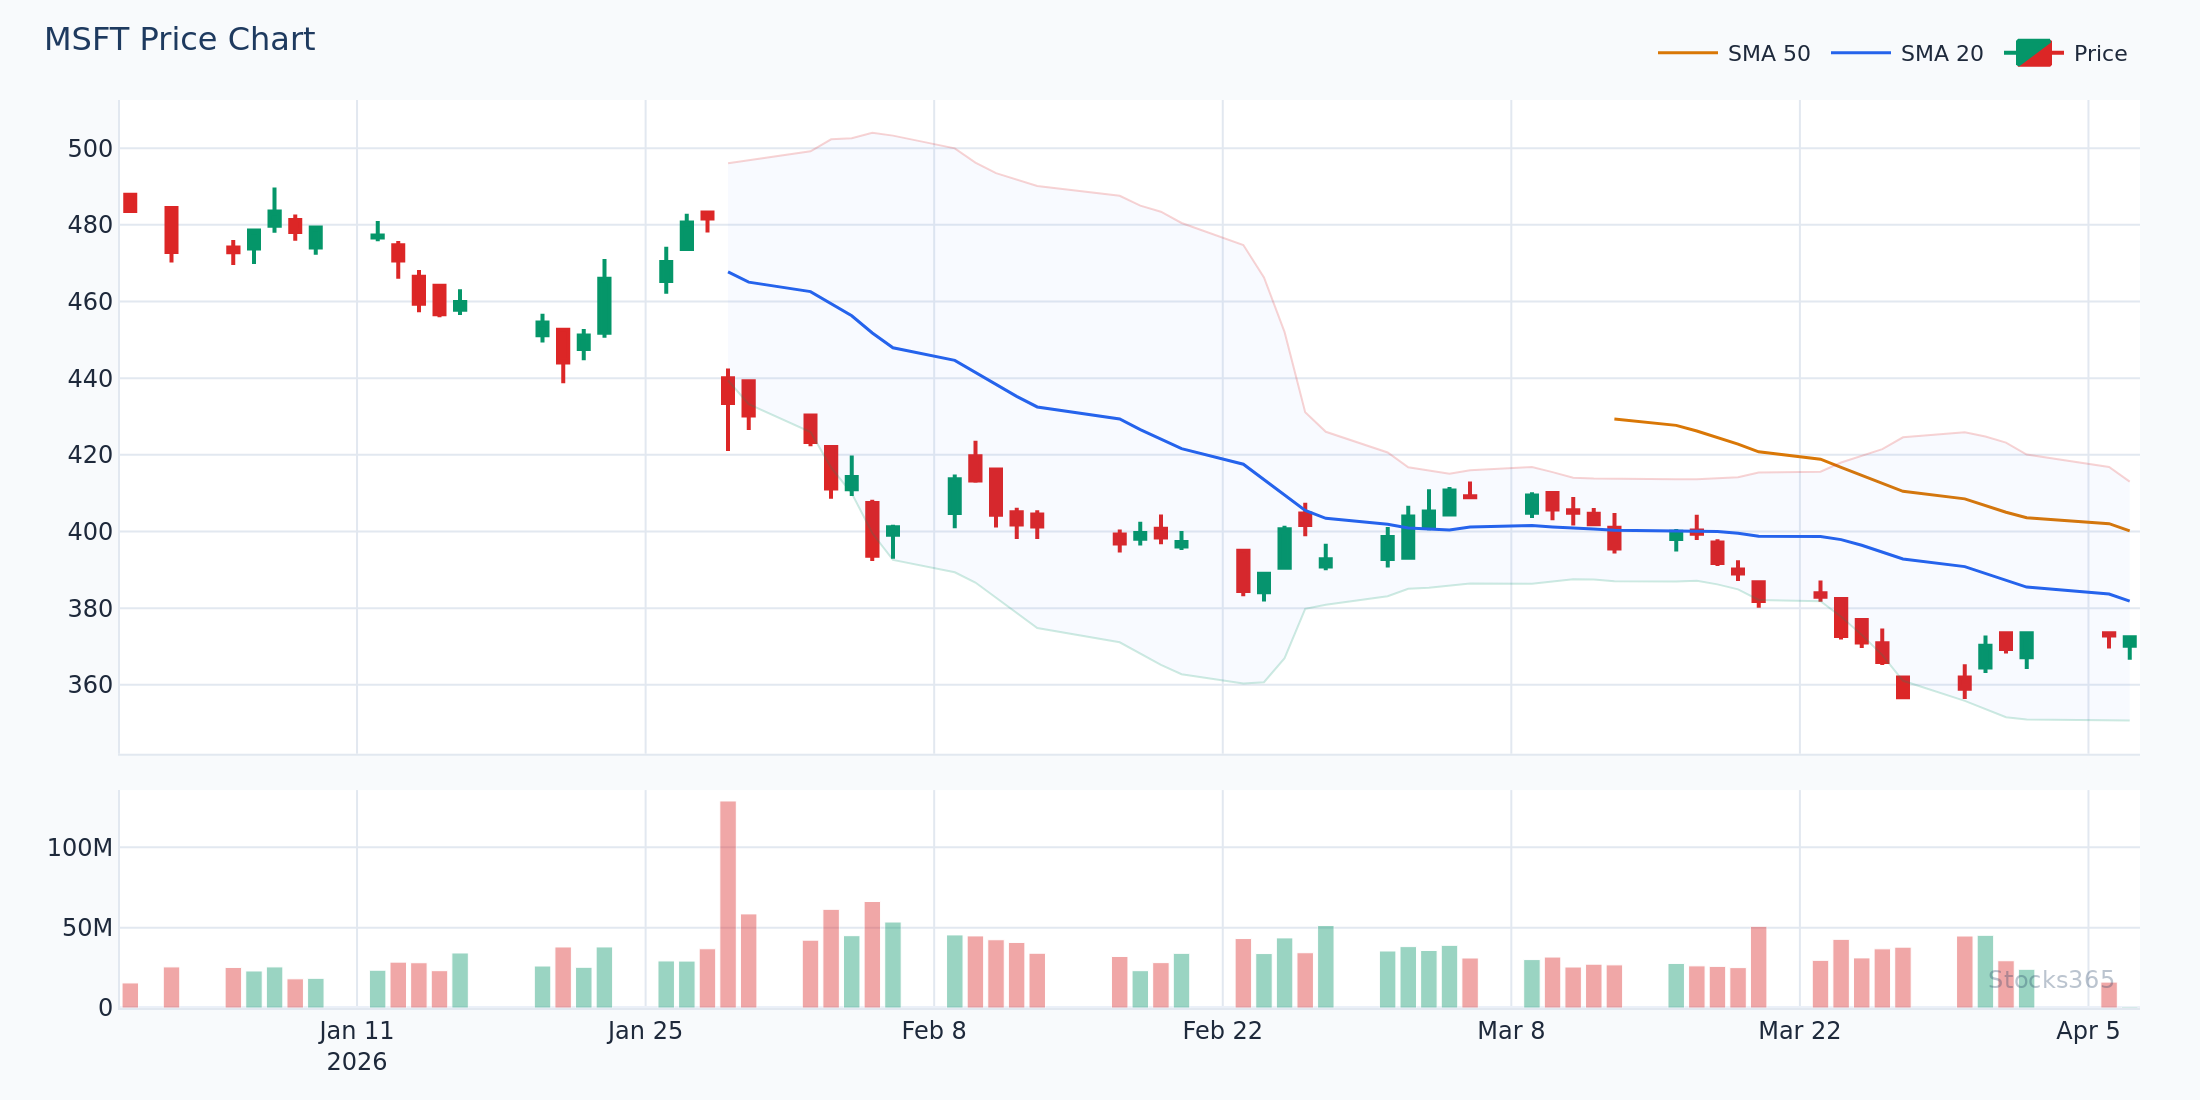
The classic configuration strikes an excellent balance between responsiveness and reliability. On daily charts, this setup produces approximately 3–6 actionable signals per month on a typical mid-cap stock — a cadence that suits most swing traders perfectly. If you're trading large-cap tech names like NVDA, AAPL, or MSFT, these settings are a reliable starting point.
Faster Settings (8, 21, 5) — For Volatile Stocks and Shorter Holds
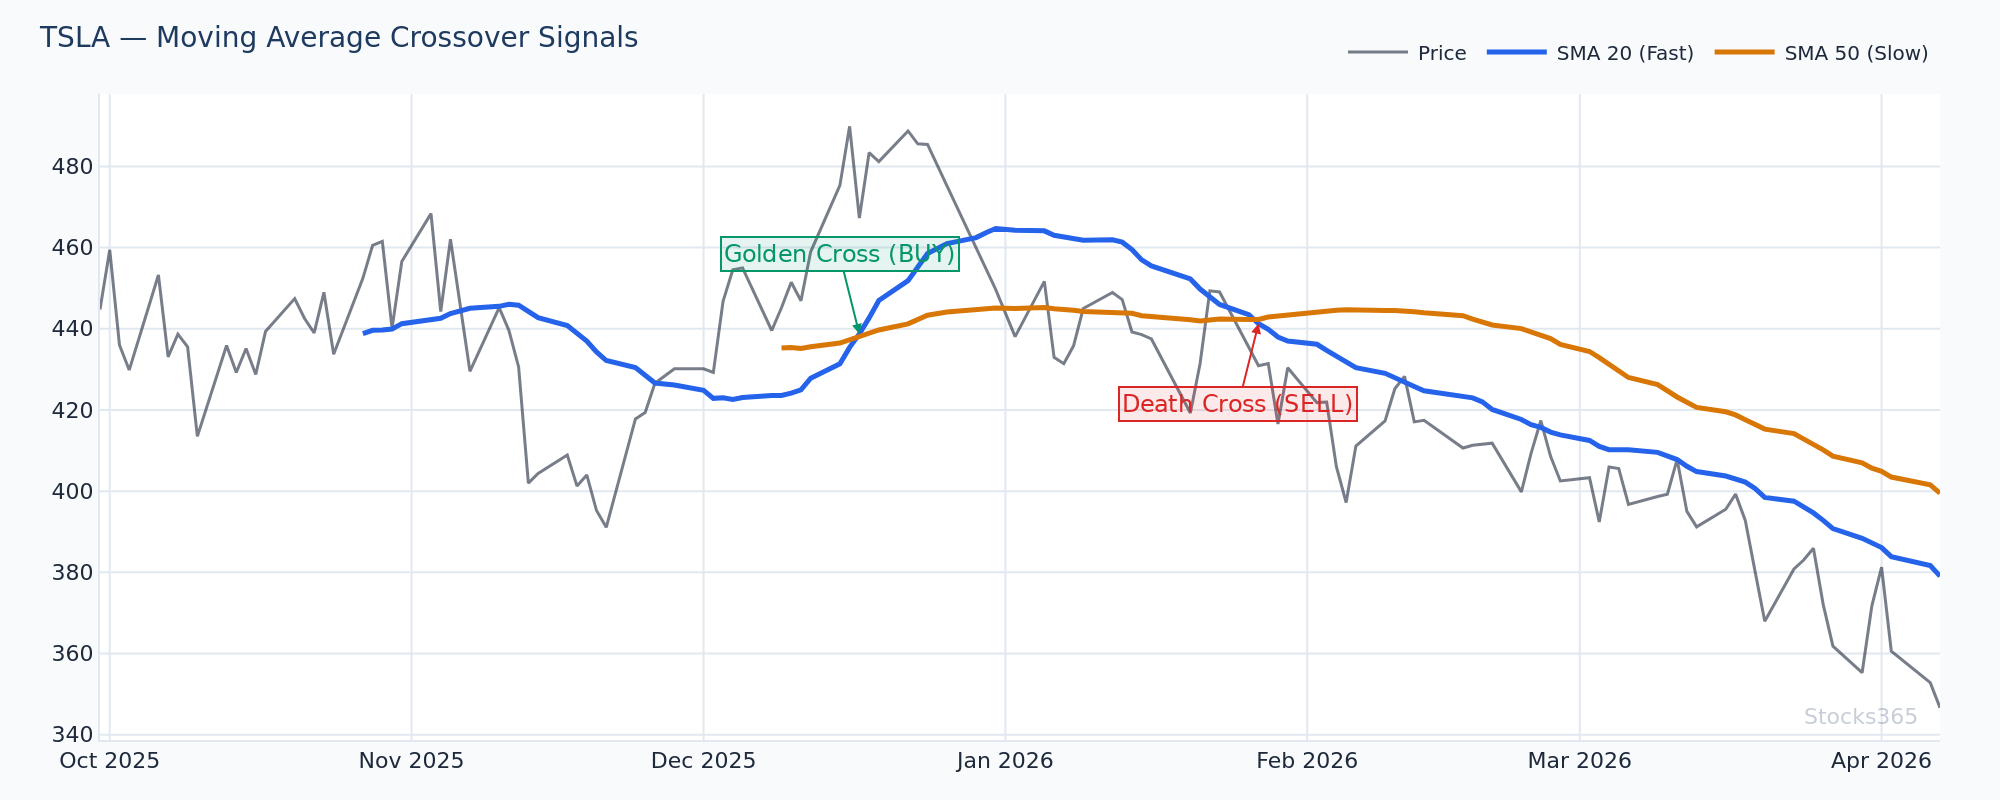
Swing traders targeting 2–5 day holds on high-beta names like TSLA may prefer the (8, 21, 5) configuration. The shorter periods make the MACD line more sensitive to recent price action, delivering earlier entries — though at the cost of more false signals. Use this setting when you want to enter trends earlier and are comfortable with tighter stop-losses.
Slower Settings (21, 50, 9) — For Weekly Swing Positions
Traders holding positions for 1–3 weeks and trading off weekly charts often prefer a slower MACD. The (21, 50, 9) configuration filters out much of the weekly chop and highlights only the most significant momentum shifts. Drawback: signals lag significantly, so your entry price may be less favorable by the time the MACD confirms.
Pro Tip: Always match your MACD settings to your timeframe and holding period. A setting that works brilliantly for a 3-week swing trade will generate whipsaws if applied to a 3-day trade on the same daily chart.
The Three Core MACD Swing Trading Signals
MACD generates swing trade signals in three distinct ways. Understanding each — and knowing which context each works best in — is the foundation of a reliable MACD swing trading strategy.
1. MACD Line Crossovers (The Classic Signal)
A bullish crossover occurs when the MACD line crosses above the signal line. A bearish crossover occurs when the MACD line drops below the signal line. These are the most commonly used MACD signals and work best when they occur while the indicator is below the zero line (for bullish) or above it (for bearish).
Example — NVDA Bullish Crossover: Imagine NVDA has pulled back from $950 to $870 over eight trading days, forming a clean retest of its 50-day moving average. The MACD line, which had been declining, now crosses above the signal line with both lines sitting at -4.2, below the zero line. This setup — a crossover beneath zero at a key support zone — is one of the highest-probability swing entries MACD produces. A trader entering at $873 with a stop at $855 and target at $930 captures a risk-reward ratio exceeding 3:1.
2. Zero Line Crosses (Trend Confirmation Signal)
When the MACD line itself crosses above or below the zero line, it signals that the shorter EMA has moved above (or below) the longer EMA — essentially confirming a change in intermediate trend direction. Zero line crosses are slower but more reliable than signal line crossovers, making them ideal for swing traders who prioritize accuracy over early entry.
Practical Application: When MSFT's MACD crosses above zero after a period of consolidation, it confirms that upward momentum is genuinely building — not just a brief bounce within a downtrend. This is your green light to enter swing longs with more confidence, particularly when the price is simultaneously breaking above a key resistance level like a 20-day or 50-day moving average.
3. Histogram Reversals (The Earliest Signal)
The histogram — the bars showing the gap between the MACD line and signal line — often reverses direction before the lines themselves cross. When the histogram bars are below zero but start growing smaller (less negative), momentum is shifting even before a crossover occurs. This gives swing traders an opportunity to position early.
Watch for three consecutive histogram bars moving in the same direction as your potential trade. For example, if AMZN's histogram shows three progressively smaller negative bars (e.g., -2.1, -1.4, -0.6), it suggests sellers are losing steam and a bullish crossover may be imminent — allowing entry ahead of the crowd.
MACD Divergence: The Swing Trader's Superpower
MACD divergence is perhaps the most powerful swing trading signal the indicator produces — and one of the most underutilized. Divergence occurs when price action and the MACD indicator move in opposite directions, signaling that the current trend is losing underlying momentum.
Bullish MACD Divergence
Price makes a lower low, but MACD makes a higher low. This tells you that downward momentum is weakening even as price continues to fall — a classic setup for a bullish swing reversal. This pattern often appears at the end of correction phases within otherwise healthy uptrends.
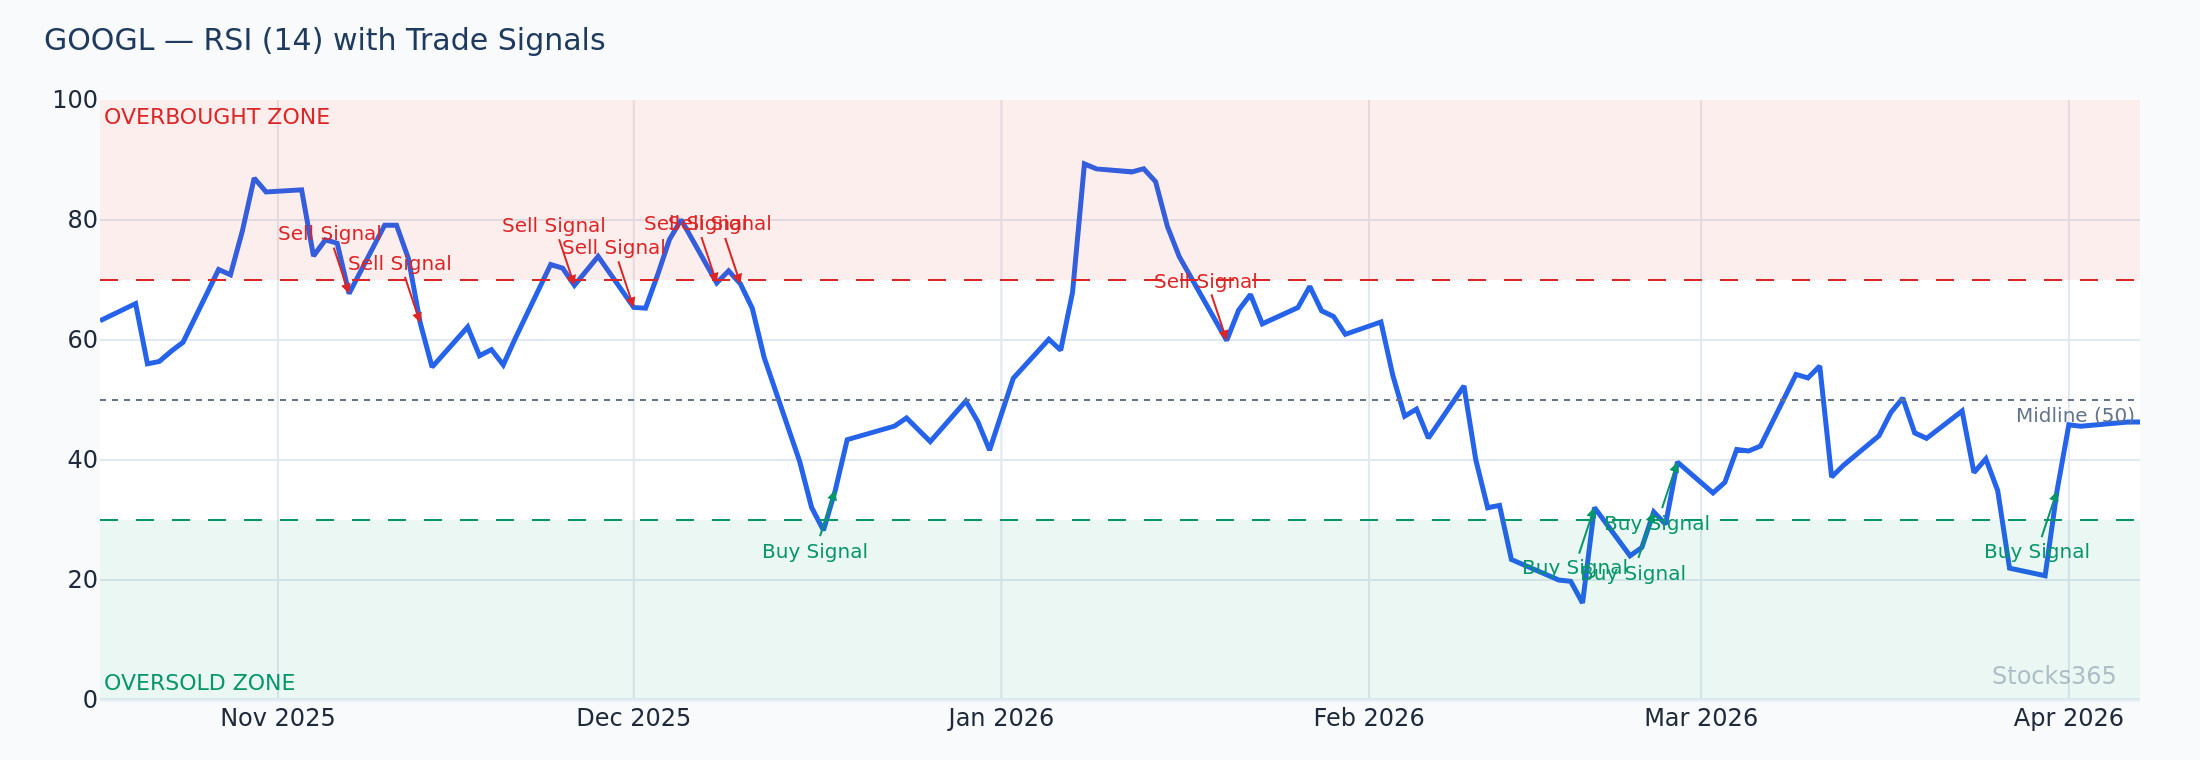
Trade Example: GOOGL drops from $195 to $178, then bounces to $186, then drops again to $175 (a lower low in price). However, MACD's second low registers at -3.1 compared to -4.8 during the first drop — a higher low on MACD. Combined with the price holding above a major support zone, this bullish divergence provides a compelling swing entry at $177 with a stop at $171 and a target back toward $192.
If you're already familiar with RSI divergence concepts, you'll find MACD divergence operates on similar logic. For a deeper understanding of divergence signals, our guide on RSI Divergence: Master Bullish & Bearish Signals covers the underlying principles that apply across oscillators. Advanced traders should also explore Hidden RSI Divergence: The Advanced Signal Most Traders Miss for continuation-style divergence setups that work equally well when applied to MACD.
Bearish MACD Divergence
Price makes a higher high while MACD makes a lower high. This signals that bullish momentum is fading even as price grinds higher — often seen near market tops or at resistance zones. Bearish MACD divergence is a strong signal to tighten stops on existing longs or to initiate short swing trades in bear market environments.
Combining MACD with RSI for Higher-Probability Swings
MACD alone is a capable tool, but combining it with the Relative Strength Index (RSI) creates a powerful confluence system that significantly reduces false signals. These two indicators complement each other naturally: MACD measures momentum direction and trend changes, while RSI measures the speed and magnitude of price movements relative to recent history.
If you're new to RSI, our Complete Beginner's Guide to RSI provides an excellent foundation. For those ready to go deeper, check out How to Use RSI in Trading: The Ultimate Step-by-Step Guide.
The MACD + RSI Confluence Strategy
The rules are straightforward:
- Bullish setup: MACD shows a bullish crossover OR bullish divergence AND RSI is below 50 (ideally near or below 40) and turning up
- Bearish setup: MACD shows a bearish crossover OR bearish divergence AND RSI is above 50 (ideally near or above 60) and turning down
- Avoid: Taking MACD crossover signals when RSI is already overbought (above 70) for longs or oversold (below 30) for shorts — these are late entries
Understanding RSI overbought and oversold levels is essential for filtering MACD signals correctly. Meanwhile, RSI settings — particularly whether you're using RSI(14) or a shorter period — affect how the two indicators interact on different timeframes.
Building a Complete MACD Swing Trading System
A signal is not a system. To trade MACD swing setups profitably over time, you need rules for entries, stops, targets, and position sizing. Here's a complete framework:
Step 1: Identify the Trend
Before looking at any MACD signal, determine the primary trend on the weekly chart. Only take MACD buy signals in stocks trending above their 20-week and 40-week moving averages (for longs), and only take MACD sell signals in stocks trending below these averages. Trading with the macro trend dramatically improves your MACD signal win rate.
Step 2: Wait for the MACD Setup
On the daily chart, wait for one of three setups: a bullish crossover below zero, bullish histogram reversal from oversold levels, or bullish MACD divergence at support. Confirm the setup with RSI below 50 and turning upward, and ideally with price at a recognizable support level (prior swing low, moving average, or key round number).
Step 3: Time the Entry
For bullish setups, look to enter on the next day's open after the MACD crossover is confirmed, or use a limit order 0.5–1% below the prior day's close to improve entry. For histogram reversals, enter when the third consecutive smaller bar appears. Never chase — if the stock has already moved 4–5% from where the MACD signal triggered, skip the trade.
Step 4: Set Your Stop and Target
- Stop loss: Place below the swing low that formed during the MACD setup, or below the support level you identified in step 2. Typically 2–4% below entry for swing trades.
- Target: Use the next significant resistance level, prior swing high, or a 2:1 to 3:1 risk-reward calculation from your stop distance.
- Trailing stop: Once the trade is up 50% of your target distance, trail your stop to breakeven. If MACD crosses bearish again, exit immediately.
Step 5: Use Stocks365 Trust Score to Filter Setups
Not all MACD signals are created equal. On the Stocks365 signals dashboard, each signal comes with a Trust Score that aggregates technical, fundamental, and sentiment factors to rank signal quality. Prioritize MACD swing setups with a Trust Score above 70 — these have demonstrated statistically higher follow-through rates. You can explore individual signals like the AAPL signal page to see how current MACD conditions align with broader confluence factors in real time.
Common MACD Swing Trading Mistakes to Avoid
Even experienced traders fall into predictable MACD traps. Knowing these pitfalls protects your capital:
- Trading every crossover: MACD crossovers in choppy, low-trend markets produce a stream of whipsaws. Only trade crossovers when ADX is above 20 or when there's a clear directional trend visible on the chart.
- Ignoring the zero line location: A bullish crossover above the zero line is a continuation signal in an uptrend — lower probability than a crossover below zero after a healthy pullback. Know the difference.
- Using MACD in isolation: MACD without volume confirmation, RSI context, or price structure analysis leads to poor entries. Always use confluence. Comparing tools like RSI vs Stochastic helps you understand why multi-indicator confirmation outperforms single-indicator trading.
- Over-optimizing settings: Curve-fitting MACD settings to historical data is a classic trap. The standard (12, 26, 9) settings work because thousands of traders watch them — creating self-fulfilling momentum.
- Neglecting risk management: A 60% win rate with 1:1 risk-reward barely breaks even after commissions. Ensure your MACD swing trades target at least 2:1 risk-reward.
MACD Swing Trading Across Different Market Conditions
MACD performs differently depending on overall market environment. Adapting your approach to conditions is what separates sophisticated swing traders from mechanical system followers.
Bull Market Conditions
In strong uptrending markets, MACD pullback signals near zero — where price dips to a moving average and MACD resets toward zero before resuming higher — offer the highest win rate. Focus on dip-buying MACD recoveries in leading sectors. RSI pullbacks to 40–50 combined with MACD bottoming provide excellent confirmation; understanding how RSI is calculated helps you interpret these readings with greater precision.
Bear Market Conditions
In downtrending markets, prioritize short-side MACD signals: bearish crossovers above zero, bearish divergence at resistance, and histogram reversals from elevated levels. Be more conservative with position sizing and tighten profit targets, as bear market bounces tend to be sharp and short-lived.
Choppy / Sideways Markets
This is where MACD struggles most. In low-trend environments, reduce position size by 50%, avoid zero-line crossover signals entirely, and focus exclusively on strong MACD divergence at the extremes of the trading range. Alternatively, sit on the sidelines and wait for trend conditions to return.
Frequently Asked Questions
What are the best MACD settings for swing trading on daily charts?
The standard (12, 26, 9) settings are the most widely used and work well for daily chart swing trading with typical 5–15 day holding periods. If you prefer earlier entries and trade more volatile stocks, consider (8, 21, 5). For longer 2–4 week swings using weekly charts, (21, 50, 9) filters more noise. Avoid over-optimizing settings — widely followed settings create the shared reference points that make MACD signals self-reinforcing.
How reliable is MACD for swing trading compared to other indicators?
MACD is a solid swing trading indicator but performs best when combined with other tools. Standalone MACD crossover signals have win rates of roughly 45–55% depending on market conditions — good, but not exceptional. When combined with RSI confirmation, trend filters, and support/resistance analysis, win rates can improve to 60–70% on high-quality setups. No single indicator is reliably profitable in isolation, which is why the Stocks365 Trust Score aggregates multiple factors to rank signal quality.
What is MACD divergence and is it useful for swing trading?
MACD divergence occurs when price action and the MACD indicator move in opposite directions. Bullish divergence (price makes lower lows while MACD makes higher lows) signals weakening downward momentum and often precedes bullish reversals. Bearish divergence signals the opposite. For swing traders, MACD divergence is particularly valuable because it often appears 2–5 days before a trend reversal becomes obvious on price charts, allowing earlier entries with better risk-reward ratios.
Should I use MACD on a 4-hour chart or daily chart for swing trading?
Daily charts are the primary timeframe for most MACD swing traders. They filter intraday noise while capturing meaningful multi-day momentum shifts. The 4-hour chart works as a secondary timeframe to refine entry timing — once the daily chart MACD signals a setup, drop to the 4-hour chart to find a precise entry during a minor pullback or consolidation. Using the 4-hour chart as your primary swing trading timeframe generates too many signals and can lead to overtrading.
Can I use MACD alone to swing trade profitably?
While some traders do use MACD as their primary indicator, using it in complete isolation is not recommended. MACD performs poorly in choppy, sideways markets and can produce multiple false crossovers before a trend establishes. At minimum, confirm MACD signals with the broader trend direction (via a 50-day or 200-day moving average), volume analysis, and one complementary momentum indicator like RSI. The combination of MACD trend signals with RSI momentum readings is one of the most time-tested approaches in swing trading.