
Who Invented the MACD Indicator? The Complete History
If you've spent any time in technical analysis, you've almost certainly encountered the MACD indicator — the Moving Average Convergence Divergence oscillator that sits at the bottom of millions of trading charts worldwide. But who invented MACD, and how did a tool developed over four decades ago become an indispensable fixture of modern trading platforms in 2026? The story behind this indicator is one of the most compelling in the history of technical analysis.
Understanding the origins of MACD doesn't just satisfy intellectual curiosity — it gives you deeper insight into why the indicator works the way it does, how to interpret its signals more accurately, and how to combine it with complementary tools like RSI for a truly robust trading strategy.
Gerald Appel: The Man Who Invented the MACD Indicator
The answer to who invented the MACD indicator is Gerald Appel, a New York-based financial analyst, portfolio manager, and author who developed the concept in the late 1970s. Appel was the founder of Signalert Corporation, an investment advisory firm, and he introduced the MACD as a tool for identifying changes in the strength, direction, momentum, and duration of a trend in a stock's price.
Appel's original formulation was remarkably elegant. He observed that the relationship between two exponential moving averages — specifically a 12-period and a 26-period EMA — could reveal meaningful shifts in market momentum before they became obvious on the price chart itself. By subtracting the longer EMA from the shorter one, he created a single oscillating line that crossed above and below zero as momentum shifted between bullish and bearish territory.
"The MACD is probably the most popular indicator in technical analysis for a very good reason — it works. It was designed to reveal changes in the strength, direction, momentum, and duration of a trend." — Gerald Appel
What made Appel's contribution so significant wasn't just the formula itself — it was the conceptual leap he made in combining trend-following (via moving averages) with momentum measurement (via the divergence between those averages). This dual nature is why the MACD remains relevant decades after its creation.
Appel's Background and Motivation
Gerald Appel came from a background that blended financial analysis with a deep interest in quantitative methods. Operating in an era before personal computers made backtesting trivial, Appel had to verify his ideas largely through manual calculation — a fact that underscores the intellectual rigor behind MACD's design. He wasn't chasing computational complexity; he was solving a practical problem: how do you identify when a trend is genuinely gaining or losing momentum, not just oscillating randomly?
His solution — measuring the convergence and divergence of two EMAs — proved so robust that it required almost no modification to remain useful across wildly different market environments, from the analog tape-ticker era of the late 1970s to the AI-augmented trading platforms of 2026.
The Evolution of MACD: From Two Lines to Three Components
The original MACD as Appel conceived it consisted of just two lines: the MACD line itself (the 12-26 EMA differential) and what he called the signal line — a 9-period EMA of the MACD line. Crossovers between these two lines generated buy and sell signals.
The third component that most traders know today — the MACD histogram — was a later addition. Thomas Aspray, another technical analyst, introduced the histogram in 1986. Aspray found that the lag inherent in waiting for crossovers was a significant disadvantage, particularly in fast-moving markets. By plotting the difference between the MACD line and the signal line as a histogram, he made it possible to anticipate crossovers before they occurred, dramatically improving the timing of trade entries and exits.
The Standard MACD Parameters: Why 12, 26, and 9?
One of the most common questions traders ask after learning who invented the MACD indicator is: why did Appel choose 12 periods, 26 periods, and 9 periods specifically? The answer reflects the trading environment of the late 1970s.
- 26 periods represented approximately one trading month (six weeks of five trading days), capturing medium-term trend behavior
- 12 periods represented approximately half a trading month, providing a faster-reacting average to compare against
- 9 periods for the signal line was chosen as a smoothing mechanism that balanced responsiveness with noise reduction
These parameters were calibrated for daily charts in equity markets. They've remained the default settings across virtually every trading platform because they represent a time-tested balance — though modern traders frequently adjust them based on their specific asset class, timeframe, and trading style.
How MACD Works: The Mechanics Behind the Invention
To truly appreciate what Gerald Appel created, it helps to understand the mechanical logic embedded in the MACD formula:
- MACD Line = 12-period EMA − 26-period EMA
- Signal Line = 9-period EMA of the MACD Line
- Histogram = MACD Line − Signal Line
When the 12-period EMA is rising faster than the 26-period EMA, the MACD line climbs above zero — indicating bullish momentum. When the shorter EMA falls below the longer one, MACD drops below zero, signaling bearish pressure. The genius of the design is that it quantifies something traders were doing intuitively: comparing near-term price behavior against medium-term price behavior.
A Practical Trading Example
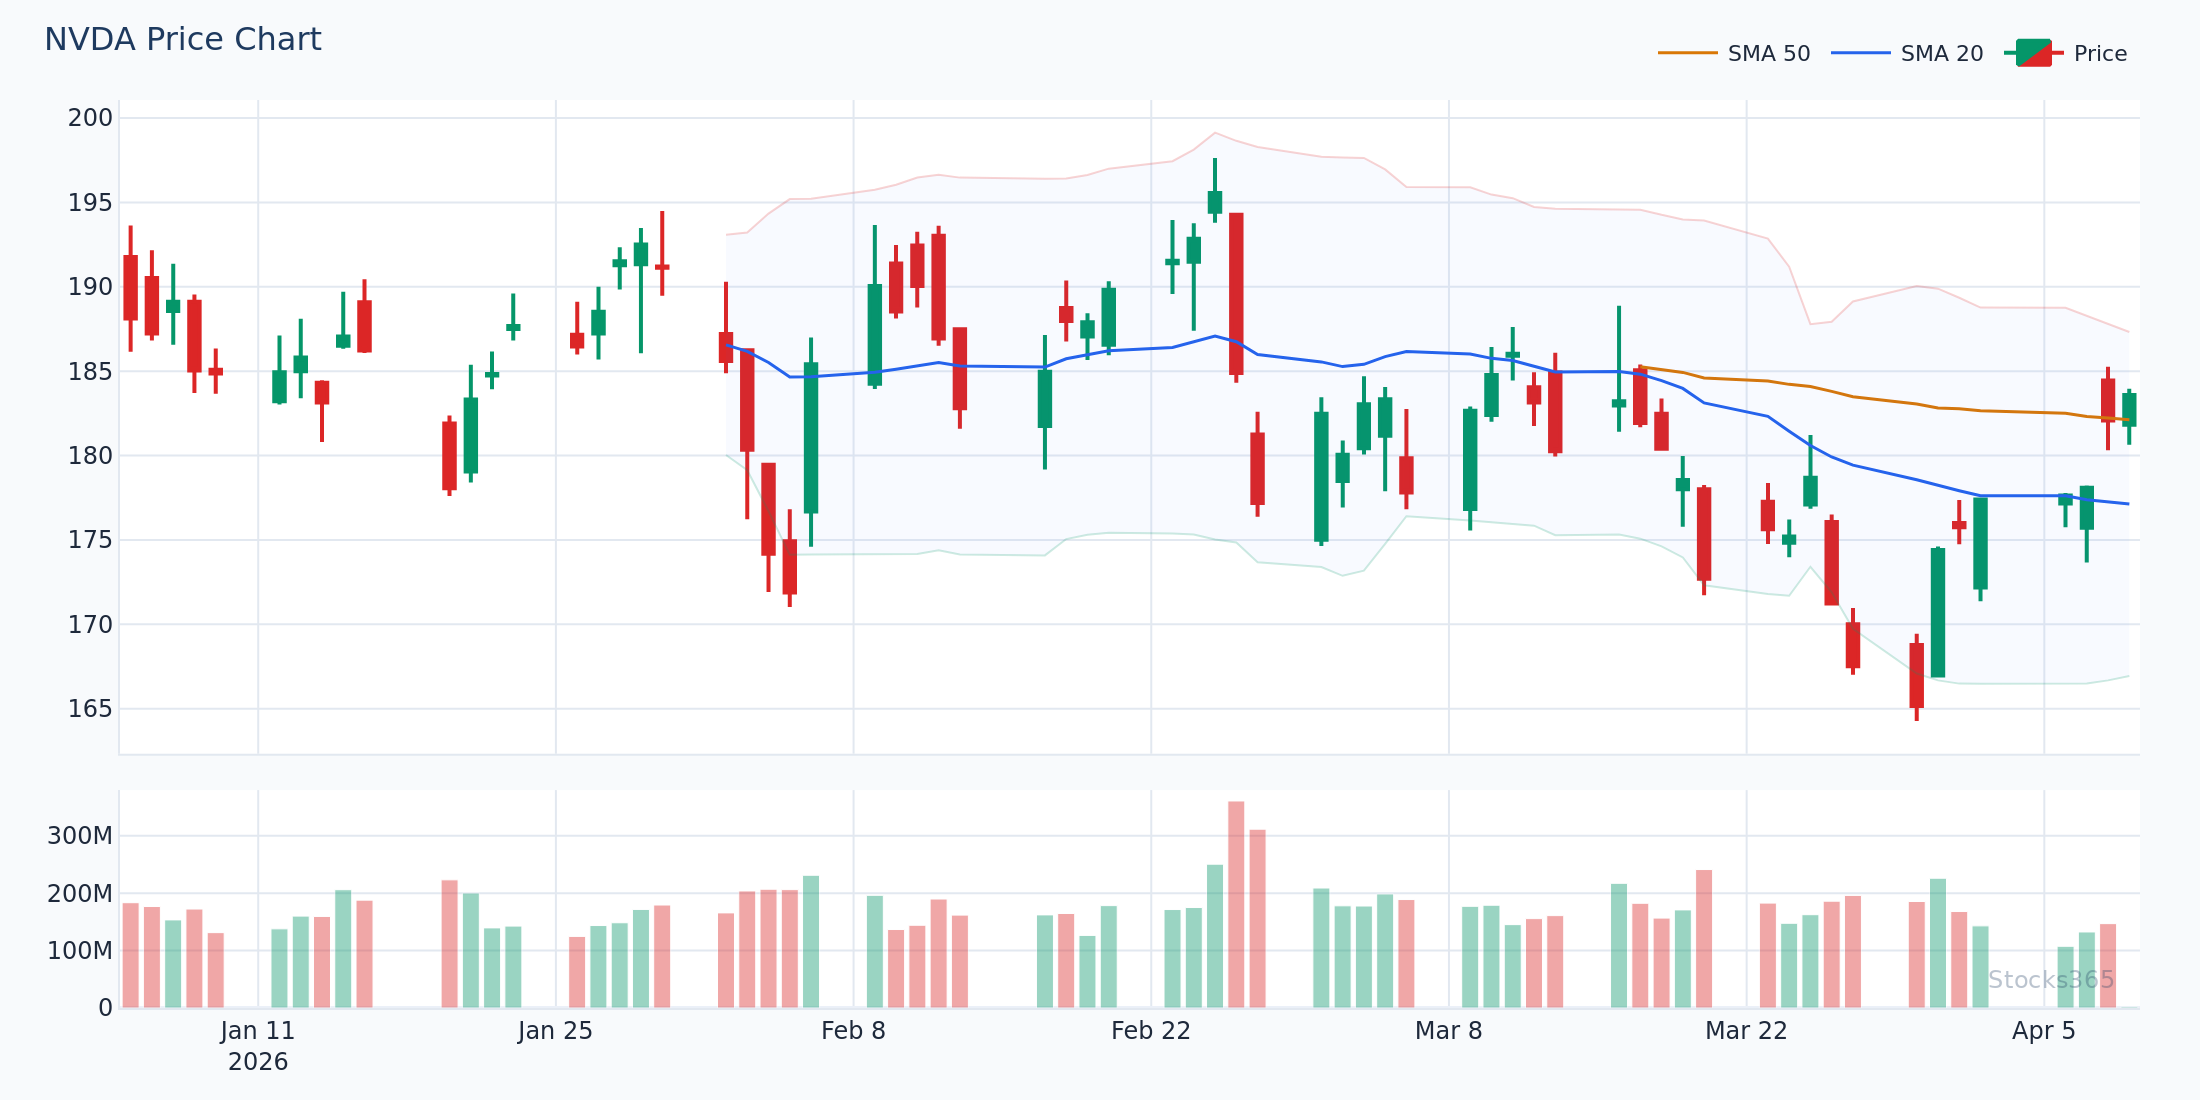
Consider a hypothetical scenario with NVDA trading at $142.50 in early 2026. Suppose the 12-period EMA sits at $144.20 while the 26-period EMA is at $139.80. The MACD line would read +$4.40 — solidly positive, indicating upward momentum. If the 9-period signal line of the MACD is at +$3.10, the histogram shows +$1.30, suggesting the bullish momentum is still accelerating. A trader using Stocks365's trust score system in this environment might see a high-confidence bullish signal validated by multiple technical factors, including MACD histogram expansion.
Now suppose NVDA pulls back to $138.00. The 12-period EMA might fall to $139.50, while the 26-period EMA remains elevated at $140.80. MACD drops to −$1.30. If the signal line is still at +$0.80, the histogram shows −$2.10 — a sharp bearish shift that would alert momentum traders to reassess their positions well before a traditional moving average crossover on the price chart would signal danger.
MACD in the Context of Technical Analysis History
To fully understand who invented MACD and why it mattered, it's worth placing Appel's innovation within the broader timeline of technical analysis development.
The Technical Analysis Landscape of the 1970s
When Appel was developing the MACD, the technical analysis toolkit was already populated with significant tools. Charles Dow had laid the conceptual groundwork with Dow Theory in the early 20th century. Moving averages had been in use for decades. But the late 1970s saw an explosion of new momentum-based indicators that fundamentally expanded what technical analysts could measure.
J. Welles Wilder Jr. published his landmark book New Concepts in Technical Trading Systems in 1978 — the same general period when Appel was refining MACD — introducing the Relative Strength Index (RSI), Average True Range (ATR), and the Parabolic SAR. George Lane had developed the Stochastic Oscillator in the 1950s, though it gained broader adoption in the 1970s and 1980s.
This era represents a kind of golden age of indicator invention — a period when systematic, quantitative approaches to market analysis were being codified for the first time at scale. MACD emerged from this environment as one of the most balanced and practical contributions of the decade.
How MACD Compares to Its Contemporaries
Understanding who invented MACD also illuminates how it differs philosophically from other indicators of its era. While RSI measures momentum relative to recent price changes on a fixed scale of 0 to 100 — making it excellent for identifying overbought and oversold conditions — MACD is unbounded and focuses specifically on the relationship between two trend measurements. This makes MACD particularly effective for identifying trend direction and momentum shifts rather than absolute extremes.
Similarly, while the Stochastic Oscillator compares a closing price to its price range over a given period, MACD compares the speed of two trend-following averages. Each approach captures something distinct about market behavior — which is precisely why combining multiple indicators, rather than relying on any single one, produces more reliable signals.
Gerald Appel's Published Works and Legacy
Appel didn't just invent the MACD and move on — he spent decades refining, explaining, and evangelizing his creation through a series of influential publications. His books include:
- Technical Analysis: Power Tools for Active Investors (2005) — widely considered the definitive guide to MACD as Appel himself conceived it
- Beating the Market, 3 Months at a Time — a practical application of his momentum-based thinking
- Numerous newsletters and advisory publications through Signalert Corporation spanning the 1970s through the 2000s
In Technical Analysis: Power Tools for Active Investors, Appel revealed something that surprises many traders: he actually advocated for asymmetric MACD settings depending on whether you were looking for buy signals or sell signals. He suggested different EMA combinations for bullish and bearish market environments — a nuance that most modern platform implementations (which default to the standard 12-26-9 settings) overlook entirely.
MACD in Modern Trading: Relevance in 2026
Nearly five decades after Gerald Appel first published the MACD concept, the indicator remains embedded in the standard toolkit of professional and retail traders alike. Its persistence isn't merely institutional inertia — it reflects genuine, enduring utility.
Why MACD Still Works in Today's Markets
Modern markets in 2026 are dramatically faster, more liquid, and more algorithmically driven than anything Appel could have anticipated. High-frequency trading firms execute millions of orders per second. Machine learning models digest alternative data sources in real time. Yet MACD continues to generate actionable signals for a straightforward reason: it captures a fundamental truth about price behavior — that momentum precedes price, and that the relationship between near-term and medium-term momentum contains predictive information.
Algorithmic traders frequently incorporate MACD crossovers and divergences into their signal generation models precisely because the indicator is so widely used. When large numbers of market participants watch the same signals, those signals develop a degree of self-fulfilling validity — MACD bullish crossovers attract buying interest partly because sophisticated traders know retail traders will buy on those crossovers.
Combining MACD with Modern Signal Intelligence
Platforms like Stocks365 integrate MACD signals within broader trust score frameworks that weigh multiple technical and fundamental factors simultaneously. Rather than acting on any single MACD crossover in isolation, traders using the Stocks365 signals dashboard can see how MACD readings align with RSI readings, volume analysis, and fundamental catalysts — creating a more complete picture than any single indicator provides.
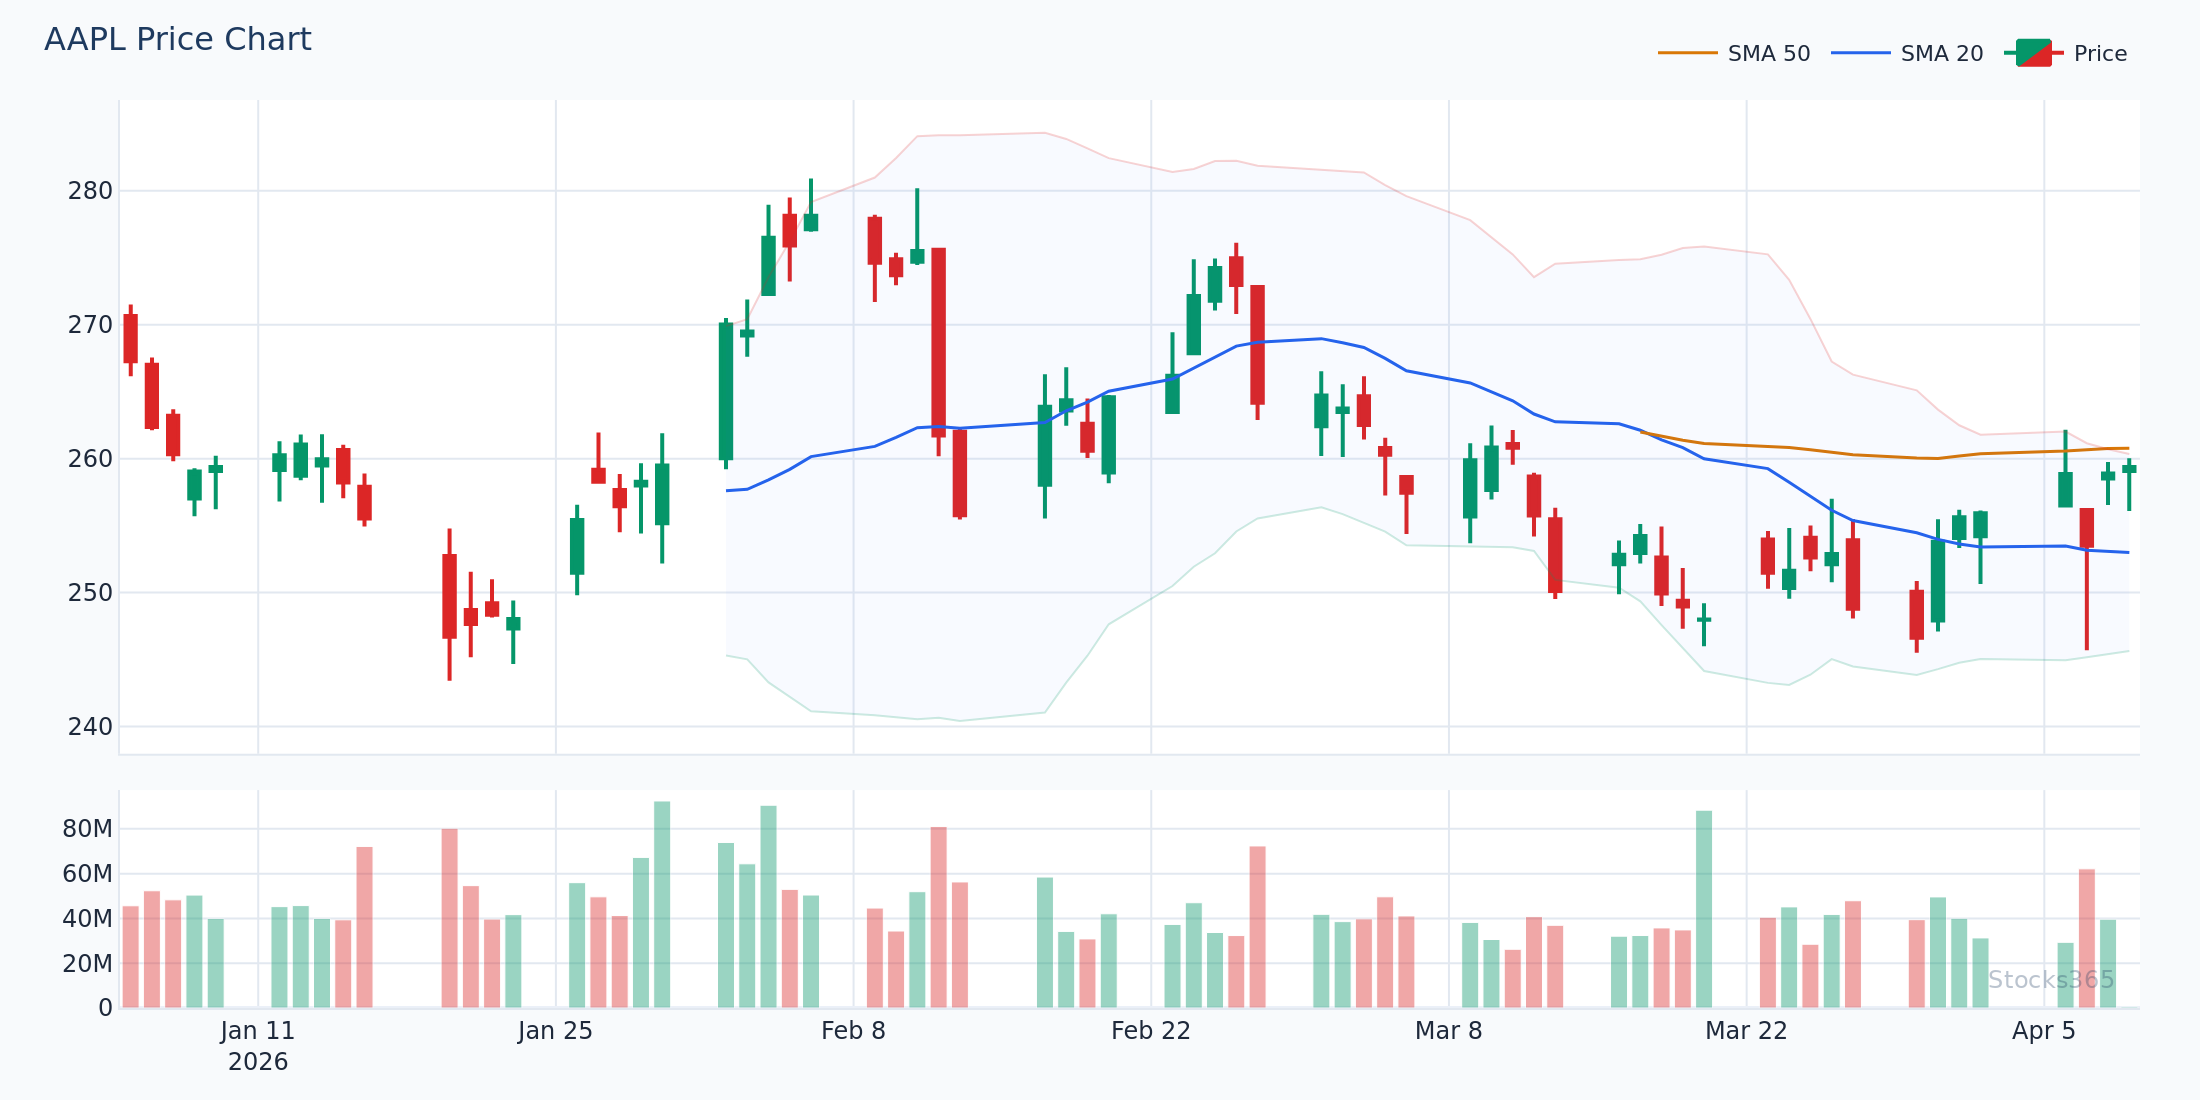
For example, a MACD bullish crossover on AAPL carries significantly more weight when it's accompanied by RSI emerging from oversold territory, above-average volume on bullish candles, and a positive Stocks365 trust score rating. Conversely, a MACD crossover that contradicts other technical signals might warrant caution regardless of how clean the setup appears in isolation.
This multi-indicator approach is entirely consistent with how Appel himself thought about trading — he never suggested MACD should be used in isolation, and his own trading incorporated multiple confirmatory signals.
MACD Divergence: One of Appel's Most Powerful Concepts
Among the most valuable concepts Appel developed alongside the basic MACD mechanics is the idea of divergence — when price makes a new high or low that is not confirmed by the MACD indicator. This concept parallels similar analysis possible with RSI, as explored in depth in our guide to RSI divergence signals and the more advanced concept of hidden RSI divergence.
MACD divergence remains one of the highest-probability technical setups available to traders in 2026. When AAPL, for instance, makes a fresh price high while the MACD histogram prints a lower peak than it did at the previous high, that bearish divergence warns that the upward move is occurring on weakening momentum — often a precursor to a reversal or at minimum a consolidation period.
📊 Key Takeaways
- Gerald Appel invented the MACD indicator in the late 1970s while running his investment advisory firm, Signalert Corporation
- The original MACD consisted of just two lines — the MACD line (12-period EMA minus 26-period EMA) and a 9-period signal line
- Thomas Aspray added the MACD histogram in 1986, improving signal timing by visualizing the gap between the MACD and signal lines
- The standard 12-26-9 parameters were calibrated for daily equity charts in the 1970s and remain the default on virtually every modern platform
- MACD was developed alongside other landmark indicators including Wilder's RSI, making the late 1970s a golden era for technical analysis innovation
- Appel himself advocated for asymmetric settings depending on market direction — a nuance most traders overlook
- MACD remains highly relevant in 2026 because it captures a fundamental truth: momentum precedes price
- Combining MACD with complementary tools like RSI and multi-factor signal platforms produces more reliable trading signals
Learning MACD Within a Broader Technical Framework
If you're new to MACD, understanding its origins gives you important context for interpreting its signals correctly. But no indicator exists in isolation. The most effective technical analysts treat MACD as one component of a coherent analytical framework that includes momentum oscillators, volume analysis, and price pattern recognition.
For traders building that framework, developing fluency with RSI alongside MACD is particularly valuable. Our comprehensive guides cover everything from how RSI is calculated to practical RSI trading strategies and optimizing RSI settings for your specific strategy. Understanding both indicators deeply — their origins, their mechanics, and their limitations — is the foundation of sophisticated technical analysis.
Gerald Appel gave traders an extraordinary gift when he developed the MACD indicator. Nearly five decades later, that gift continues to generate profits for traders who understand not just what the indicator shows, but why it was designed to show it that way.
Frequently Asked Questions
Who invented the MACD indicator and when?
The MACD indicator was invented by Gerald Appel, a New York-based financial analyst and portfolio manager, in the late 1970s. Appel developed it while running Signalert Corporation, his investment advisory firm. He published and refined the concept through various newsletters and later in his book Technical Analysis: Power Tools for Active Investors (2005).
What does MACD stand for and what does it measure?
MACD stands for Moving Average Convergence Divergence. It measures the relationship between two exponential moving averages — specifically a 12-period EMA and a 26-period EMA — to identify shifts in momentum, trend direction, and trend strength. When the shorter EMA diverges upward from the longer EMA, it signals accelerating bullish momentum, and vice versa for bearish momentum.
Who added the MACD histogram, and why does it matter?
Thomas Aspray added the MACD histogram in 1986, approximately a decade after Appel's original invention. The histogram plots the difference between the MACD line and the signal line as bars, making it possible to see momentum shifts and anticipate crossovers before they occur. This significantly reduces the lag inherent in waiting for actual line crossovers, improving trade entry and exit timing.
Why does MACD use 12, 26, and 9 as its default settings?
Appel chose these parameters based on the trading calendars of the late 1970s equity markets. The 26-period EMA approximated one trading month, the 12-period EMA approximated half a trading month, and the 9-period signal line provided a smooth but responsive average of the MACD line. These settings have remained the default because they represent a well-tested balance between responsiveness and noise reduction, though many traders adjust them based on their specific timeframe and asset class.
Is MACD still relevant for trading in 2026?
Absolutely. MACD remains one of the most widely used technical indicators in 2026 precisely because it captures a durable principle: momentum shifts tend to precede price shifts, and the relationship between near-term and medium-term momentum contains genuinely predictive information. Modern trading platforms, including Stocks365, incorporate MACD readings within broader multi-factor signal frameworks, enhancing its reliability beyond what the indicator alone can provide. Its widespread adoption also creates a degree of self-reinforcing validity — when large numbers of traders watch the same MACD signals, those signals influence actual market behavior.