
MACD Limitations: Why This Popular Indicator Isn't Always Your Best Tool
The Moving Average Convergence Divergence indicator — better known as MACD — is one of the most widely used technical analysis tools in trading. Walk into any trading room, open any charting platform, or browse any stock analysis forum in 2026, and you'll find MACD plastered across price charts like wallpaper. But here's the uncomfortable truth most trading educators won't tell you: MACD has serious, well-documented limitations that can lead to costly mistakes if you're not careful.
Understanding when not to use MACD is just as important as knowing when to use it. In this comprehensive guide, we'll break down exactly where MACD falls short, which market conditions expose its weaknesses most dramatically, and what smarter alternatives or complementary tools you should be reaching for instead.
Key Insight: MACD is a lagging indicator built from moving averages. By definition, it tells you where price has been — not necessarily where it's going. In certain market environments, this lag can cost you significant entry points or generate false signals that blow up a perfectly good trade thesis.
What MACD Actually Measures (And Why That Creates Problems)
Before diving into MACD limitations, it's worth quickly revisiting what the indicator actually calculates. MACD takes the difference between a 12-period and 26-period Exponential Moving Average (EMA), then plots a 9-period EMA signal line on top of that difference. A histogram shows the gap between the two lines.
The core problem? Every single component of MACD is derived from past price data. Moving averages are inherently backward-looking. The more periods they average, the more lag they introduce. When you layer one moving average calculation on top of another — which is exactly what MACD does — the lag compounds.
This isn't a flaw in the formula; it's a fundamental characteristic of how the indicator was designed. The issue arises when traders treat MACD signals as predictive rather than confirmatory, or use it in conditions where its lag creates more noise than signal.
Critical MACD Limitation #1: Sideways and Choppy Markets
Perhaps the single most dangerous environment for MACD is a ranging or sideways market. When price is oscillating within a defined range — say MSFT bouncing between $380 and $420 for several weeks — the MACD lines cross repeatedly without any meaningful directional trend developing.
The result? A whipsaw nightmare. You buy when MACD crosses bullish, price bounces off range resistance and reverses, MACD crosses bearish, you sell, price hits range support and bounces again. Each signal looks legitimate. Each one loses money.
Why Ranging Markets Destroy MACD Signals
- MACD was designed for trending markets: The indicator's creator, Gerald Appel, developed it to identify trend momentum — not range-bound oscillations.
- False crossovers multiply: In low-volatility consolidation, the 12 and 26-period EMAs cluster tightly together, causing frequent meaningless crossovers.
- Histogram noise increases: The histogram bars fluctuate rapidly around zero without building the sustained momentum divergence that signals genuine trend development.
- Stop-loss placement becomes impossible: Without a clear trend, there's no logical price structure to anchor your risk management.
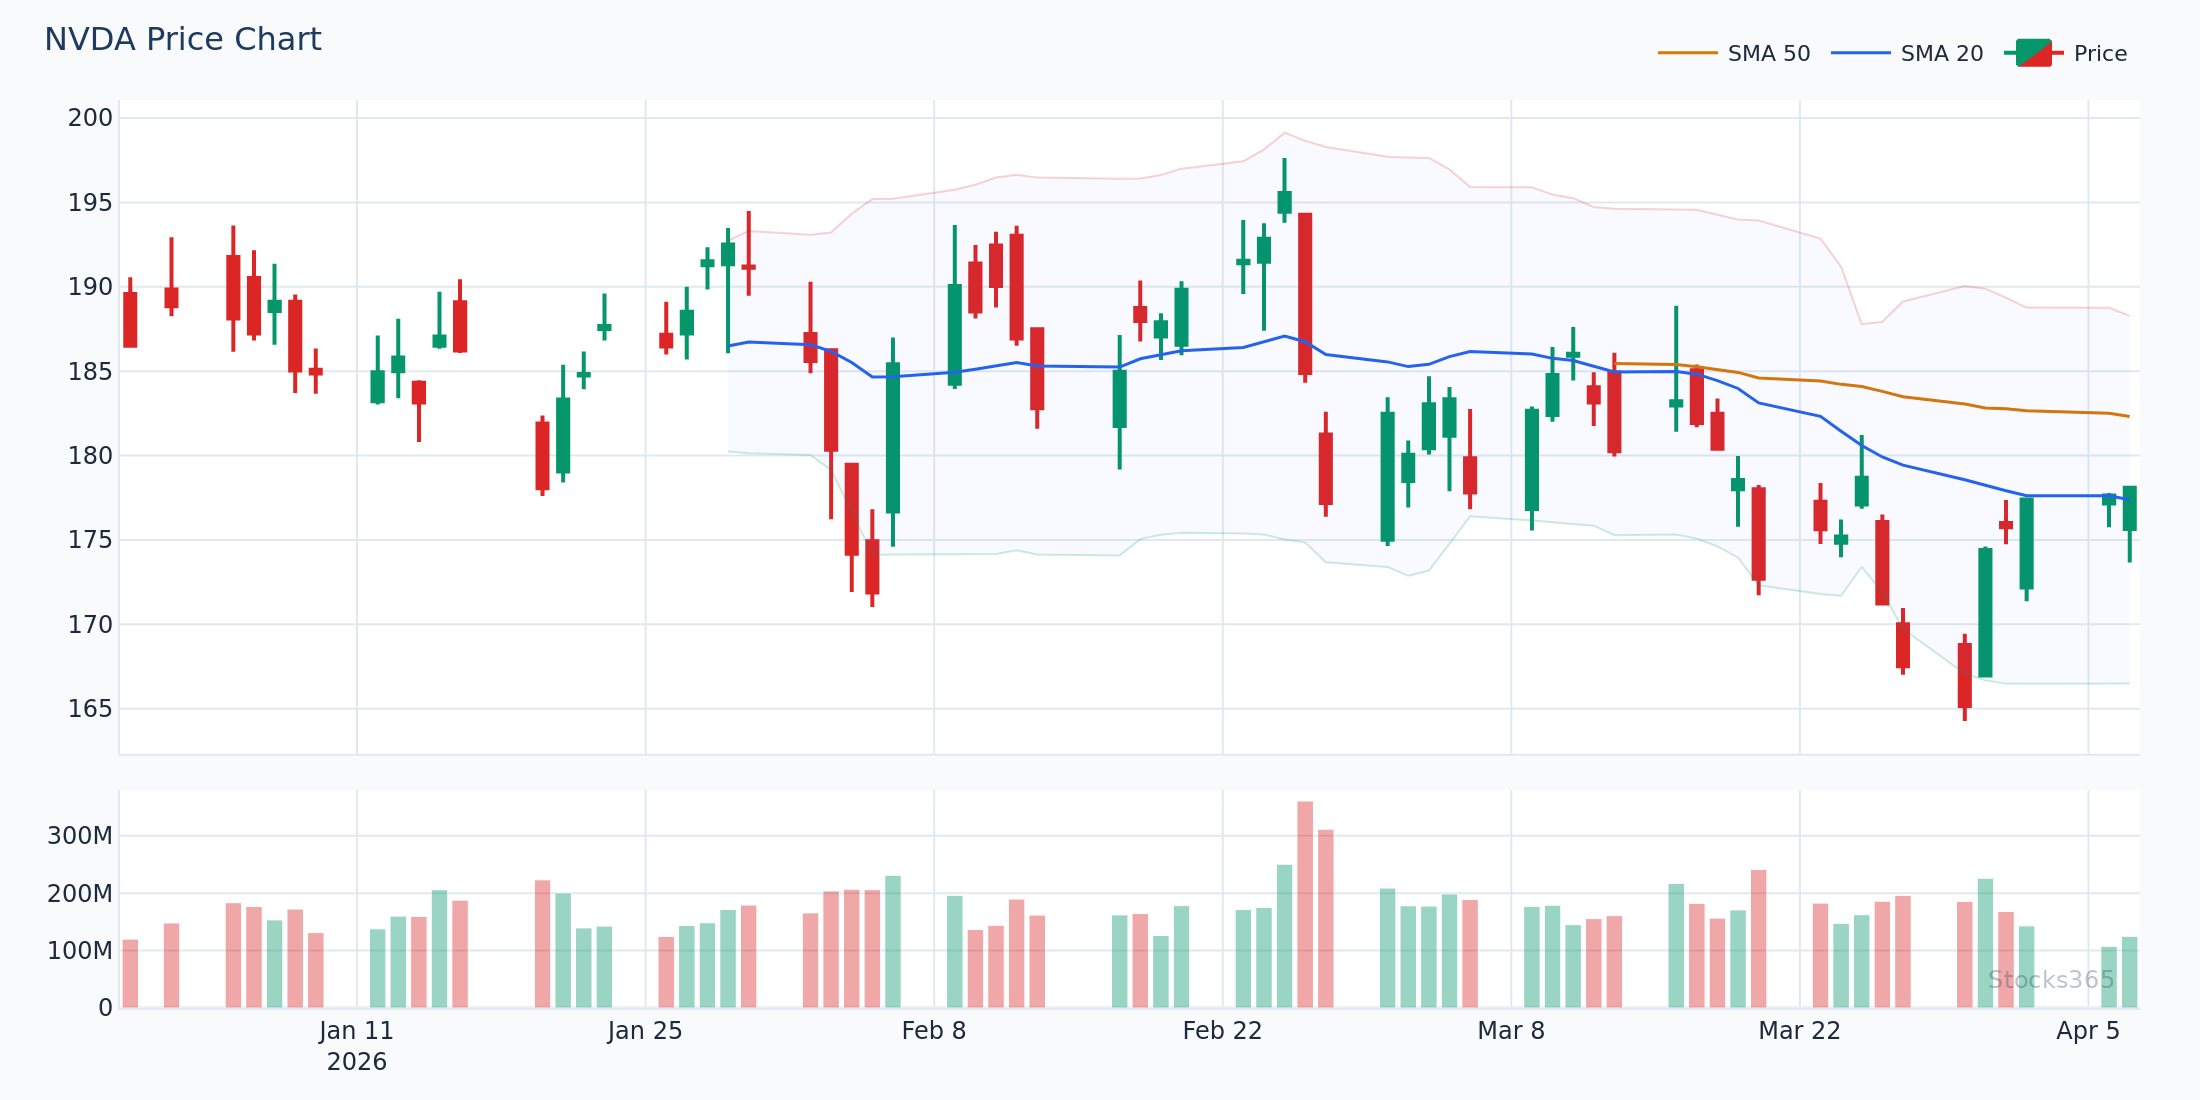
Practical Example: In early 2026, NVDA spent approximately six weeks consolidating between $118 and $134 after a sharp earnings-driven rally. During this period, MACD generated four separate bullish crossovers and four bearish crossovers — all within the same tight range. A trader blindly following each signal would have accumulated losses on every single trade while a patient trader waiting for a breakout confirmation would have avoided all of them.
Critical MACD Limitation #2: The Lagging Entry Problem in Strong Trends
Ironically, MACD also underperforms during the very market condition it was designed for: strong, fast-moving trends. When price accelerates sharply — think a momentum stock gapping up on earnings or a sector rotation moving at high velocity — the MACD signal line often doesn't confirm the move until 30-50% of the initial thrust has already occurred.
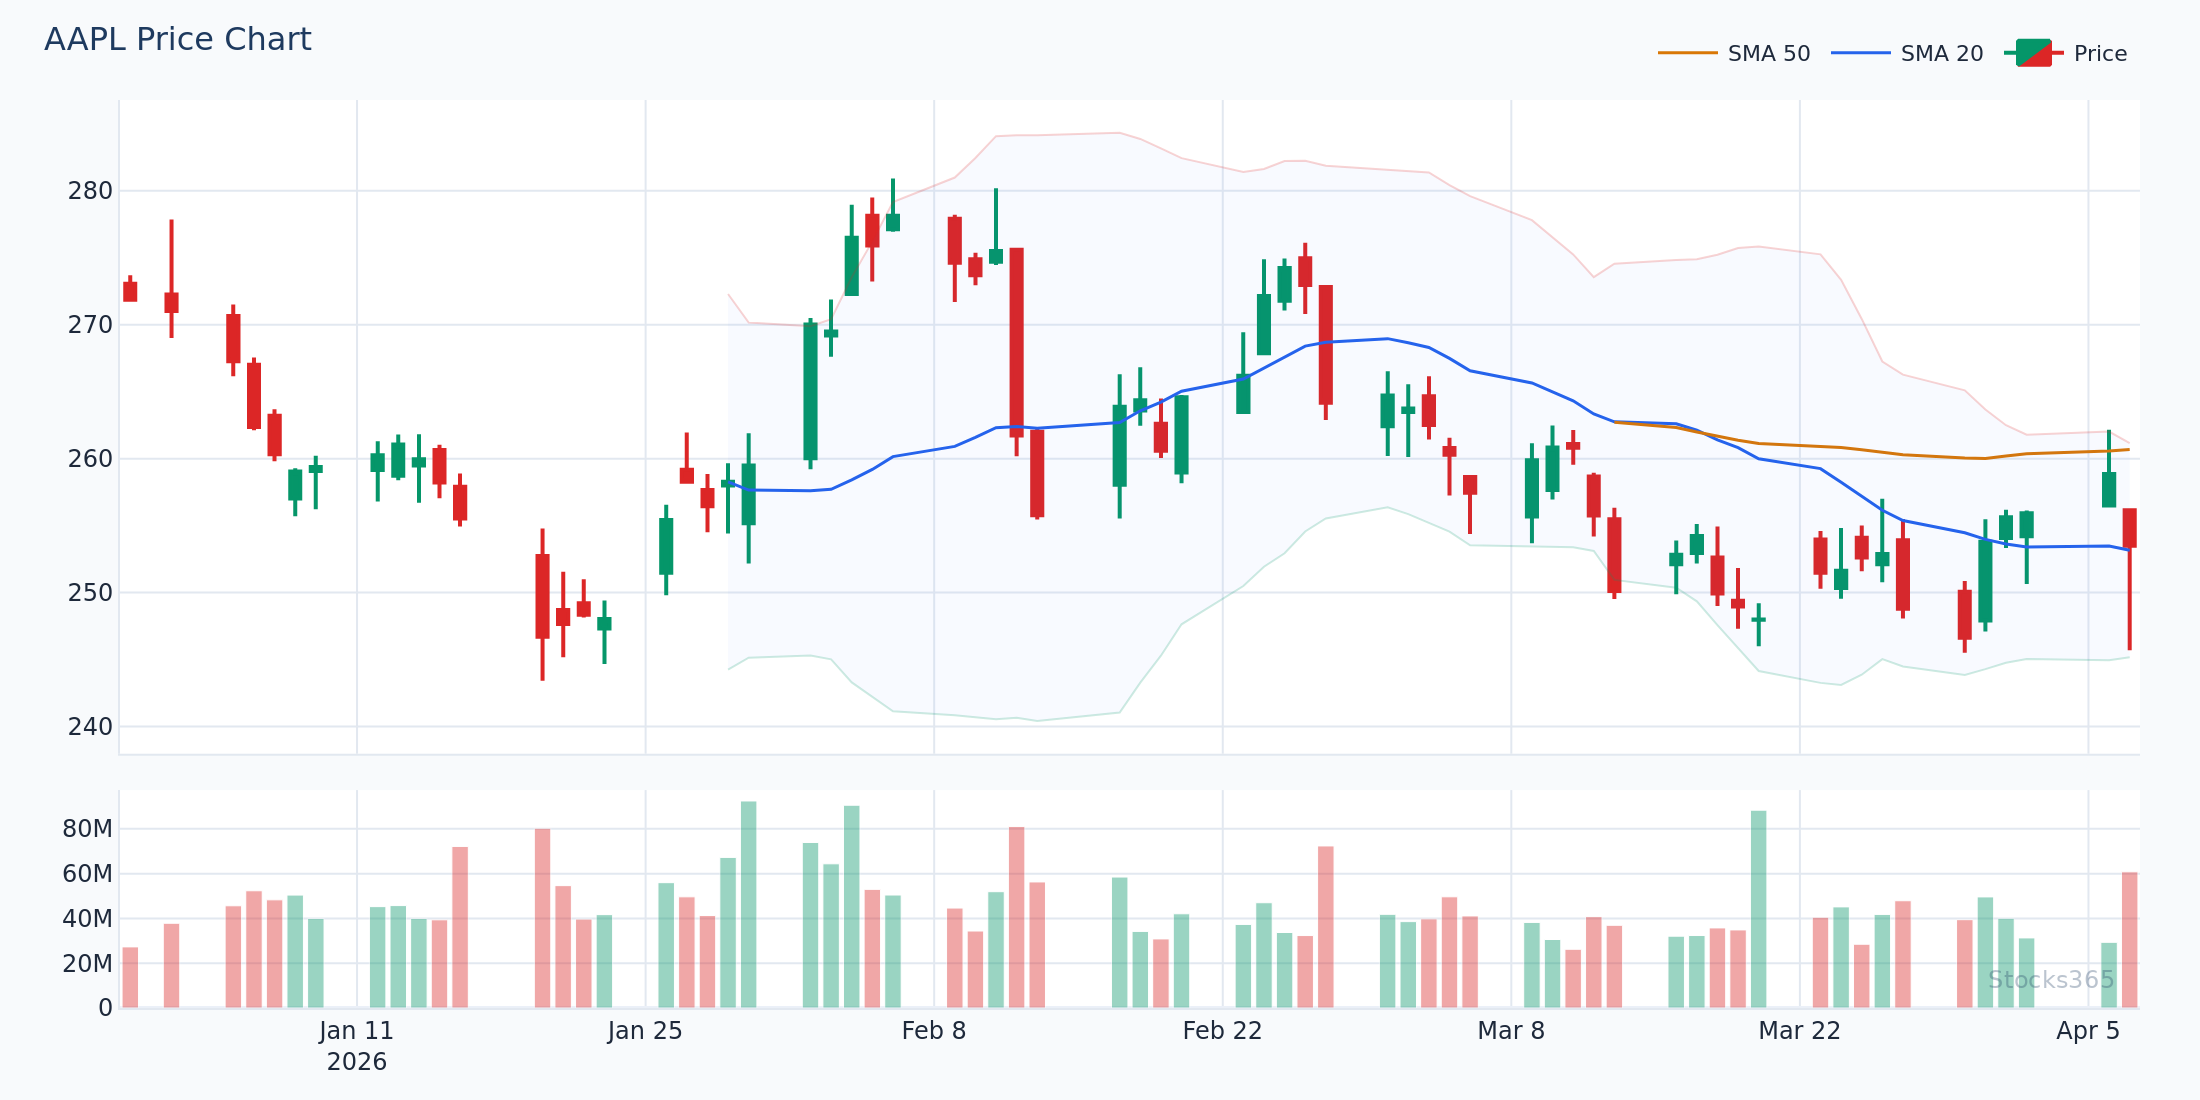
How Lag Costs You Real Money
Consider a scenario where AAPL breaks out from $195 on strong institutional buying and surges to $230 over two weeks. By the time MACD generates a clear bullish crossover and the histogram builds momentum visible enough for most traders to act on, price might already be at $218. You're entering a trade 70% of the way through the move, with the highest risk-to-reward ratio you could possibly choose.
This lag problem is especially painful in high-beta names and growth stocks where large single-day moves are common. The indicator simply cannot react fast enough to capture the early part of explosive moves.
Stocks365 Tip: When tracking fast-moving signals on stocks like TSLA or NVDA through the Stocks365 signals dashboard, our Trust Score system factors in multiple confirmation signals — not just MACD crossovers — precisely because single-indicator reliance in momentum environments is a known failure point.
Critical MACD Limitation #3: MACD Fails in Low-Volatility Environments
When overall market volatility compresses — as measured by VIX readings in the low-to-mid teens — MACD signals lose much of their reliability. The indicator's signal lines trade so close together that crossovers become statistically meaningless, occurring due to minor price fluctuations rather than genuine shifts in momentum.
Low volatility environments frequently precede sharp directional moves (breakouts or breakdowns), but MACD gives you no information about which direction that break will occur. Worse, it may generate a false signal in the wrong direction just before the real move begins, trapping traders on the wrong side at precisely the wrong moment.
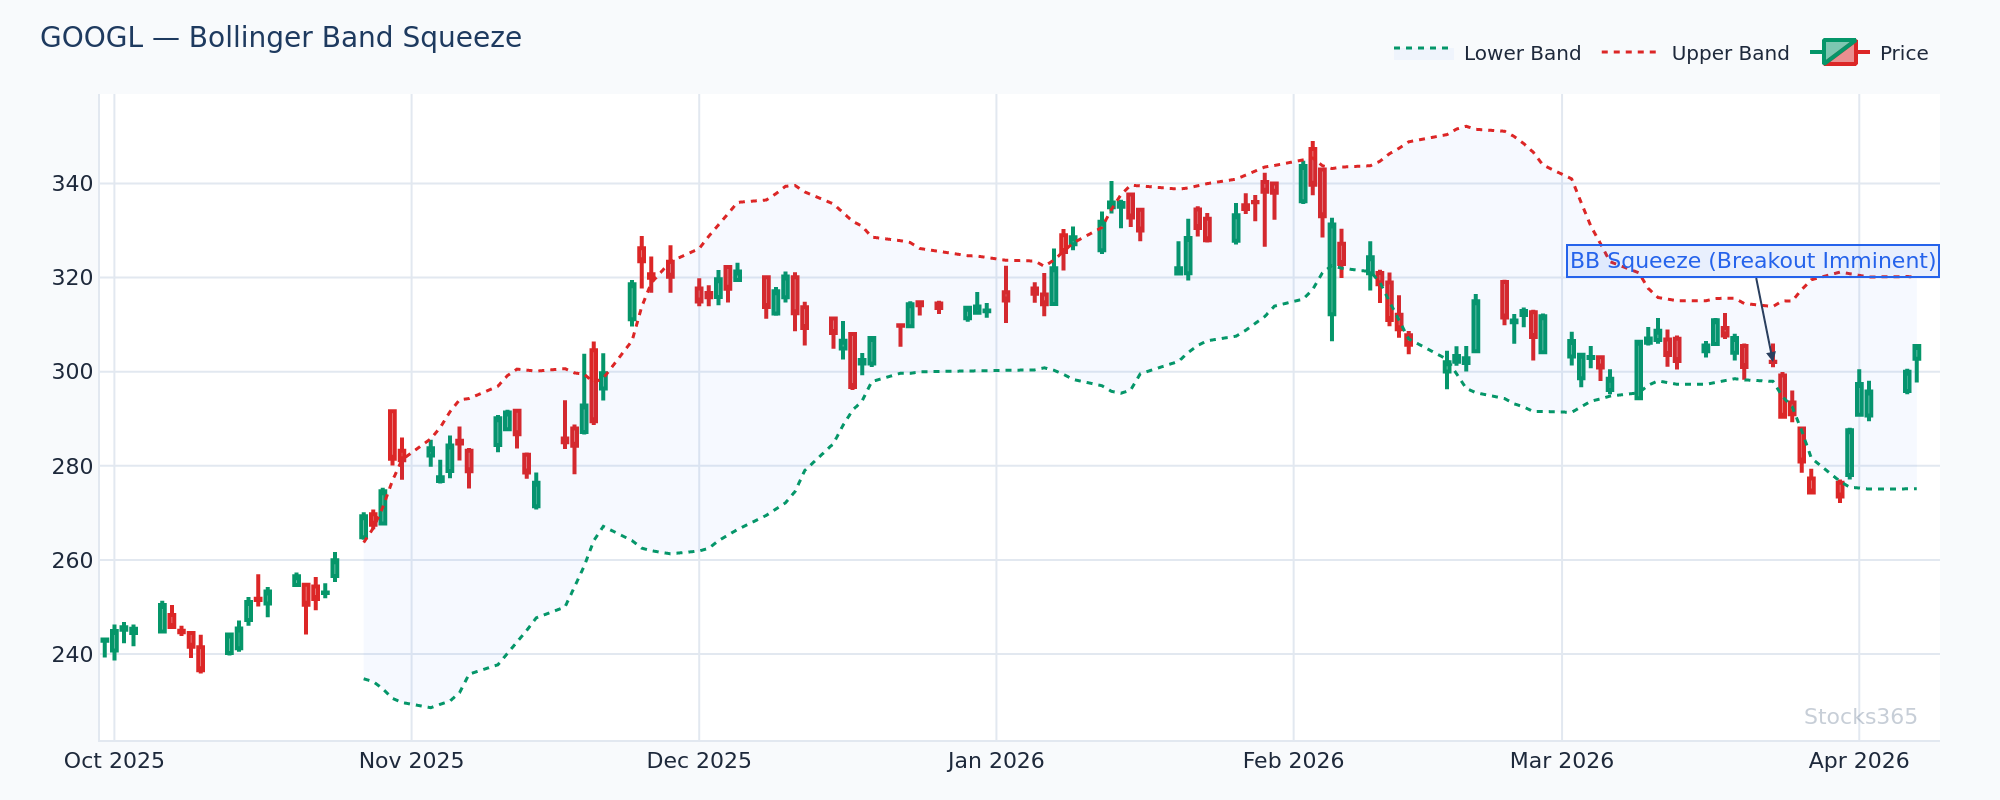
What to Use Instead in Low-Volatility Conditions
Bollinger Band squeeze analysis is far superior for identifying low-volatility consolidation setups. Volume analysis and relative strength comparisons can also provide directional bias before volatility expands. For momentum assessment in compressed markets, many experienced traders turn to the RSI and its divergence signals. If you're newer to RSI as a complementary tool, the complete RSI beginner's guide on Stocks365 is an excellent starting point, while more advanced traders should explore hidden RSI divergence signals that can reveal momentum shifts before MACD even begins to react.
Critical MACD Limitation #4: Divergence Signals Are Unreliable Without Context
MACD divergence — where price makes a new high or low but MACD doesn't confirm it — is widely promoted as a powerful reversal signal. And it can be. But this is also one of the most dangerously misunderstood applications of the indicator.
Why MACD Divergence Alone Isn't Enough
- Divergence can persist for weeks or months: In a strong uptrend, MACD bearish divergence can develop and re-develop multiple times while price continues higher. Traders who short based on early divergence signals in bull markets get repeatedly squeezed.
- No timing mechanism: MACD divergence tells you momentum is weakening but provides zero information about when the reversal will actually occur or how large it will be.
- Confirmation bias amplifier: Because MACD divergence looks visually compelling on a chart, traders tend to see it when they want to see it and dismiss counter-evidence.
- Scale dependency: Divergence patterns look dramatically different depending on the timeframe you're analyzing, making consistent interpretation challenging.
For traders who rely heavily on divergence analysis, RSI divergence tends to provide cleaner, earlier signals in many market conditions. The Stocks365 guide on RSI divergence for bullish and bearish signals covers the mechanics in detail and explains why RSI's bounded nature (0-100 scale) makes its divergence signals more contextually meaningful than MACD's unbounded histogram.
Critical MACD Limitation #5: Parameter Sensitivity and Curve-Fitting Risk
The standard MACD settings (12, 26, 9) were developed decades ago for daily stock charts during very different market conditions. Today's markets — characterized by algorithmic trading, 24-hour cryptocurrency sessions, high-frequency activity, and a proliferation of ETFs and derivatives — operate with fundamentally different dynamics.
The Optimization Trap
When MACD signals don't work well on a particular instrument or timeframe, the natural temptation is to optimize the parameters. Traders start testing (10, 22, 8) or (8, 21, 5) and find settings that would have worked beautifully on historical data. This is classic curve-fitting — building a model that explains the past but has no predictive value for the future.
The deeper problem is that MACD's performance characteristics shift based on the underlying instrument's volatility profile, sector behavior, and prevailing market regime. There's no universally optimal setting, and searching for one is largely an exercise in data mining rather than genuine strategy development.
This same parameter sensitivity issue exists for RSI, though RSI's bounded nature provides more stable interpretation across different settings. If you're exploring how period length affects indicator behavior, this Stocks365 guide on RSI settings provides a rigorous framework for thinking about parameter selection without falling into the optimization trap.
Critical MACD Limitation #6: Poor Performance on Short Timeframes
Intraday traders who apply MACD to 1-minute, 5-minute, or even 15-minute charts face amplified versions of all the problems described above. On short timeframes:
- Market microstructure noise overwhelms the underlying signal
- The lag becomes more costly relative to the size of moves being traded
- Transaction costs from increased false signals erode any edge
- Pre-market gaps and after-hours volatility create discontinuities that corrupt EMA calculations
While professional algorithmic traders can extract value from MACD-derived signals on short timeframes through careful filtering and position sizing, retail traders using standard MACD on intraday charts are typically doing more harm than good to their performance.
Critical MACD Limitation #7: It Doesn't Account for Volume or Market Context
MACD is a pure price-based indicator. It contains zero information about volume, market breadth, sector rotation, fundamental catalysts, or macroeconomic conditions. This creates serious blind spots:
The Volume Problem
A MACD bullish crossover on declining volume carries completely different implications than the same crossover on expanding volume. Yet MACD treats both situations identically. A stock like AMZN can generate a technically perfect MACD bullish signal on a low-volume drift higher — which is far less reliable than the same signal accompanied by 150% of average daily volume.
The Catalyst Blind Spot
When a company announces earnings, regulatory news, or a major strategic development, MACD signals generated in the immediate aftermath are based on pre-catalyst price behavior. The indicator has no mechanism to reset or recalibrate around fundamental regime changes, which means its signals in the immediate post-catalyst period can be particularly unreliable.
Smarter Alternatives: What to Use When MACD Fails
Recognizing MACD limitations isn't about abandoning the indicator entirely — it's about knowing which tools are better suited to specific conditions.
RSI for Momentum and Overbought/Oversold Analysis
The Relative Strength Index addresses several of MACD's core weaknesses. Its bounded 0-100 scale makes overbought and oversold conditions directly comparable across different instruments and time periods. Understanding RSI overbought and oversold levels gives traders a more reliable framework for identifying potential reversal zones. For a deep dive into the mechanics, how RSI is calculated provides the formula and logic behind the indicator.
Stochastic Oscillator for Ranging Markets
In the sideways conditions where MACD struggles most, the Stochastic Oscillator often performs better. Its design specifically targets overbought and oversold conditions within ranges. The RSI vs Stochastic Oscillator comparison guide on Stocks365 provides a practical framework for choosing between these tools based on market conditions.
Multi-Indicator Confirmation Frameworks
The most sophisticated approach — and the one embedded in the Stocks365 Trust Score methodology — uses MACD as one input among many rather than as a standalone signal generator. When MACD, RSI, volume analysis, and price structure all align, signal quality increases dramatically. When they conflict, it's often a sign to stay flat and wait for clarity.
If you want to see how multi-factor analysis works in practice, checking the AAPL signal page on Stocks365 shows how institutional-grade analysis layers multiple confirmation factors rather than relying on any single indicator.
How to Use MACD Responsibly: Practical Guidelines
Despite its limitations, MACD remains a useful tool when applied correctly. Here's a framework for responsible use:
- Confirm trending conditions first: Use ADX (Average Directional Index) readings above 25 to verify a trend exists before trusting MACD signals. Below ADX 25, treat MACD with significant skepticism.
- Always pair with volume analysis: Require above-average volume to confirm MACD crossovers, especially for entry signals.
- Use daily or weekly charts: MACD's reliability increases significantly on higher timeframes where noise is filtered out naturally.
- Treat divergence as a warning, not a signal: Use MACD divergence to become more cautious, not to take immediate positions. Wait for price confirmation before acting.
- Combine with price structure: MACD signals that align with key support/resistance levels, trendline breaks, or chart pattern completions carry far more weight than isolated crossovers.
- Learn complementary tools: Develop proficiency in RSI, volume analysis, and price action. The ultimate RSI trading guide is an excellent next step for building a more complete analytical toolkit.
📊 Key Takeaways: MACD Limitations Summary
- Lagging by design: MACD is built from historical moving averages and will always confirm trends late, missing early entry points in fast moves.
- Ranging markets are its kryptonite: Sideways price action generates repeated false crossovers that produce consistent losses when traded mechanically.
- Divergence needs confirmation: MACD divergence can persist for extended periods; never trade it without additional price action confirmation.
- Short timeframes amplify all weaknesses: Intraday MACD applications magnify lag and noise, reducing reliability substantially.
- Volume blind spot: MACD ignores volume entirely, missing a critical dimension of move quality and conviction.
- Parameter optimization is a trap: Fitting MACD settings to historical data produces false confidence without genuine forward-looking edge.
- Use it as one input, not the answer: MACD works best as a confirming indicator within a multi-factor framework, not as a standalone signal generator.
The Bottom Line on MACD Limitations
MACD is not a bad indicator. It's a contextually limited indicator that has been applied far beyond the conditions for which it was designed. The traders who use it most effectively in 2026 are those who deeply understand its weaknesses and deploy it exclusively in the environments where its strengths outweigh its limitations.
The traders who struggle are those who trust MACD crossovers as gospel in choppy markets, who enter trades late in strong trends because they waited for MACD confirmation, or who short into strong uptrends because a divergence signal looked compelling on the chart.
Building genuine trading edge requires understanding not just how indicators work, but when they break down. That understanding — combined with the kind of multi-factor signal analysis available through the Stocks365 intelligence platform — is what separates consistently profitable traders from those who wonder why their technically perfect setups keep failing.
Frequently Asked Questions
Is MACD a good indicator for day trading?
MACD is generally not well-suited for day trading on short timeframes (1-minute to 15-minute charts). Its inherent lag from layered moving averages becomes more costly relative to intraday move sizes, and market microstructure noise creates frequent false signals. Day traders often find momentum oscillators like the Stochastic or short-period RSI more responsive to intraday price action. If you use MACD for day trading, restrict it to 1-hour or 4-hour charts and always require volume and price structure confirmation.
What is the biggest weakness of the MACD indicator?
The biggest weakness of MACD is its performance in sideways, ranging markets. Because it's derived from moving averages designed to track trends, MACD generates frequent false crossovers when price oscillates within a range. This creates a whipsaw effect where traders are repeatedly entering and exiting positions with no directional edge, accumulating losses from both wrong-direction trades and transaction costs. Always check whether price is trending (ADX above 25) before trusting MACD signals.
When should I use RSI instead of MACD?
RSI tends to outperform MACD in ranging markets, low-volatility environments, and when you need to identify overbought or oversold conditions. RSI's bounded 0-100 scale makes extreme readings directly comparable across instruments, while its divergence signals often appear earlier than MACD divergence. For trend-following in clear trending conditions, MACD can be more intuitive. The smartest approach is using both together — RSI for momentum extremes and MACD for trend confirmation — while understanding that neither should be used in isolation.
Can MACD give false signals in a bull market?
Yes, MACD generates false signals even in bull markets — most commonly bearish divergence signals that appear while price continues higher. In strong uptrends, MACD can show weakening histogram momentum while price keeps advancing, misleading traders into premature short positions or causing them to exit long positions too early. This is one reason why bearish MACD divergence in a confirmed uptrend should be treated as a caution signal requiring additional confirmation, not as an immediate sell trigger.
Are there any markets where MACD works particularly poorly?
MACD performs especially poorly in cryptocurrency markets (particularly on short timeframes), highly volatile small-cap stocks, and any instrument that frequently gaps due to earnings or news events. The 24-hour nature of crypto markets and the extreme volatility spikes in small caps amplify all of MACD's lag and false-signal weaknesses. For these instruments, price action analysis combined with volume and a responsive oscillator like the Stochastic tends to provide more actionable signals than standard MACD configurations.