
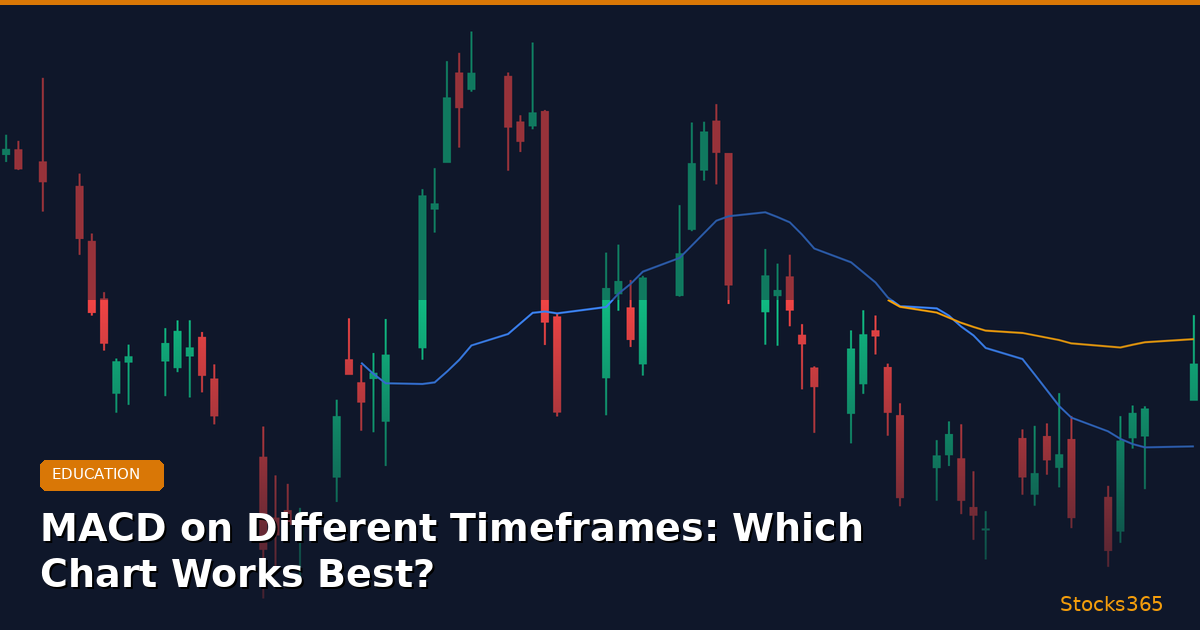
MACD on Different Timeframes: Why the Chart Interval Changes Everything
The Moving Average Convergence Divergence (MACD) indicator is one of the most widely used tools in technical analysis — but here's what most traders get wrong: they apply it on whatever default timeframe their platform opens and wonder why the signals feel inconsistent. The truth is, MACD timeframes fundamentally alter the quality, frequency, and reliability of every signal you see.
Whether you're scalping NVDA for 15-minute momentum plays or swing trading AAPL over several weeks, the timeframe you choose determines whether MACD becomes your most powerful edge or your most expensive source of noise. In this guide, we'll break down how MACD behaves across every major chart interval, which setups produce the cleanest signals, and how professional traders on platforms like Stocks365 use multi-timeframe MACD analysis to stay consistently ahead of the market.
What Is MACD and Why Do Timeframes Matter So Much?
MACD measures the relationship between two exponential moving averages — typically the 12-period EMA minus the 26-period EMA — and plots the result alongside a 9-period signal line. The histogram shows the difference between the MACD line and the signal line, making momentum shifts visually immediate.
Here's the critical insight: the "periods" in MACD are relative to your chart interval. On a 1-minute chart, the 12-period EMA covers 12 minutes of price action. On a weekly chart, it spans 12 weeks. The same formula produces dramatically different outputs depending on how much data each period represents.
Key principle: Shorter MACD timeframes produce more signals with more noise. Longer MACD timeframes produce fewer signals with higher reliability. The best traders don't pick one — they use both together.
This is why understanding MACD across timeframes isn't optional — it's the foundation of using the indicator correctly. And it works best when paired with other momentum tools. If you're already familiar with RSI, you'll know that the same timeframe logic applies there too — as explored in RSI Settings: Master the Best Period for Your Strategy.

MACD on Short Timeframes: 1-Minute, 5-Minute, and 15-Minute Charts
The 1-Minute MACD: High Noise, Scalping Only
On a 1-minute chart, MACD becomes extremely sensitive. You'll see crossovers happening every few minutes, the histogram flipping constantly, and signal lines that barely have time to establish a trend before reversing. For 99% of traders, the 1-minute MACD generates far more false signals than profitable ones.
That said, professional scalpers use 1-minute MACD specifically for entry timing — never for direction. They've already determined trend direction on a 15-minute or hourly chart and use the 1-minute MACD solely to fine-tune the entry tick by tick. Without that higher-timeframe context, 1-minute MACD is essentially random noise dressed up in a familiar indicator.
The 5-Minute MACD: Day Trader's Core Tool
The 5-minute chart is where active day traders most commonly apply MACD, and for good reason. It filters out the worst micro-noise while still responding quickly enough to intraday momentum shifts. A MACD crossover on a 5-minute chart of TSLA, for example, might represent 20-30 minutes of sustained directional pressure — enough to generate a meaningful move.
Practical example: Imagine TSLA is trading at $285 on a Tuesday morning in March 2026. On the 5-minute chart, the MACD line crosses above the signal line at 10:15 AM as the histogram turns positive. A day trader using the Stocks365 TSLA signal feed confirms this bullish crossover is backed by a strong trust score — meaning multiple indicators align. They enter at $285.40, targeting a move to $289, with a stop at $283.80. The trade resolves within two hours as momentum carries the stock to $288.70.
The 5-minute MACD works best when:
- Combined with volume confirmation (volume spike validates the crossover)
- The broader 30-minute or hourly MACD is trending in the same direction
- You're trading during the first two hours of the session or the power hour before close
- Price is near a key support or resistance level that adds confluence
The 15-Minute MACD: The Sweet Spot for Intraday Trading
Many experienced day traders argue the 15-minute chart is the most balanced MACD timeframe for intraday work. It reduces noise significantly compared to the 5-minute chart while still providing actionable signals within a single trading day. Crossovers on the 15-minute MACD tend to represent genuine short-term momentum shifts rather than microstructure noise.
On the 15-minute chart, MACD divergence also becomes more meaningful. If AAPL makes a new intraday high at $215 but the MACD histogram prints a lower peak than it did at the previous high of $213, that bearish divergence on the 15-minute timeframe carries real weight — often preceding reversals of $3-$6 in a single session.
MACD on Medium Timeframes: 1-Hour and 4-Hour Charts
The 1-Hour MACD: Day Trader Meets Swing Trader
The 1-hour chart occupies a fascinating middle ground. It's too slow for pure day traders but too fast for swing traders who only check charts once or twice daily. However, for traders who monitor positions actively across multi-day holds, the 1-hour MACD is extremely valuable.
On the hourly chart, MACD signals filter out daily noise while still reflecting changes in momentum within a 2-5 day window. This makes the 1-hour MACD ideal for identifying the early stages of trend reversals before they become obvious on the daily chart. Traders who spotted the MACD bullish crossover on MSFT's 1-hour chart in early 2026 before the broader tech rally had a significant head start over those waiting for daily confirmation.
The 4-Hour MACD: Swing Trader's Premium Timeframe
The 4-hour chart has earned a devoted following among swing traders, and the MACD on this timeframe is a significant reason why. Four-hour MACD crossovers typically represent 3-10 days of directional momentum — exactly the holding period most swing traders target.
The 4-hour MACD also produces cleaner histogram patterns, making divergence analysis more reliable. When GOOGL's 4-hour MACD histogram shows three progressively smaller bearish bars while price attempts to push lower, that converging pattern frequently signals the exhaustion of selling pressure before a multi-day bounce.
This divergence logic connects directly to broader momentum analysis. If you're building divergence-based strategies, the concepts in RSI Divergence Explained: Master Bullish & Bearish Signals will deepen your understanding of how momentum indicators reveal hidden turning points — the same principles apply to MACD divergence across timeframes.
MACD on Long Timeframes: Daily, Weekly, and Monthly Charts
The Daily MACD: The Universal Standard
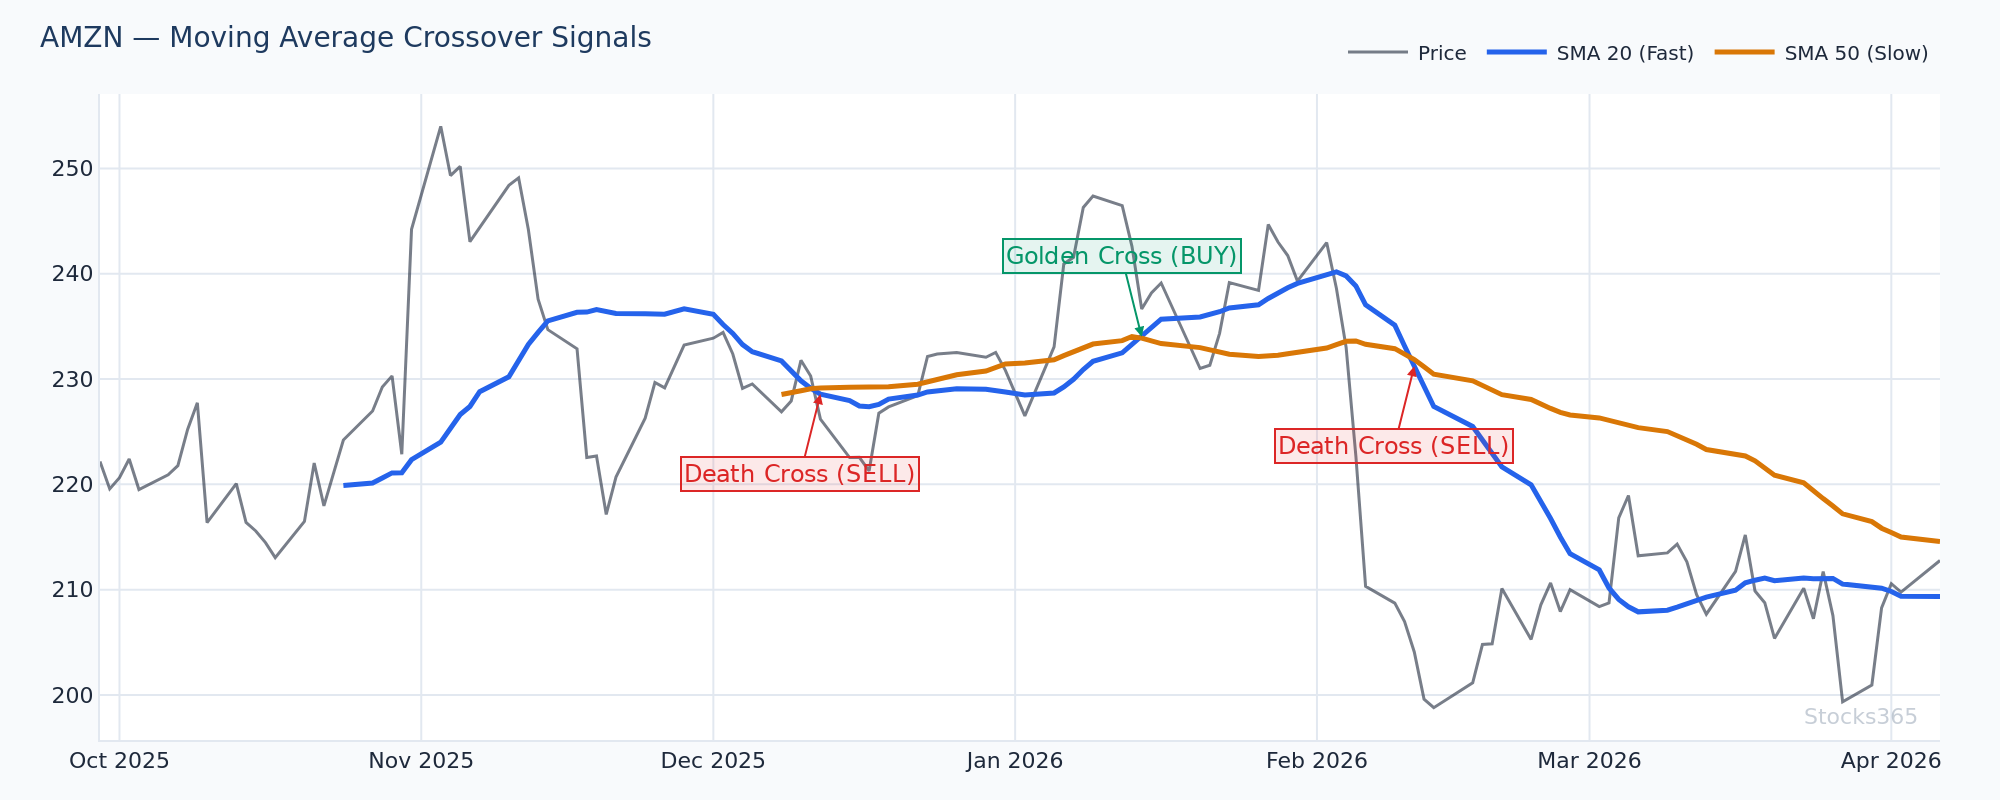
The daily chart is where most traders find MACD most useful, and it's the default timeframe for good reason. Daily MACD signals represent weeks of accumulating momentum, which means crossovers carry significant weight. A bullish MACD crossover on the daily chart — where the MACD line crosses above the signal line with the histogram turning green — often marks the beginning of a multi-week rally.
Consider a real scenario framework: AMZN trading at $220 in February 2026. The daily MACD has been below the signal line for three weeks during a correction. Suddenly, the histogram bars start shrinking, momentum slows, and then the MACD line crosses above the signal line on a day when price holds above its 50-day moving average. This convergence of signals on the daily chart would represent a high-confidence long entry for swing traders targeting a move back toward $235-240.
The Stocks365 trust score system factors in exactly this kind of multi-indicator alignment. When a daily MACD crossover occurs while the platform's momentum score and volume analysis both confirm bullish bias, the trust score rises sharply — giving traders a quantified measure of signal quality rather than relying on visual interpretation alone.
The Weekly MACD: Position Trader and Investor Tool
Weekly MACD signals are slow — sometimes months apart — but when they fire, they mark major trend inflection points. A weekly MACD crossover represents a shift in the dominant trend that has persisted for weeks, which means these signals are extremely high-quality but require patience.
Position traders and long-term investors use weekly MACD to answer one question: is the primary trend still intact? As long as the weekly MACD line remains above the signal line and the histogram stays positive, the uptrend is considered healthy regardless of short-term pullbacks visible on daily or hourly charts.
Weekly MACD is also where the concept of hidden divergence becomes powerful. If price makes a higher low during a pullback but the weekly MACD makes a lower low, that hidden bullish divergence — a signal most retail traders miss entirely — often precedes explosive continuation moves. This concept is explored in depth in Hidden RSI Divergence: The Advanced Signal Most Traders Miss, and the same logic applies across momentum indicators including MACD.
The Monthly MACD: Macro Trend Confirmation
Monthly MACD is rarely used for entries or exits — it's a macro lens. When the monthly MACD crosses bullish for a major index ETF or blue-chip stock, it signals the beginning of a secular bull phase that could last years. These crossovers occur perhaps twice per decade and represent generational entry points for patient investors.
For most active traders, the monthly MACD serves as a bias filter: if the monthly is bullish, you bias long on daily signals; if monthly is bearish, you're more aggressive with short opportunities on daily crossovers.
Multi-Timeframe MACD Analysis: How Professional Traders Actually Use It
The Top-Down Approach
The most sophisticated MACD traders don't choose a single timeframe — they use a top-down hierarchy. The process works like this:
- Weekly MACD: Establishes the dominant bias (bullish or bearish). Only trade in this direction.
- Daily MACD: Identifies the current trend phase — is price in momentum or consolidation? Confirms setups.
- 4-Hour or 1-Hour MACD: Times the entry within the daily trend, looking for crossovers that align with higher-timeframe direction.
- 15-Minute or 5-Minute MACD (optional): Fine-tunes entry execution for precise price levels.
This top-down approach means you're never fighting the trend on a higher timeframe. A bullish 5-minute MACD crossover means nothing if the daily and weekly are both in downtrends — but that same crossover becomes a high-probability trade when all higher timeframes confirm bullish momentum.
Combining MACD with RSI Across Timeframes
MACD and RSI are complementary tools, and using them together across timeframes creates a powerful confirmation system. MACD measures trend direction and momentum, while RSI measures speed of price movement and overbought/oversold conditions. When both agree across multiple timeframes, signal quality increases dramatically.
For example, if NVDA shows a bullish daily MACD crossover while RSI is recovering from oversold territory (below 35) on the same daily chart, the confluence of these two signals represents a significantly higher-probability setup than either indicator alone. For traders new to RSI or those wanting to understand how it complements MACD, What Is RSI? The Complete Beginner's Guide and How to Use RSI in Trading: The Ultimate Step-by-Step Guide are essential reading.
Similarly, understanding RSI Overbought and Oversold Levels helps you identify when MACD signals are firing from extreme conditions — which often produces the most explosive moves. And if you're comparing tools, RSI vs Stochastic Oscillator offers further context on how momentum indicators stack up against each other in different market conditions.
MACD Timeframe Settings: Should You Adjust the Default Parameters?
The standard MACD settings (12, 26, 9) were designed for daily charts. When you move to shorter timeframes, some traders adjust these parameters to compensate for the increased noise. Common adjustments include:
- For 5-minute charts: Some traders use (5, 13, 5) or (8, 17, 9) for faster response
- For 1-hour charts: (12, 26, 9) works well as-is, but (19, 39, 9) reduces noise further
- For weekly charts: (6, 13, 5) can be used to maintain responsiveness at the higher timeframe
That said, most professional traders recommend keeping the default 12, 26, 9 settings because they are universally watched. When millions of traders watch the same settings, the signals become self-fulfilling to a degree — and fighting against the crowd's focal point rarely adds edge.
The key insight from understanding how momentum indicators are calculated is that the math behind these tools matters. Changing settings without understanding the underlying calculation often leads to optimization bias — curve-fitting parameters to past data that won't hold in live markets.
Common MACD Timeframe Mistakes and How to Avoid Them
- Using MACD in isolation: No single timeframe MACD signal should be traded without confirmation from at least one higher timeframe or complementary indicator.
- Over-optimizing timeframes: Finding the "perfect" timeframe on historical data usually fails in live trading. Stick to standard intervals (5m, 15m, 1h, 4h, daily).
- Ignoring the zero line: MACD above zero confirms bullish momentum; below zero confirms bearish. Many traders focus only on crossovers and miss this critical filter.
- Chasing signals in choppy markets: MACD is a trend-following tool — it underperforms in sideways, range-bound conditions on any timeframe. Use the histogram's shrinking pattern to identify low-volatility periods and stand aside.
- Trading against higher-timeframe MACD: A bullish 5-minute crossover during a bearish daily MACD trend is a counter-trend trade — valid occasionally but statistically lower probability.
📊 Key Takeaways: MACD Timeframes
- 1-5 minute MACD: Scalping entry timing only — never use for direction without higher-timeframe context
- 15-minute MACD: Best intraday balance of noise reduction and signal frequency for day traders
- 4-hour MACD: Premium timeframe for swing traders seeking 3-10 day momentum moves
- Daily MACD: The universal standard — reliable, widely watched, high-quality signals for position building
- Weekly MACD: Macro trend filter for investors and position traders; crossovers mark major inflection points
- Multi-timeframe alignment: The most powerful MACD signals occur when weekly, daily, and intraday all agree on direction
- Combine with RSI: MACD + RSI confluence across timeframes significantly improves signal quality and trade confidence
- Default settings (12, 26, 9): Optimal for most timeframes — avoid over-optimizing without strong statistical justification
Frequently Asked Questions
What is the best MACD timeframe for day trading?
The 15-minute chart is widely considered the best MACD timeframe for day trading. It reduces the excessive noise found on 1-minute and 5-minute charts while still producing actionable intraday signals. Many experienced day traders use the 15-minute MACD for direction and the 5-minute MACD for precise entry timing, combining both timeframes in a top-down approach.
Should I change MACD settings for different timeframes?
The default MACD settings (12, 26, 9) work well across most timeframes because they are universally watched by traders, creating self-reinforcing signals. While some traders adjust parameters for very short timeframes (like using 5, 13, 5 on 1-minute charts), most professionals recommend keeping default settings to avoid over-optimization and to trade alongside the majority of market participants.
How do I use MACD across multiple timeframes?
Use a top-down approach: start with the weekly MACD to establish your dominant directional bias, confirm with the daily MACD to identify trend phase, then use the 4-hour or hourly MACD for entry timing. Only take trades that align with the higher-timeframe direction. This multi-timeframe MACD method dramatically reduces false signals and improves the quality of your trade entries.
Is MACD better on weekly or daily charts for long-term investing?
For long-term investing, weekly MACD is the primary tool because it filters out short-term volatility and identifies genuine shifts in the dominant trend. Daily MACD crossovers can be used to optimize entry timing within a bullish weekly MACD environment, but the weekly chart should be your north star for investment decisions. Weekly MACD crossovers are rare — occurring perhaps a few times per year on major stocks — but they consistently mark significant turning points.
Can MACD divergence work on short timeframes like the 5-minute chart?
MACD divergence becomes less reliable on very short timeframes due to increased noise. On the 5-minute chart, divergence signals have a much higher false-positive rate than on the 4-hour or daily chart. If you use 5-minute MACD divergence, always confirm it with divergence on the 15-minute chart and check that higher-timeframe MACD context supports the potential reversal. Standalone 5-minute MACD divergence without higher-timeframe confirmation is generally not a reliable standalone signal.