
Why the MACD RSI Strategy Outperforms Single-Indicator Trading
Most traders start with a single indicator and quickly discover the frustrating reality: no indicator is right all the time. The RSI flags an oversold condition — you buy — and the price keeps dropping. The MACD signals a bullish crossover — you enter — and the market immediately reverses. Sound familiar?
The solution isn't to abandon these tools. It's to use them together. The MACD RSI strategy combines two of the most battle-tested indicators in technical analysis into a dual-confirmation framework that dramatically reduces false signals and improves entry timing. When both indicators agree, the probability of a successful trade rises significantly.
In this guide, we'll break down exactly how this strategy works, how to set up your charts, how to read the combined signals, and how to apply it across different market conditions in 2026.
Key Insight: Using two independent indicators that measure different market dynamics — momentum and trend direction — creates a natural filter. Each indicator must confirm the other before you act.
Understanding the Two Pillars: RSI and MACD
Before combining these indicators, you need a solid understanding of what each one measures and why they complement each other so well.
What Is RSI and What Does It Measure?
The Relative Strength Index (RSI) is a momentum oscillator that moves between 0 and 100. It measures the speed and magnitude of recent price changes to evaluate whether an asset is overbought or oversold. If you're new to the concept, our Complete Beginner's Guide to RSI covers everything you need to know from the ground up.
Standard RSI settings use a 14-period lookback. Readings above 70 are traditionally considered overbought, while readings below 30 are considered oversold. However, context matters enormously — in strong trending markets, RSI can stay overbought or oversold for extended periods. For a deeper dive into RSI overbought and oversold levels, we recommend reading our dedicated guide on mastering these signals.
The RSI's strength lies in identifying momentum exhaustion — the point at which buying or selling pressure begins to fade before a price reversal.
What Is MACD and What Does It Measure?
The Moving Average Convergence Divergence (MACD) is a trend-following momentum indicator built from the relationship between two exponential moving averages — typically the 12-period EMA and the 26-period EMA. The MACD line is the difference between these two EMAs, while the signal line is a 9-period EMA of the MACD line itself.
Traders look for three primary MACD signals:
- MACD Line Crossovers: When the MACD line crosses above the signal line, it's bullish. When it crosses below, it's bearish.
- Zero Line Crossovers: When the MACD line crosses above zero, the short-term trend is strengthening. Below zero signals weakening momentum.
- Histogram Expansion/Contraction: The histogram visualizes the distance between the MACD and signal lines, showing accelerating or decelerating momentum.
Where RSI excels at identifying overbought/oversold conditions, MACD excels at confirming trend direction and momentum shifts. That's exactly why they work so well together.
The MACD RSI Strategy: Core Rules and Setup
The power of this combined approach lies in requiring both indicators to agree before entering a trade. Here's how to set up the strategy properly.
Recommended Indicator Settings
- RSI: 14-period (standard). You can experiment with shorter periods for more sensitive signals — see our guide on RSI settings and the best period for your strategy.
- MACD: 12, 26, 9 (standard settings work well across most timeframes)
- Timeframe: Works on 1H, 4H, and Daily charts. Daily is recommended for beginners to reduce noise.
Bullish Entry Signal Rules
For a valid long entry using the MACD RSI strategy, the following conditions must be met simultaneously or in close sequence:
- RSI is below 50 (ideally below 40 or in the 30–45 zone) and turning upward
- MACD line crosses above the signal line (bullish crossover)
- MACD histogram shifts from negative to positive (or begins expanding upward)
- Price is ideally near a known support level or has formed a higher low
Bearish Entry Signal Rules
For a valid short entry, look for the mirror-image conditions:
- RSI is above 50 (ideally above 60 or in the 55–70 zone) and turning downward
- MACD line crosses below the signal line (bearish crossover)
- MACD histogram shifts from positive to negative (or begins contracting/expanding downward)
- Price is ideally near a known resistance level or has formed a lower high
Real Trading Example: Applying the MACD RSI Strategy to NVDA
Let's walk through a practical example to see how this strategy plays out in real market conditions.
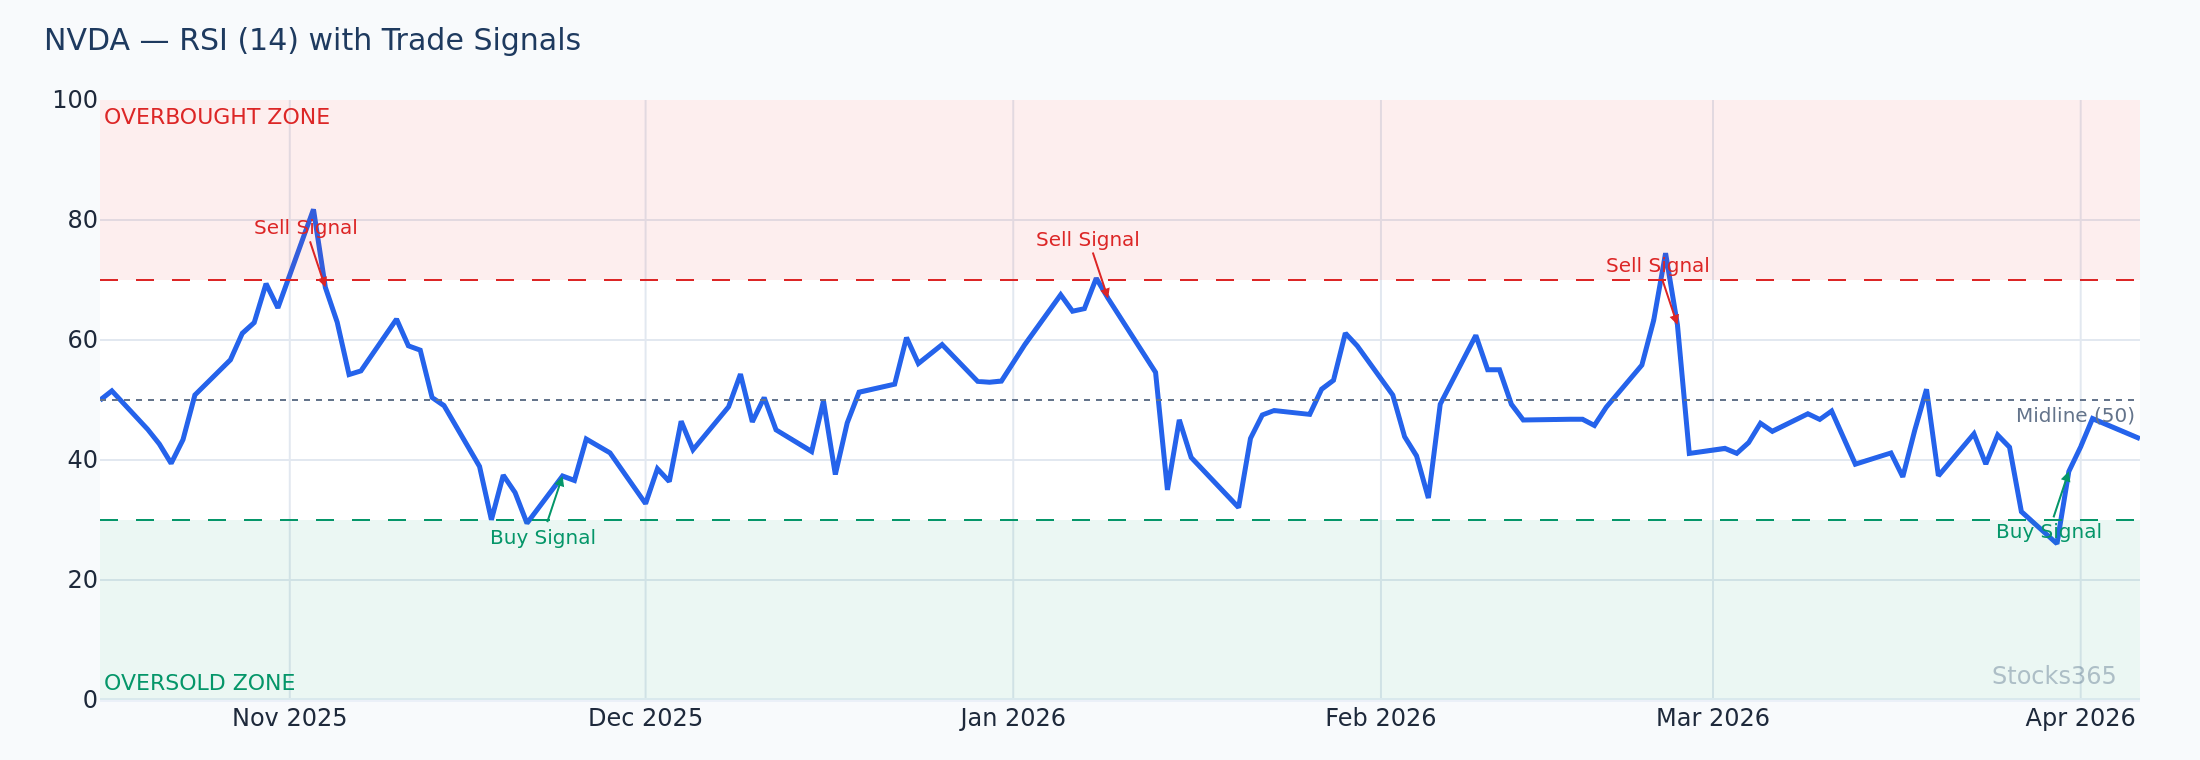
Imagine NVDA is trading around $142.50 after a pullback from a local high of $168.00. The stock has been in a broader uptrend but has corrected for two weeks. You pull up the daily chart and observe the following:
- RSI Reading: RSI has dipped to 38 — approaching oversold territory but not extreme. It begins curling upward from the 38 level.
- MACD Reading: The MACD line, which had crossed below the signal line during the pullback, now crosses back above the signal line. The histogram flips from red to green.
- Price Action: NVDA has tested the $141–$143 support zone twice and held both times, forming a double bottom.
All three conditions align: RSI turning up from below 50, bullish MACD crossover, and price at support. This is a textbook MACD RSI strategy entry.
Trade Setup:
- Entry: $143.00 (on confirmation candle close)
- Stop Loss: $138.50 (below the double bottom low)
- Target 1: $155.00 (previous consolidation zone)
- Target 2: $165.00 (near prior high)
- Risk/Reward: ~1:2.7 on Target 1
Adding RSI Divergence to Supercharge Your Signals
The MACD RSI strategy becomes even more powerful when you layer in RSI divergence analysis. Divergence occurs when price makes a new high or low, but the RSI fails to confirm it — a warning sign that the trend is losing steam.
Bullish RSI Divergence + MACD Crossover
Consider this scenario: a stock makes a lower low in price, but the RSI makes a higher low. This bullish divergence signals weakening bearish momentum. If the MACD simultaneously generates a bullish crossover, you have an exceptionally high-confidence setup — the divergence warns of exhaustion, and the MACD confirms the momentum shift.
For a comprehensive understanding of how to identify and trade these patterns, read our guide on RSI Divergence: Mastering Bullish & Bearish Signals.
Hidden Divergence for Trend Continuation
Beyond standard divergence, traders using the MACD RSI strategy can also look for hidden RSI divergence — a more advanced signal that flags trend continuation rather than reversal. When price makes a higher low but RSI makes a lower low during an uptrend, hidden bullish divergence suggests the pullback is temporary and the uptrend will resume. Combine this with a MACD bullish crossover and you have a powerful trend-continuation entry.
Our article on Hidden RSI Divergence: The Advanced Signal Most Traders Miss explains this concept in full detail with visual examples.
How the Stocks365 Trust Score Enhances This Strategy
One of the most common challenges with any indicator-based strategy is confirmation bias — seeing what you want to see in the charts. The Stocks365 Trust Score adds an objective, algorithmic layer to your analysis by aggregating multiple technical signals, including MACD and RSI readings, into a single confidence rating for each signal.
When the MACD RSI strategy generates a setup on a stock, checking the Stocks365 signals dashboard provides instant context: Is this signal aligned with broader institutional flow? Are other technical factors supporting the thesis? The Trust Score helps distinguish between high-probability setups and marginal ones — particularly useful when market conditions are ambiguous.
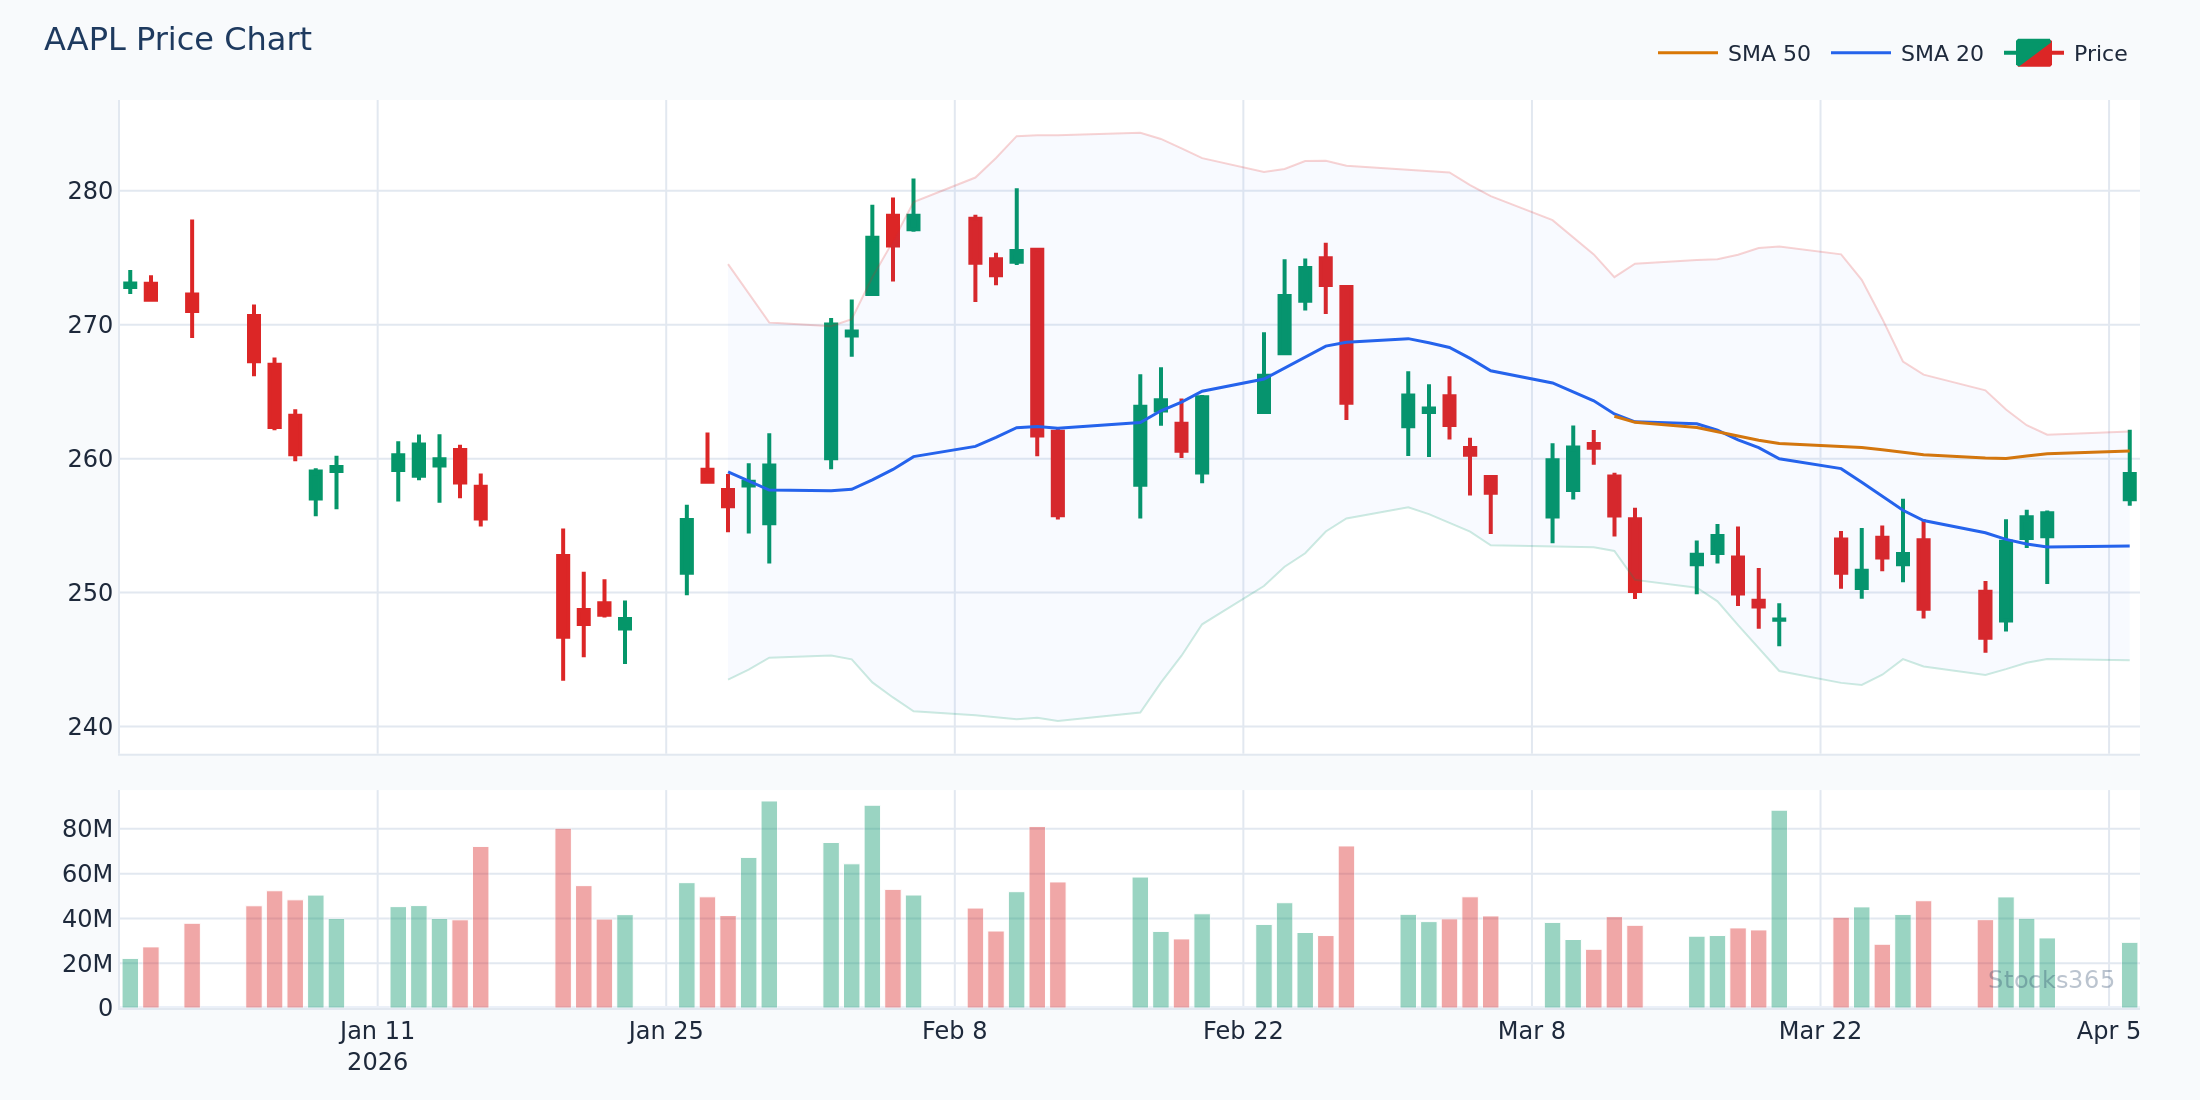
For example, if you're analyzing an MACD RSI setup on Apple, you can visit the AAPL signal page to see how the platform's algorithms rate the current opportunity against historical patterns and current market dynamics.
MACD RSI Strategy Across Different Market Conditions
No strategy works identically in all environments. Here's how to adapt the MACD RSI strategy based on market conditions:
In Trending Markets
In strong trending markets, RSI often stays elevated (above 60 in uptrends, below 40 in downtrends) for extended periods. In these conditions, focus on MACD as the primary signal and use RSI to identify pullback entries — buy when RSI dips to 45–55 in an uptrend and the MACD begins turning up from a shallow crossover.
In Range-Bound Markets
When price is consolidating between clear support and resistance levels, RSI becomes the primary tool. Buy RSI dips toward 30–40 near support and sell RSI spikes toward 60–70 near resistance. Use MACD confirmation to filter — only act when the MACD crossover aligns with the RSI signal at those key levels.
In Volatile or Choppy Markets
In choppy, low-directional markets, both indicators generate more false signals. In these conditions, consider widening your RSI thresholds (below 35 for bullish, above 65 for bearish) and requiring the MACD crossover to occur above or below the zero line for additional confirmation.
Common Mistakes to Avoid With the MACD RSI Strategy
Even with a solid dual-indicator framework, traders make avoidable mistakes. Here are the most critical errors to watch for:
Acting on RSI Alone Without MACD Confirmation
An RSI reading of 28 looks tempting — but without a MACD bullish crossover, you're catching a falling knife. The whole point of this strategy is dual confirmation. Patience is the skill.
Ignoring the Trend Context
Taking bullish MACD RSI signals in a strong downtrend is a recipe for losses. Always identify the higher-timeframe trend first. Counter-trend trades require far more confirmation and tighter risk management.
Using Identical RSI Settings for All Instruments
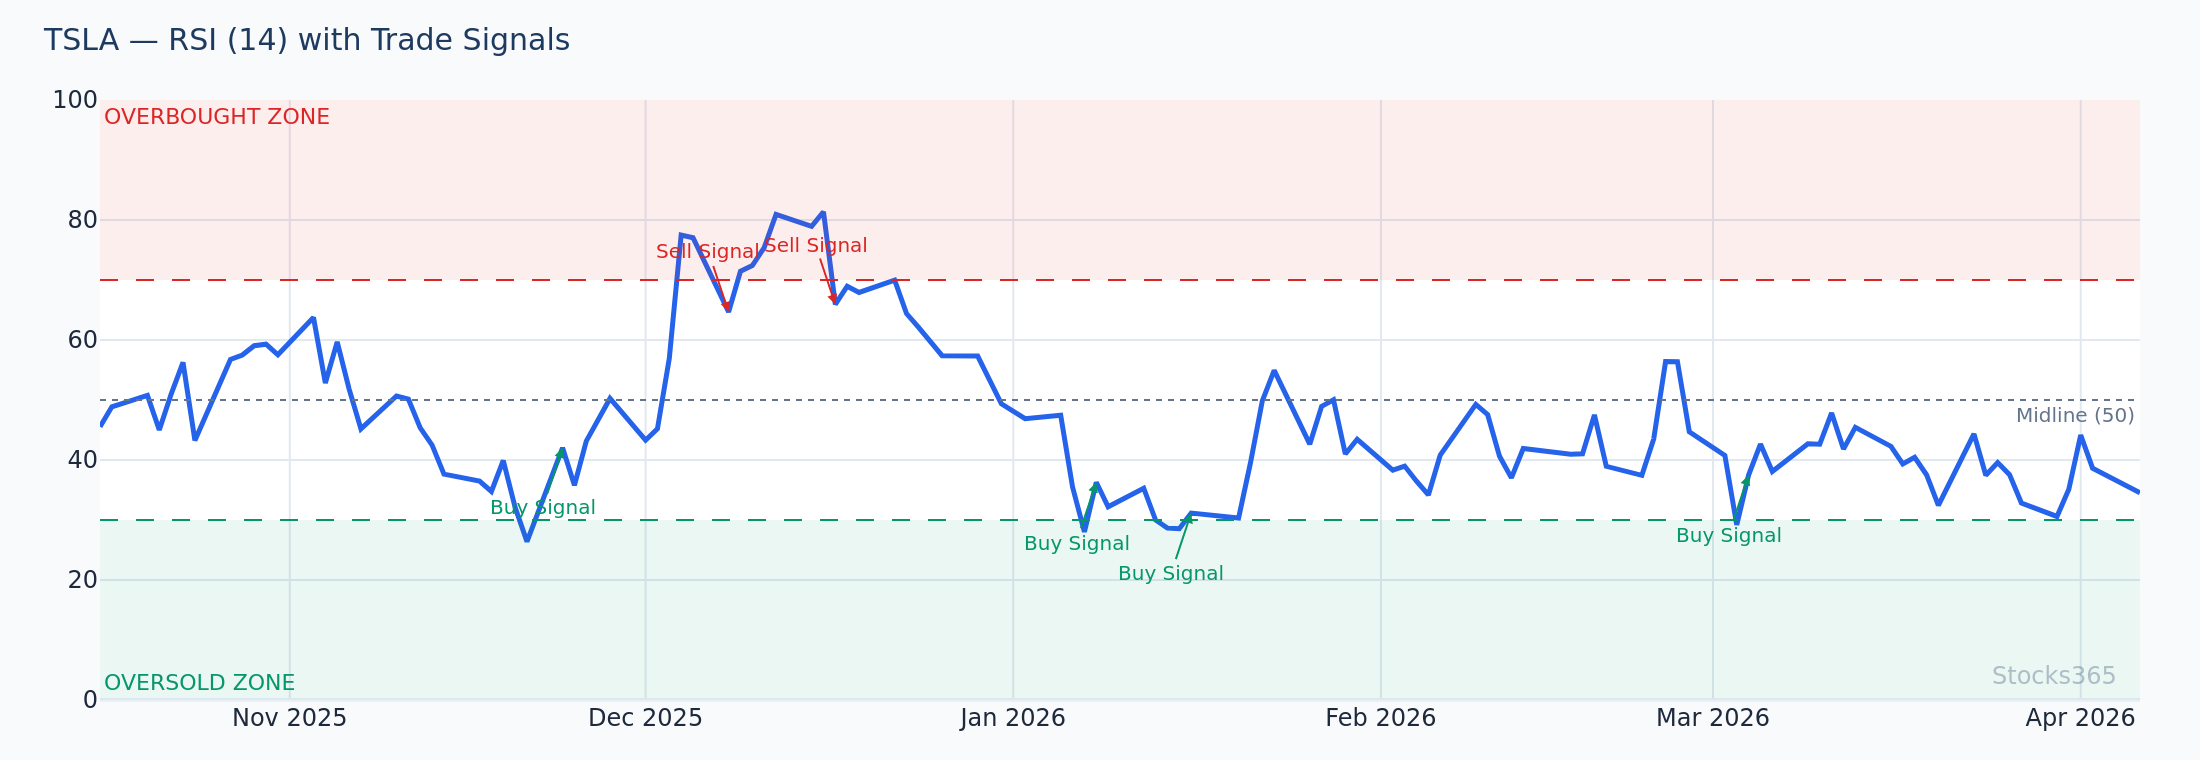
A 14-period RSI behaves differently on a high-volatility stock like TSLA compared to a low-volatility blue chip. Adjust your RSI period or thresholds accordingly. Our guide on How to Use RSI in Trading walks through practical adjustments for different instruments.
Skipping Position Sizing and Stop Placement
Signal quality means nothing without proper risk management. Always define your stop loss before entering — typically below the most recent swing low for longs — and never risk more than 1–2% of your trading capital on a single trade.
MACD RSI vs. Other Combined Strategies
The MACD RSI pairing isn't the only dual-indicator approach. Some traders use RSI with Bollinger Bands, others pair MACD with moving averages. How does the MACD RSI strategy compare?
When compared to the RSI Stochastic combination, the MACD RSI strategy generally provides slower but more reliable signals. The Stochastic oscillator is more sensitive and faster-moving, which can lead to earlier entries but more whipsaws. The MACD's trend-following nature complements RSI's momentum measurement in a way that tends to produce higher-quality, higher-conviction setups. For a detailed comparison of RSI against another popular oscillator, read our RSI vs Stochastic Oscillator guide.
Key Takeaways
📌 MACD RSI Strategy — Summary:
✅ Dual confirmation reduces false signals — require both RSI and MACD to agree before entering any trade.
✅ Bullish setup: RSI below 50 turning up + MACD bullish crossover + price at or near support.
✅ Bearish setup: RSI above 50 turning down + MACD bearish crossover + price at or near resistance.
✅ Add RSI divergence to the framework for the highest-probability setups available with these tools.
✅ Adapt to market conditions — trending markets favor MACD-led signals; range-bound markets favor RSI extremes.
✅ Always use stops — indicator agreement doesn't guarantee success; risk management is non-negotiable.
✅ Use Stocks365 Trust Score to objectively validate setups and filter for the highest-confidence opportunities.
Frequently Asked Questions
What is the MACD RSI strategy?
The MACD RSI strategy is a dual-indicator trading approach that combines the Relative Strength Index (RSI) and the Moving Average Convergence Divergence (MACD) indicator to generate higher-confidence buy and sell signals. By requiring both indicators to confirm a signal simultaneously, traders can significantly reduce false entries compared to using either indicator alone.
What are the best settings for the MACD RSI strategy?
Standard settings work well for most traders: RSI at 14 periods with overbought/oversold levels at 70/30, and MACD at 12, 26, 9. However, the ideal settings depend on the asset and timeframe you're trading. Shorter RSI periods (like 9 or 10) generate more signals with less lag but more noise. Our RSI settings guide explores how to optimize the period for your specific strategy.
Can I use this strategy on any timeframe?
Yes, the MACD RSI strategy works across multiple timeframes — from 15-minute charts to weekly charts. However, signals on higher timeframes (4H, Daily, Weekly) are generally more reliable and less prone to whipsaws. Day traders often use the 1H chart for entries with the 4H chart for trend direction. Beginners are recommended to start on the Daily chart.
How does RSI divergence improve the MACD RSI strategy?
RSI divergence adds a leading signal to the combination. When price makes a new low but RSI makes a higher low (bullish divergence), it indicates weakening bearish momentum before the price reversal. When this is confirmed by a bullish MACD crossover, you have both a leading signal (divergence) and a lagging confirmation (MACD), creating one of the most powerful setups in technical analysis. Learn more in our RSI Divergence guide.
Is the MACD RSI strategy suitable for beginners?
Yes, with the right foundational knowledge. Both indicators are widely available on all major charting platforms and are well-documented. Beginners should start by understanding each indicator individually — the RSI calculation guide and the basics of MACD are good starting points — before combining them. Practice on a paper trading account first to get comfortable identifying valid setups without real capital at risk.