
MACD Trading Strategy for Stocks: What Every Serious Trader Needs to Know
The Moving Average Convergence Divergence indicator — better known as MACD — remains one of the most powerful tools in a stock trader's arsenal. Whether you're a swing trader hunting multi-day momentum plays or a position trader looking for trend confirmation, understanding the MACD strategy for stocks can dramatically sharpen your entry and exit timing.
In this guide, we go beyond theory. We break down real-world MACD case studies across major stocks like AAPL, NVDA, and TSLA, showing you exactly how professional traders are using this indicator in 2026 to capture high-probability setups. We also show you how to combine MACD with other momentum tools — including RSI — to build a complete, battle-tested trading system.
- MACD measures momentum and trend direction using two exponential moving averages
- The three core MACD signals are crossovers, zero-line crosses, and divergence
- Combining MACD with RSI and volume filtering dramatically improves signal accuracy
- Real case studies on NVDA, AAPL, and TSLA show MACD's practical edge in 2026 markets
- Stocks365's trust score system helps traders validate MACD signals before entering positions
What Is MACD and Why Does It Work for Stocks?
MACD was developed by Gerald Appel in the late 1970s and has stood the test of time precisely because it captures two critical dimensions of price behavior: trend direction and momentum strength. Most indicators do one or the other — MACD does both.
The standard MACD setup uses three components:
- MACD Line: The difference between the 12-period EMA and the 26-period EMA
- Signal Line: A 9-period EMA of the MACD line itself
- Histogram: The visual representation of the gap between the MACD line and signal line
When the MACD line crosses above the signal line, buying pressure is accelerating. When it crosses below, selling pressure is taking control. The histogram makes these shifts visually immediate — expanding bars signal strengthening momentum, while shrinking bars warn that a reversal may be near.
"MACD doesn't predict the future — it reveals the present state of momentum with stunning clarity. That's its edge."
The Three Core MACD Signals Every Stock Trader Must Master
1. MACD Signal Line Crossover
The most common MACD strategy for stocks centers on the signal line crossover. A bullish crossover occurs when the MACD line crosses above the signal line, indicating upward momentum is building. A bearish crossover occurs when the MACD line drops below the signal line.
The key nuance professional traders apply: where the crossover happens matters enormously. A bullish crossover occurring well below the zero line (in deeply negative territory) carries far more weight than one happening near zero. It suggests a more dramatic shift from oversold momentum to recovery.
2. Zero-Line Cross
When the MACD line crosses from negative to positive territory (crossing the zero line from below), it signals that the short-term moving average has surpassed the long-term average — a confirmation that the trend has genuinely shifted bullish. This is a slower but more reliable signal than the crossover alone.
Traders using the MACD strategy for stocks on Stocks365's signals dashboard often use zero-line crosses as trend confirmation before acting on a signal line crossover.
3. MACD Divergence
Divergence is where MACD truly earns its reputation among advanced traders. Bullish divergence occurs when a stock's price makes a lower low, but the MACD histogram makes a higher low — signaling that downward momentum is exhausting even as price falls. Bearish divergence is the inverse.
This concept mirrors the divergence principles found in RSI analysis. If you're unfamiliar with divergence trading, our guide on RSI Divergence Explained: Master Bullish & Bearish Signals provides excellent foundational knowledge that directly applies to reading MACD divergence as well.
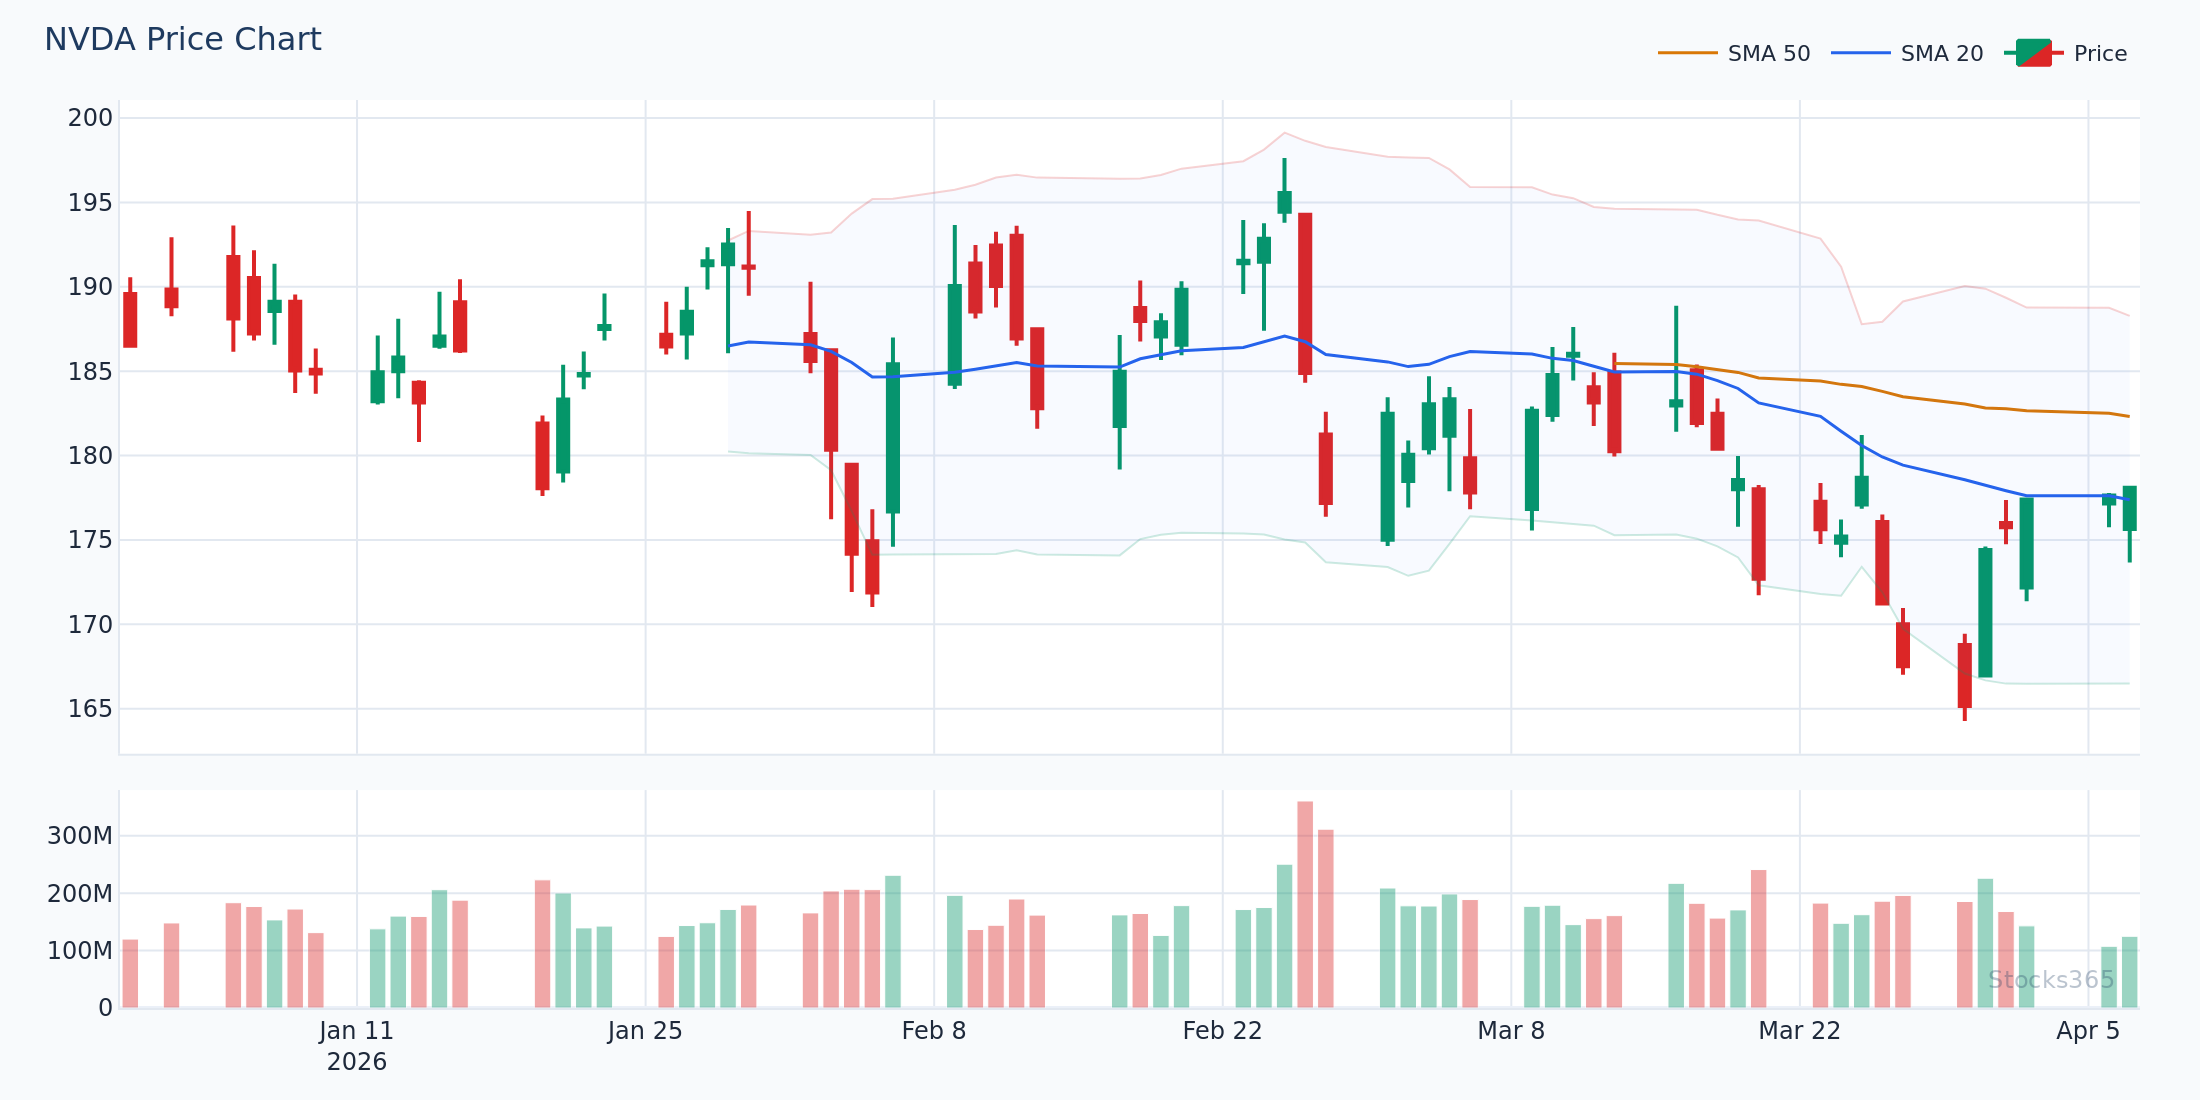
Real Case Study #1: NVDA — Riding the AI Momentum Wave
NVIDIA (NVDA) has remained one of the most actively traded stocks on Stocks365 throughout 2026, driven by sustained demand for AI infrastructure. Let's walk through a textbook MACD setup that played out on the daily chart.
The Setup
In early Q1 2026, NVDA had undergone a multi-week consolidation after a sharp rally, pulling back from the $165 range to a support zone near $142. During this pullback, the MACD histogram began showing a classic bullish divergence pattern — price was retesting lows, but histogram bars were getting progressively shorter, indicating waning selling pressure.
The Entry Signal
The confirmed entry trigger arrived when the MACD line crossed above the signal line while still below the zero line — a below-zero bullish crossover. Experienced traders watching the NVDA signal page on Stocks365 saw the trust score for this setup climb to 82/100, reflecting alignment between MACD momentum, volume confirmation, and broader market trend.
- Entry zone: $144.50 – $146.00
- Stop loss: Below $139.80 (under the prior swing low)
- First target: $158.00 (prior resistance)
- Extended target: $167.00 (all-time high retest)
The Outcome
NVDA moved from the entry zone to the first target within 11 trading days as the MACD line crossed the zero line — providing secondary confirmation that the bullish trend was fully re-established. Traders who held for the extended target captured a gain exceeding 15% from entry.
Key lesson: The below-zero bullish crossover combined with histogram divergence produced a high-conviction signal. Neither signal alone was sufficient — their convergence was the edge.
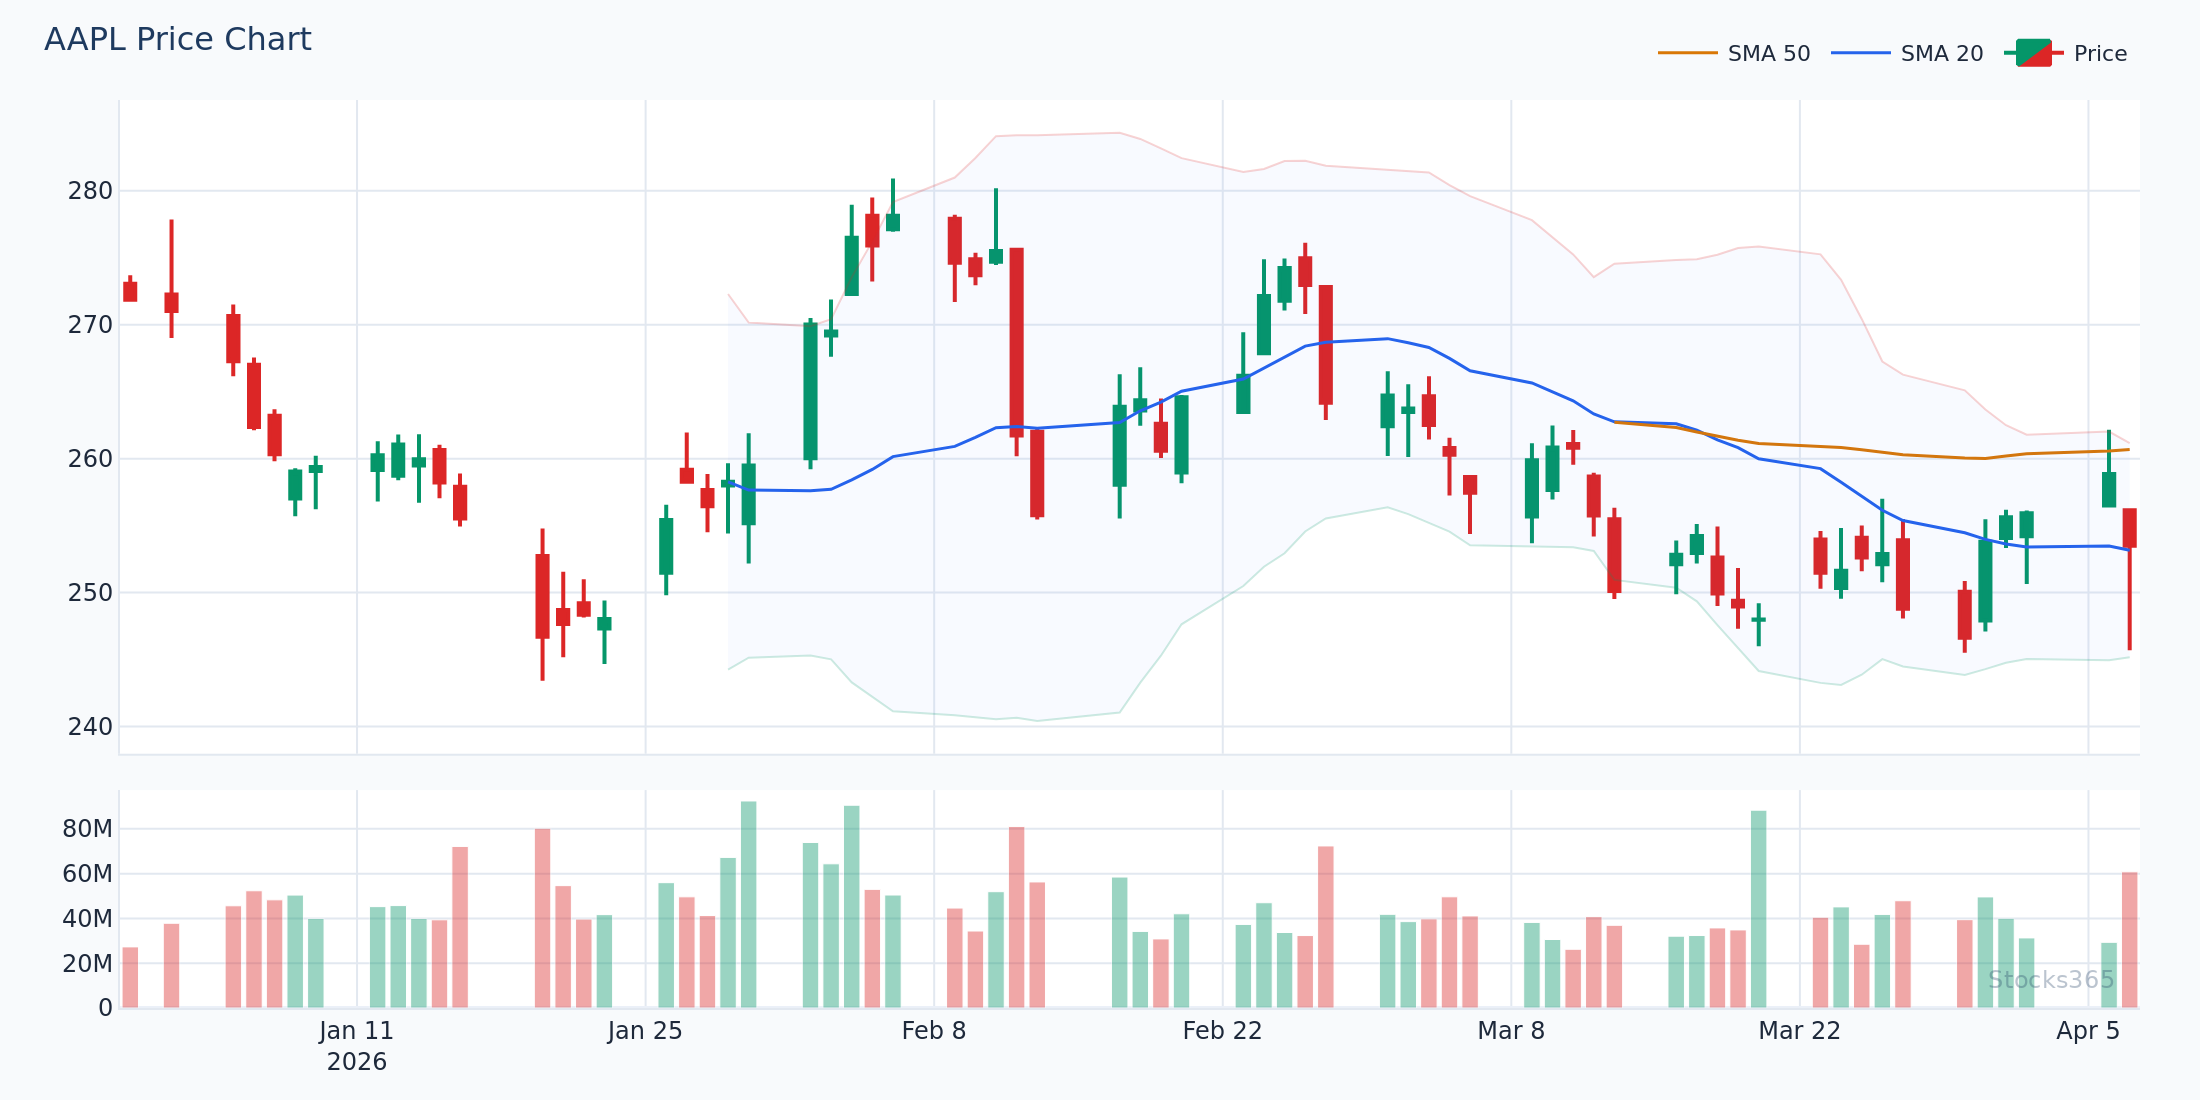
Real Case Study #2: AAPL — When MACD Warns Before the Drop
Apple (AAPL) provided a compelling example of MACD's bearish divergence warning capability. Understanding how to read these warning signs can be just as valuable — if not more so — than finding bullish entries.
The Setup
AAPL had been grinding higher in a steady uptrend, reaching the $248 area in mid-2026. However, as price pushed to new highs, the MACD histogram told a very different story: each successive price high was met with a lower histogram peak. Classic bearish divergence.
Reading the Warning
Experienced traders monitoring the AAPL signals on Stocks365 noticed the trust score for bullish continuation setups dropping from 74/100 to 58/100 over a two-week span — a reflection of deteriorating momentum confirmation beneath what appeared to be a strong price trend.
The bearish MACD signal line crossover that followed — with MACD crossing below the signal line after a prolonged above-zero run — was the confirmation trigger that momentum had decisively shifted.
- Observed top zone: $246 – $249
- MACD crossover confirmation: Approximately $244
- Subsequent correction low: $226 area
- Potential short or hedge entry: $243 – $245 on the crossover confirmation
Key Lesson
MACD divergence rarely gives you the exact top — but it tells you the engine is losing power before the car stalls. Pairing this with RSI analysis strengthens the read significantly. Our article on Hidden RSI Divergence: The Advanced Signal Most Traders Miss explores complementary divergence patterns that often appear alongside MACD warnings in real stock charts.
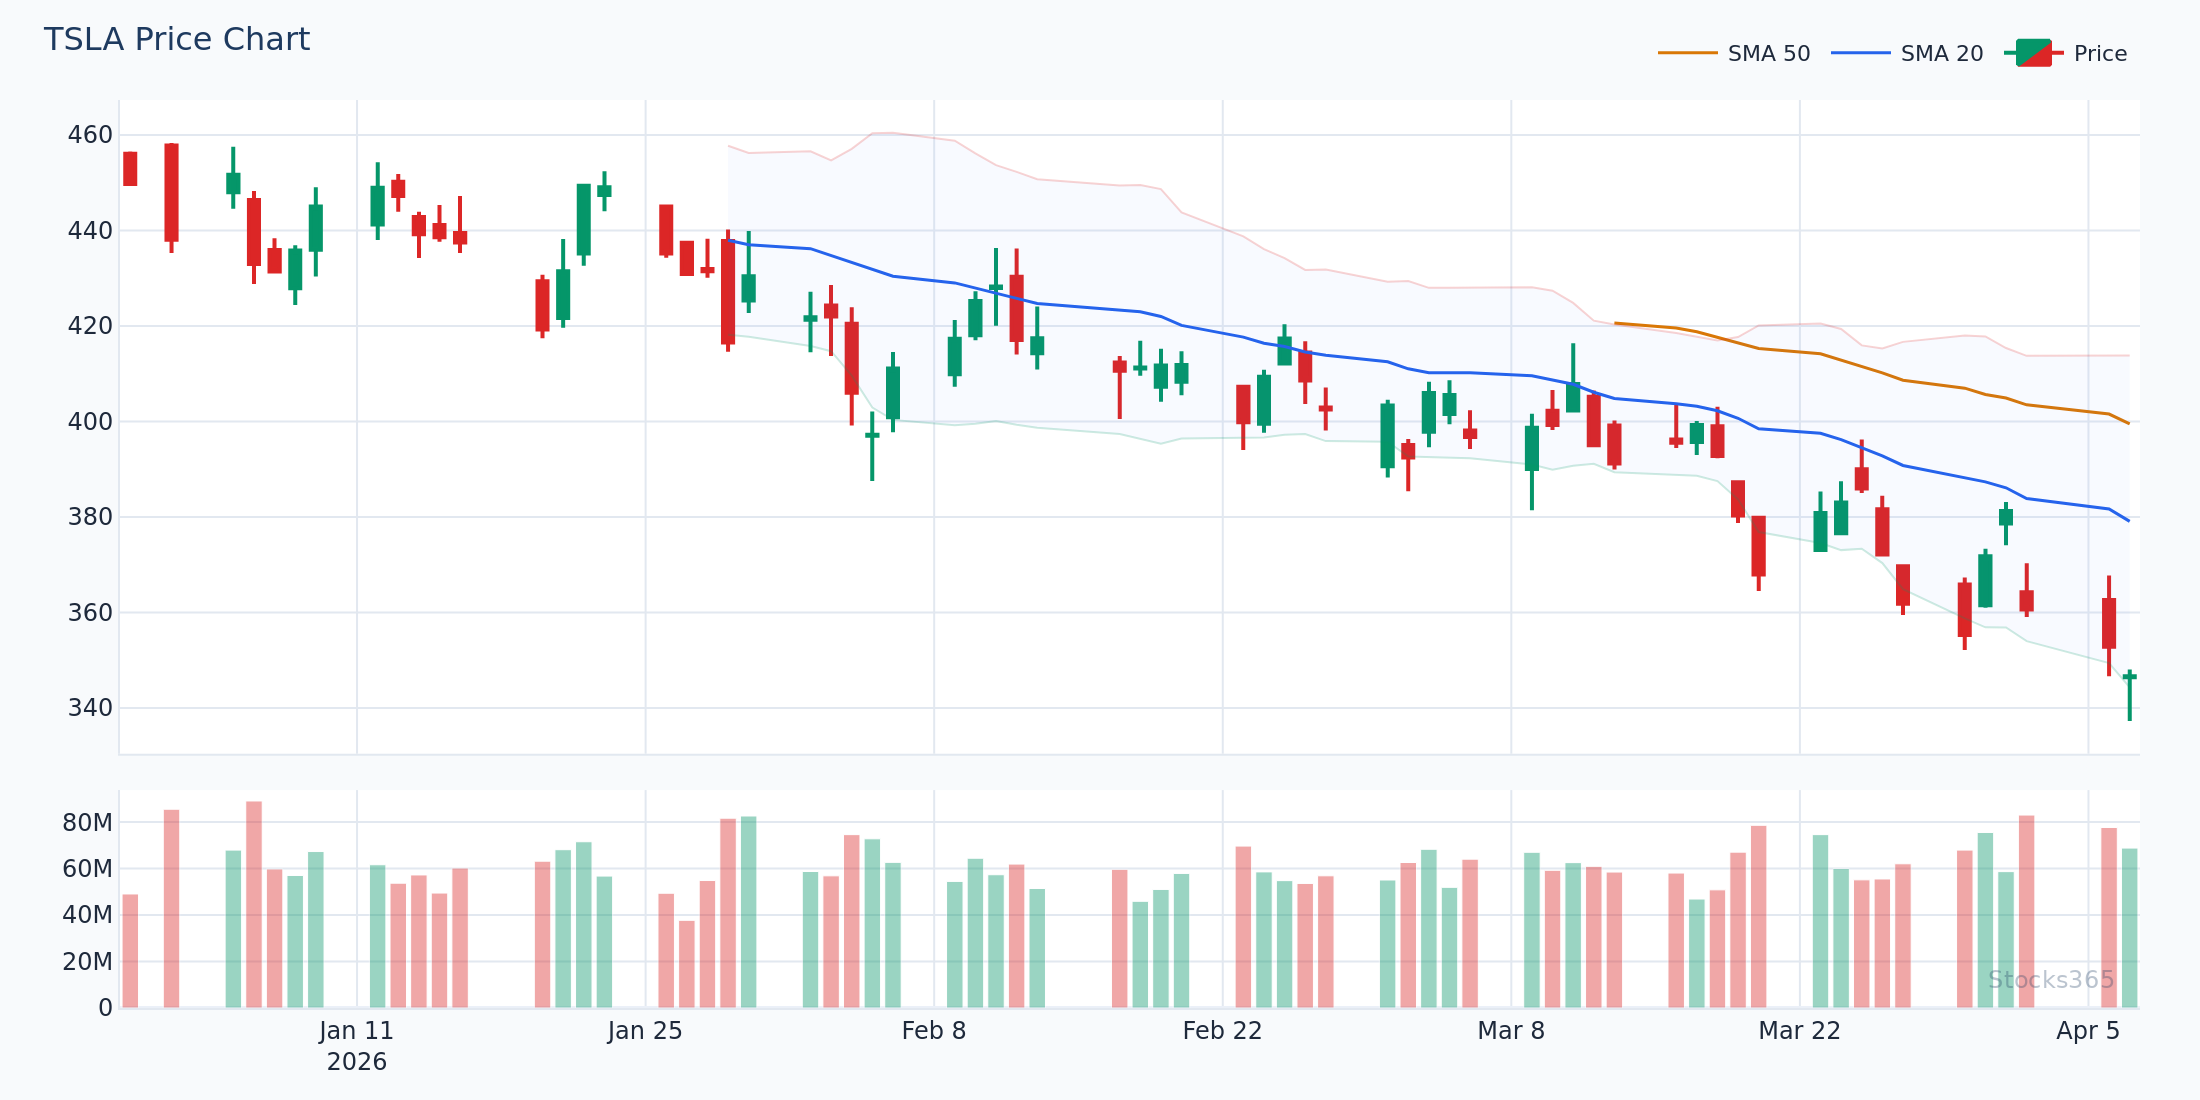
Real Case Study #3: TSLA — Zero-Line Crossover as Trend Filter
Tesla (TSLA) is notorious for violent swings and false signals — making it one of the most challenging stocks to trade with momentum indicators. This case study demonstrates how the zero-line cross acts as a crucial trend filter for high-volatility names.
The Challenge with TSLA
In the first half of 2026, TSLA experienced multiple MACD signal line crossovers — but many were head-fakes in a choppy, range-bound market. Traders who acted on every crossover got whipsawed repeatedly.
The Filtering Solution
The solution was applying a strict zero-line filter: only take bullish crossover signals when the MACD line subsequently crosses above zero. This eliminated the noise of crossovers that occurred in deeply negative territory without the follow-through of genuine trend establishment.
When TSLA's MACD line finally broke above zero in late Q2 2026 — after a legitimate bullish crossover from the $195 support zone — it marked the beginning of a sustained rally that took the stock toward $228.
- Confirmed entry (zero-line cross): ~$201
- Stop loss: $193 (below the base)
- Target: $224 – $230 range
- Result: ~13.4% gain over 3 weeks
Combining MACD with RSI: The Professional Edge
No indicator works in isolation. The most effective MACD strategy for stocks in 2026 combines MACD with the Relative Strength Index (RSI) to filter signals and avoid false entries.
Here's how the combination works in practice:
- MACD confirms trend direction and momentum shift (via crossover or zero-line break)
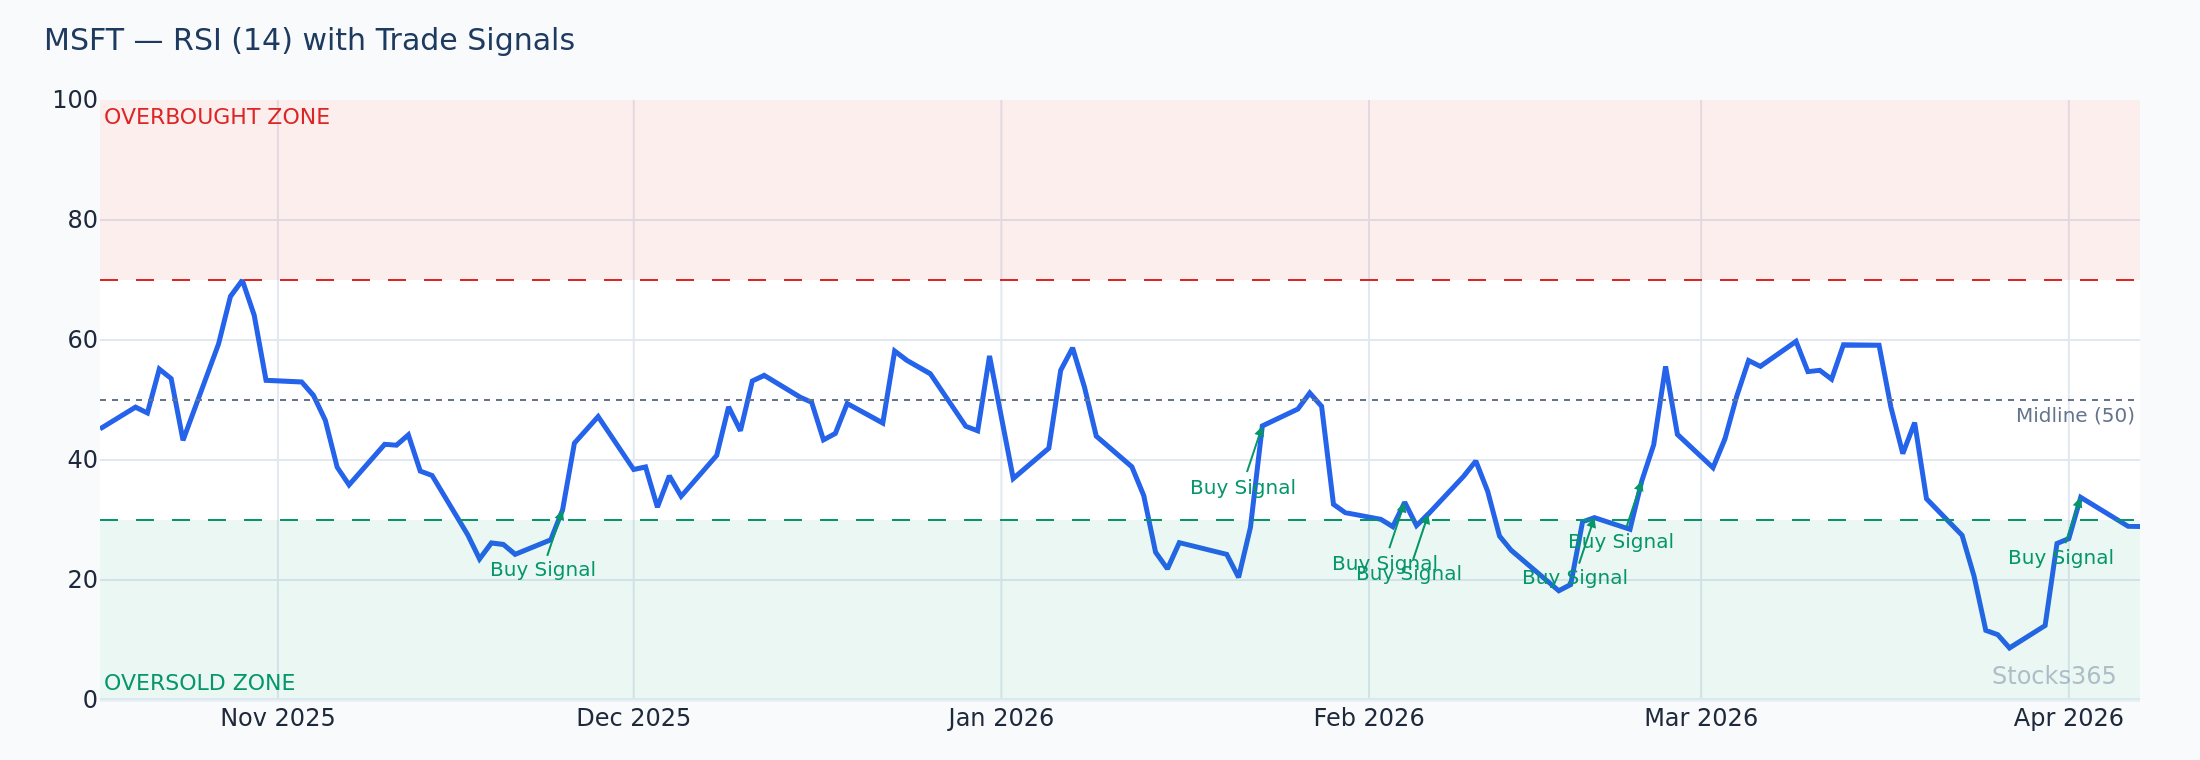
- RSI confirms overbought/oversold extremes — a bullish MACD crossover is far more powerful when RSI is simultaneously recovering from oversold territory (below 35)
- RSI divergence provides early warning that the MACD signal is likely imminent
For traders building this dual-indicator approach, Stocks365 offers comprehensive resources. Start with What Is RSI? The Complete Beginner's Guide if you're newer to RSI, then advance to How to Use RSI in Trading: The Ultimate Step-by-Step Guide to learn professional-level RSI applications.
For fine-tuning RSI parameters to complement your MACD setup, RSI Settings: Master the Best Period for Your Strategy covers how period adjustments affect signal frequency and reliability — essential knowledge for any momentum trader.
MACD + RSI: A Practical Checklist
Before entering any MACD-triggered trade, professional traders on Stocks365 run through this validation checklist:
- ✅ MACD signal line crossover confirmed (bullish above, bearish below)
- ✅ MACD histogram showing shrinking bars in the prior direction (momentum exhaustion)
- ✅ RSI not overbought (below 70) for longs, not oversold (above 30) for shorts — see RSI Overbought and Oversold Levels
- ✅ Volume expanding on the breakout candle
- ✅ Stocks365 trust score above 70/100
- ✅ Broader market trend aligned (S&P 500 / sector ETF trending in same direction)
MACD Settings: Default vs. Optimized for Different Timeframes
The standard MACD settings (12, 26, 9) work well for daily charts on most large-cap stocks. However, different trading styles benefit from adjusted parameters:
- Swing trading (daily chart): 12, 26, 9 — the industry standard, widely respected
- Short-term momentum (4H chart): 8, 21, 5 — faster signals with slightly more noise
- Position trading (weekly chart): 12, 26, 9 remains solid; some traders use 19, 39, 9 for smoother signals
- High-volatility stocks (TSLA, NVDA): Consider slightly longer settings (13, 30, 9) to reduce whipsaws
The same optimization principle applies to RSI — if you're interested in how period adjustments affect momentum indicator behavior, How RSI Is Calculated: Formula Explained Step by Step provides the mathematical foundation that makes these decisions intuitive rather than arbitrary.
Common MACD Mistakes That Cost Traders Money
Mistake #1: Trading Every Crossover
In trending markets, MACD crossovers are frequent and many are noise. Apply the zero-line filter and require histogram confirmation before acting. The TSLA case study above demonstrates exactly why this discipline matters.
Mistake #2: Ignoring the Broader Trend
A bullish MACD crossover in a stock that's in a confirmed downtrend on the weekly chart is a counter-trend trade — not a trend-following trade. The odds shift dramatically against you. Always check the higher timeframe context.
Mistake #3: Using MACD Alone
MACD is a trend-momentum indicator. It's not designed to identify support/resistance levels or measure volatility extremes. Combining it with RSI (for overbought/oversold confirmation) and volume (for conviction) transforms it from a good tool into a great system. Some traders also compare MACD with the Stochastic Oscillator to determine which momentum tool best suits their individual trading style.
Mistake #4: Setting Stops Too Tight
MACD signals play out over multiple candles. Stops placed too close to entry — inside normal price volatility — get triggered before the signal has time to materialize. Use the most recent swing high/low structure for stop placement, as demonstrated in each case study above.
Using Stocks365 to Validate Your MACD Strategy
Stocks365's trading intelligence platform integrates MACD analysis directly into its signal scoring engine. When you visit individual stock signal pages — like the AAPL signals page — the platform's trust score synthesizes MACD momentum data alongside RSI readings, volume patterns, and broader market context into a single, actionable confidence metric.
A trust score above 75/100 on a MACD setup indicates that multiple technical factors are aligned — not just the indicator in isolation. This is particularly valuable for traders who are learning to develop their own judgment, as it provides a reference point grounded in multi-factor analysis rather than a single indicator view.
The Stocks365 signals dashboard also allows traders to filter for stocks currently generating MACD crossover signals across different sectors and market caps, helping you identify the highest-quality setups without manually scanning hundreds of charts.
Frequently Asked Questions
What is the best MACD strategy for stocks?
The most consistently effective MACD strategy for stocks combines signal line crossovers with zero-line filtering and divergence analysis. Rather than acting on every crossover, wait for the MACD line to confirm the new direction by crossing the zero line. Add RSI confirmation and volume expansion as secondary filters, and you have a strategy with a significantly improved win rate compared to raw crossover trading.
What MACD settings work best for stock trading?
The default settings of 12, 26, 9 remain the most widely used and respected for daily stock charts. For swing trading, these settings offer a solid balance between responsiveness and noise reduction. High-volatility stocks like TSLA or NVDA may benefit from slightly longer periods (13, 30, 9) to reduce false signals. Always backtest any parameter changes against the specific stocks you trade.
How do I use MACD divergence to find reversals?
MACD divergence occurs when price makes a new high (or low) that is not confirmed by a corresponding new high (or low) in the MACD histogram. Bullish divergence — price making lower lows while MACD makes higher lows — suggests selling exhaustion and a potential upward reversal. Bearish divergence — price making higher highs while MACD makes lower highs — warns of buying exhaustion. These signals are most reliable when they appear at established support or resistance levels.
Can MACD be used alone, or does it need other indicators?
While MACD can generate standalone signals, it performs significantly better when combined with complementary indicators. RSI is the most popular pairing — MACD identifies trend and momentum direction while RSI measures overbought/oversold extremes. Volume analysis adds conviction validation. Using MACD alone increases exposure to false signals, particularly in choppy, range-bound market conditions.
How is MACD different from RSI for stock trading?
MACD is a trend-following momentum indicator that measures the relationship between two moving averages — it excels at identifying the direction and strength of momentum. RSI is an oscillator that measures the speed and magnitude of price changes relative to recent history — it excels at identifying overbought and oversold extremes. The two indicators are complementary rather than redundant: MACD tells you where momentum is going, while RSI tells you how stretched it is. Together, they form one of the most robust signal frameworks available to stock traders.