
MACD vs EMA: Understanding the Core Relationship Every Trader Needs to Know
If you've spent any time studying technical analysis, you've almost certainly encountered two of its most powerful tools: the Moving Average Convergence Divergence (MACD) and the Exponential Moving Average (EMA). While many traders treat these as separate indicators, the truth is far more interesting — MACD is actually built from EMAs. Understanding this core relationship is the key to unlocking smarter, more confident trading decisions.
In this comprehensive guide, we'll break down exactly how MACD and EMA relate to one another, how each functions independently, and how combining your understanding of both can sharpen your edge in today's fast-moving markets. Whether you're trading equities, ETFs, or using a platform like Stocks365's signals dashboard to identify high-probability setups, this knowledge will fundamentally change how you read price action.
Key Insight: MACD is not an alternative to EMA — it is a derivative of EMA. Understanding one deeply means understanding both.
What Is the EMA? The Foundation of Modern Momentum Analysis
The Exponential Moving Average (EMA) is a type of moving average that places greater weight on recent price data. Unlike a simple moving average (SMA), which treats every data point equally, the EMA reacts more quickly to new price information — making it particularly valuable for active traders who need timely signals.
How the EMA Is Calculated
The EMA uses a multiplier to weight recent prices more heavily. The formula is:
- Multiplier: 2 ÷ (Number of periods + 1)
- EMA: (Current Close × Multiplier) + (Previous EMA × (1 − Multiplier))
For example, a 12-period EMA on a daily chart assigns roughly 15.4% weight to today's closing price. A 26-period EMA assigns approximately 7.4% weight. This difference in sensitivity is exactly what makes the MACD so powerful — and we'll explain why shortly.
Common EMA Settings Traders Use in 2026
In today's algorithmic and retail trading environment, the most commonly used EMA periods include:
- 9 EMA: Extremely fast-reacting; used for short-term momentum by day traders
- 21 EMA: Popular among swing traders for identifying intermediate trends
- 50 EMA: A widely watched medium-term trend indicator
- 200 EMA: The gold standard for long-term trend direction
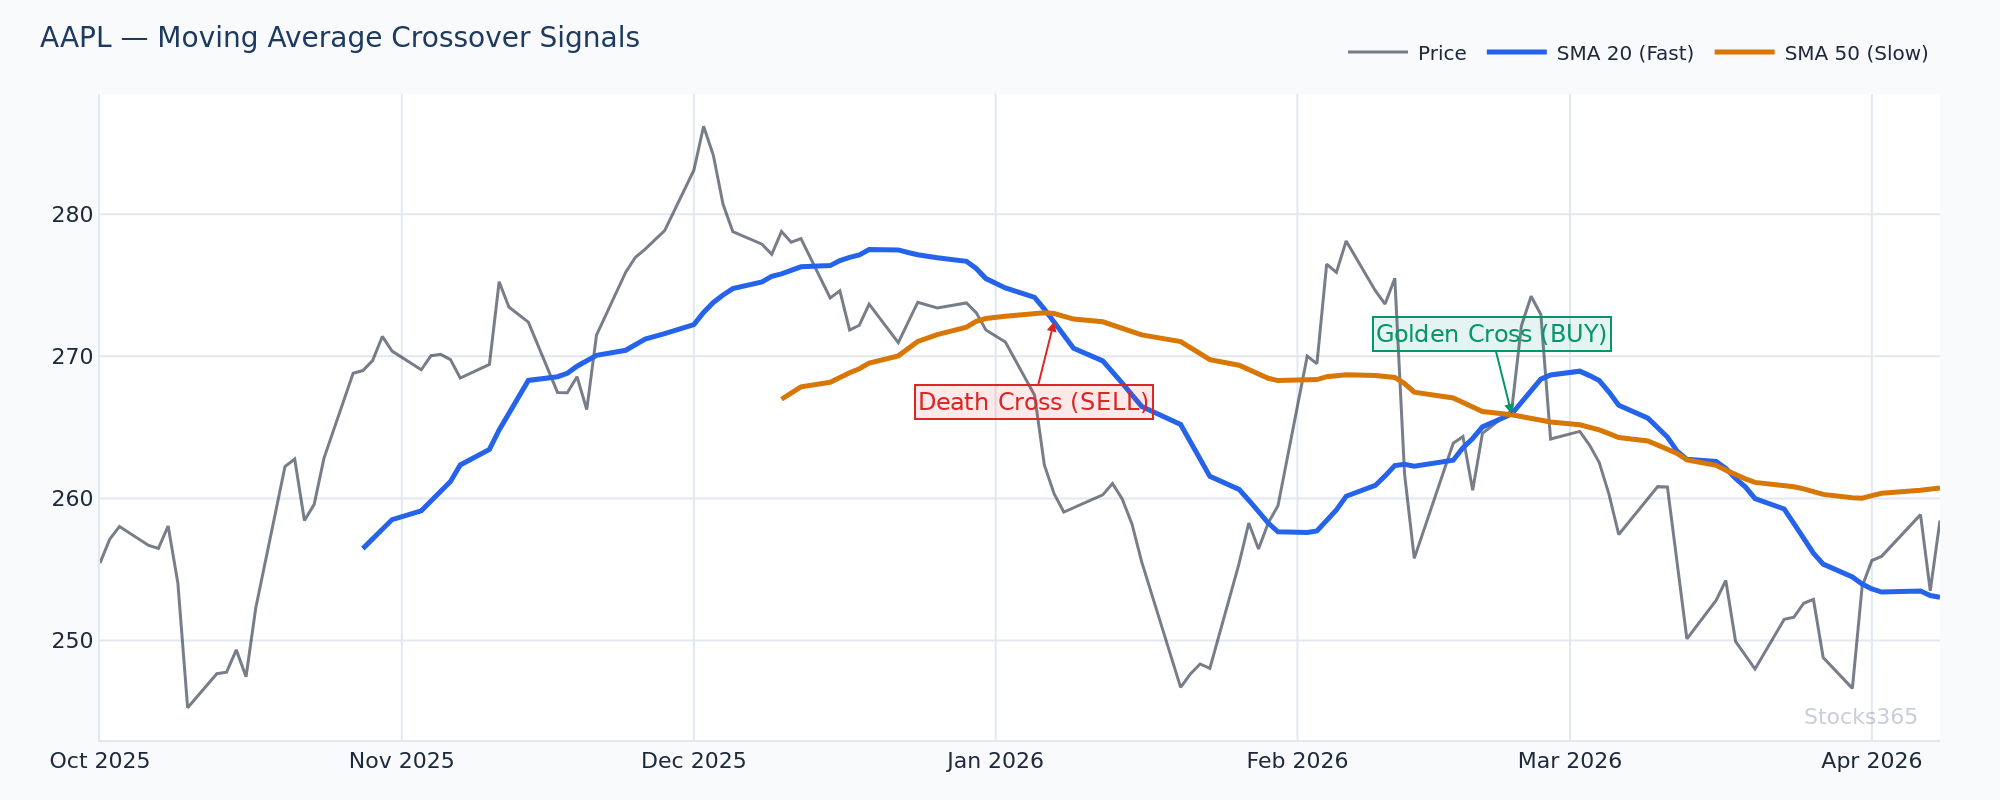
When a shorter EMA crosses above a longer EMA — commonly called a "golden cross" — it often signals bullish momentum. The reverse, a "death cross," signals bearish pressure. These crossovers are intuitive and widely respected, but they're just the beginning of what EMA analysis can offer.
What Is the MACD? EMA in Its Most Powerful Form
The MACD, developed by Gerald Appel in the late 1970s, is one of the most widely used momentum indicators in technical analysis. But here's what many traders don't realize: the MACD is constructed entirely from exponential moving averages. It doesn't just use EMAs — it is EMAs, expressed in a more sophisticated way.
The Three Components of MACD Explained
The MACD indicator consists of three distinct elements, all EMA-derived:
- MACD Line: The difference between the 12-period EMA and the 26-period EMA (12 EMA − 26 EMA)
- Signal Line: A 9-period EMA of the MACD Line itself
- Histogram: The difference between the MACD Line and the Signal Line, visualized as bars
This layered structure is what gives MACD its analytical depth. The MACD Line tells you whether short-term momentum is outpacing long-term momentum. The Signal Line smooths that reading. And the Histogram shows you exactly how wide or narrow the gap between them is — giving you real-time insight into momentum acceleration or deceleration.
"The MACD is essentially a visual representation of two EMAs breathing — expanding and contracting around each other as price momentum shifts."
MACD vs EMA: Key Differences That Matter for Trading
Now that we understand both indicators, let's directly compare MACD vs EMA across the dimensions that matter most to traders making real decisions in live markets.
1. Signal Type: Trend Following vs Momentum Measurement
The EMA, when used as a standalone tool, is primarily a trend-following indicator. It tells you the direction of the trend by showing the average price over a given period. When price is above the EMA, bulls are in control. When price is below, bears dominate.
The MACD, by contrast, is a momentum oscillator. It doesn't just tell you the direction — it tells you how fast momentum is changing. A MACD moving toward zero from negative territory suggests weakening bearish momentum even before price crosses a moving average. This is an early warning system that EMA crossovers alone can't provide.
2. Lag and Responsiveness
Both MACD and EMA are lagging indicators by nature — they're based on historical price data. However, MACD's construction introduces a nuance: by comparing two EMAs of different lengths, it actually captures the rate of change rather than absolute price. This makes MACD more dynamic than a single EMA, even though it's technically built from them.
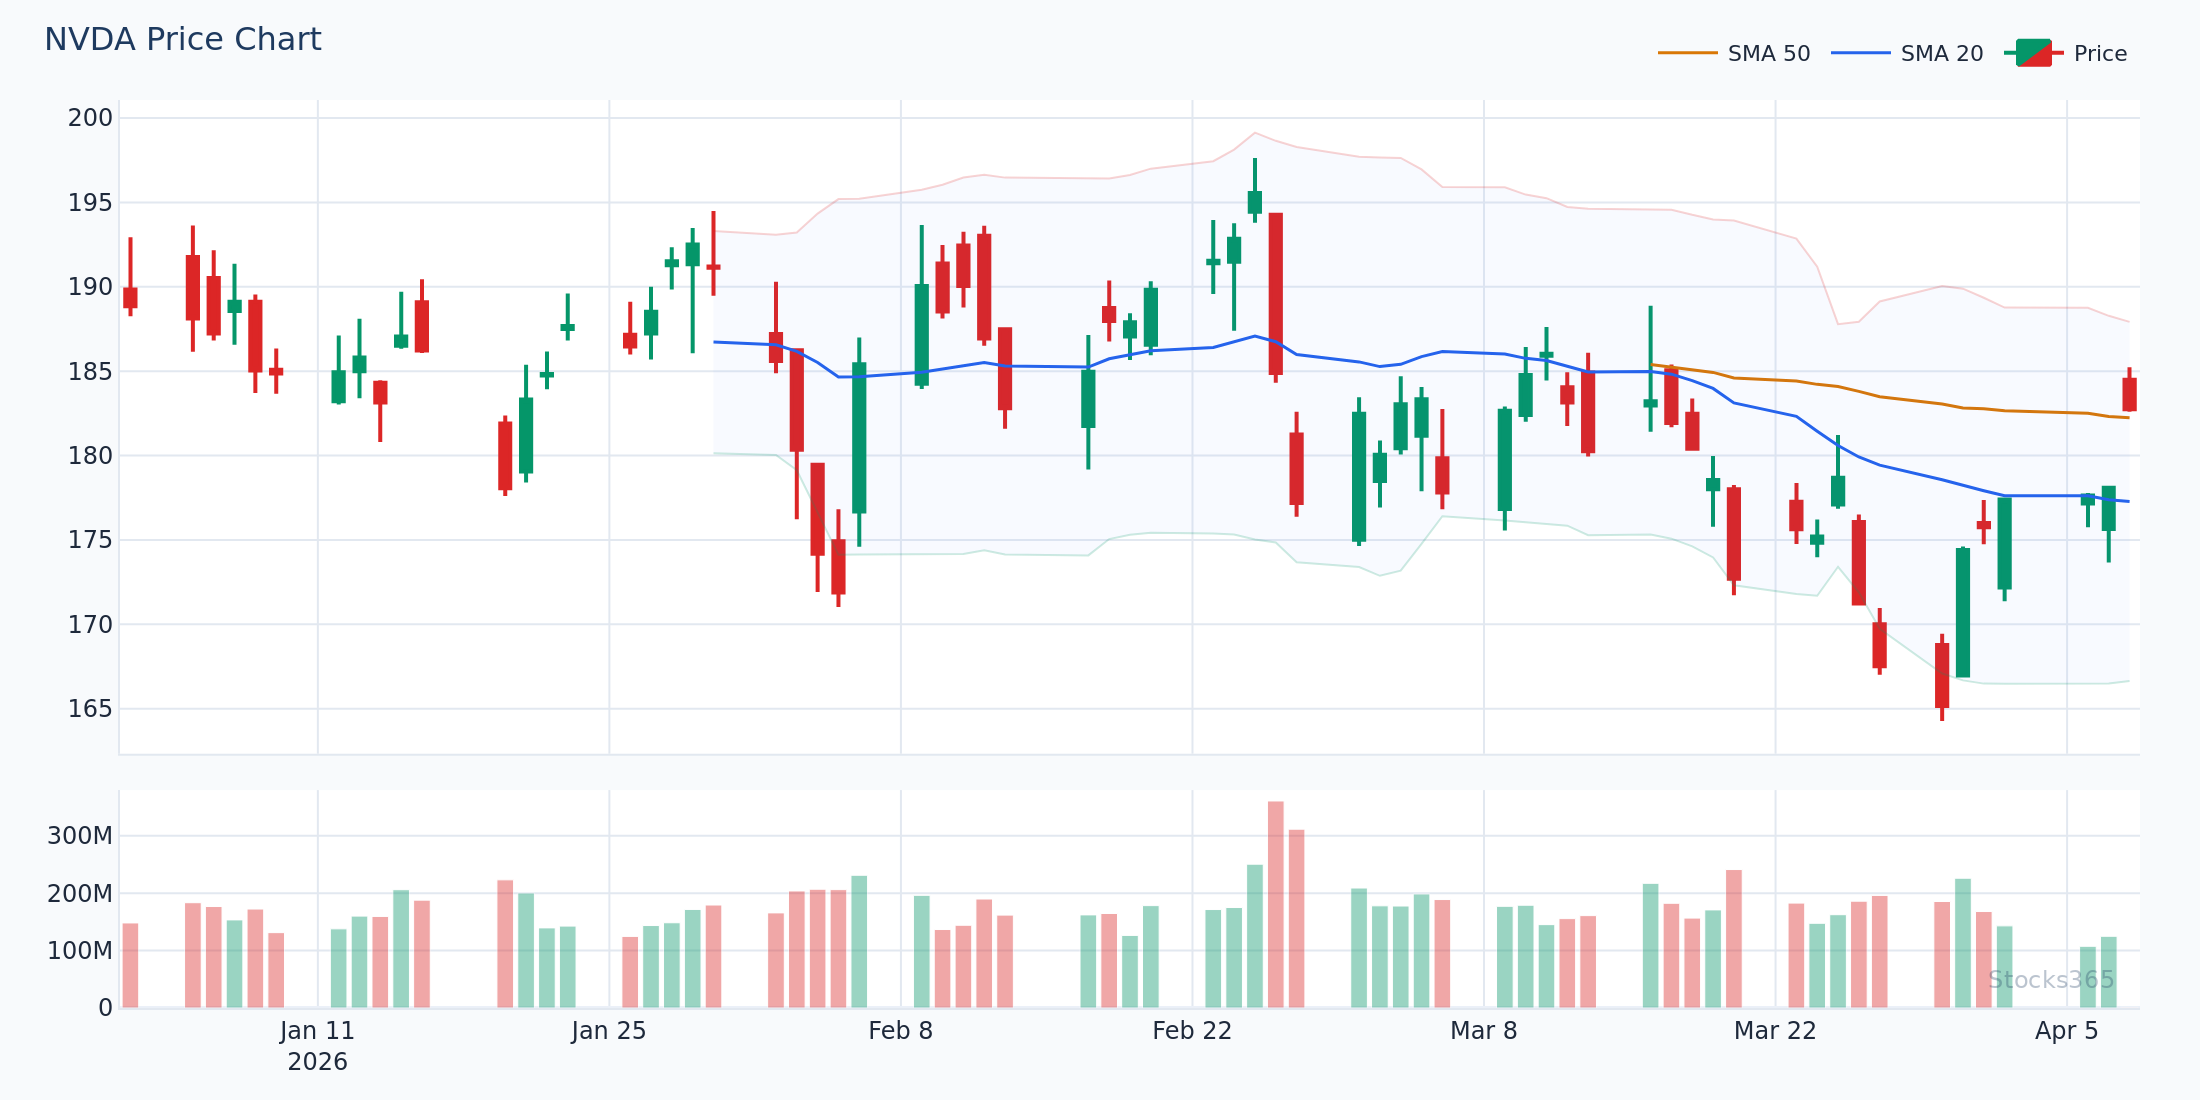
For example, on an NVDA daily chart in early 2026, the 12 EMA might still be above the 26 EMA (a bullish signal), but if the MACD histogram is shrinking rapidly, an experienced trader using the Stocks365 trust score system would see that momentum is weakening — often before a visible crossover occurs on the chart.
3. Visual Interpretation
EMAs are plotted directly on the price chart, making them visually intuitive. Traders can see at a glance where price is relative to its moving average. MACD, on the other hand, lives in a separate panel below the chart, which means traders must mentally connect the oscillator readings to price action above.
This difference matters practically. When scanning for signals on a stock like AAPL, a trader might glance at the EMA first to determine trend context, then look at the MACD to confirm momentum alignment — using both tools in sequence rather than isolation.
4. Crossover Signals: EMA Cross vs MACD Cross
Both indicators generate crossover signals, but they differ in meaning:
- EMA Crossover: When a shorter EMA (e.g., 20-period) crosses above a longer EMA (e.g., 50-period), it suggests a shift in trend direction
- MACD Crossover: When the MACD Line crosses above the Signal Line, it suggests a shift in momentum, which often precedes a visible price trend change
The MACD crossover typically occurs earlier than an EMA crossover because it's measuring the acceleration of the spread between two EMAs, not waiting for price averages themselves to cross. This makes MACD crossovers a valuable leading signal relative to EMA crossovers — though both are subject to false signals in choppy, sideways markets.
How MACD and EMA Work Together: A Practical Trading Framework
The most effective use of MACD and EMA is not choosing one over the other — it's using them together in a layered analysis framework. Here's a practical approach used by professional traders in 2026:
Step 1: Use EMA to Define Trend Context
Start with the big picture. Apply a 50 EMA and 200 EMA to your chart. If price is above both and the 50 EMA is above the 200 EMA, you're in a bullish macro trend. Only take long entries aligned with this context.
Example: MSFT in Q1 2026 is trading at $485, with the 50 EMA at $462 and the 200 EMA at $441. Both EMAs are rising and price is above both — the macro trend is bullish. This is your permission slip to look for long entries.
Step 2: Use MACD to Time Your Entry
With trend context established, switch to MACD for precise entry timing. Wait for the MACD Line to cross above the Signal Line while the MACD is below zero (a particularly powerful setup, as it suggests the momentum reversal is happening from an oversold momentum state).
Example: MSFT pulls back to $470, and the MACD dips below zero before crossing back above the Signal Line. This MACD bullish crossover in negative territory, within an uptrend defined by the EMAs, creates a high-probability long entry. A trader might enter at $472 with a stop below the 50 EMA at $460.
Step 3: Use EMA as a Dynamic Stop-Loss Level
The EMA serves a second practical function beyond trend identification — it acts as a dynamic support or resistance level. Experienced traders use the 21 EMA or 50 EMA as a trailing stop reference. As long as price holds above the chosen EMA, the trade is managed with a trailing stop. A close below the EMA triggers an exit review.
Step 4: Watch the MACD Histogram for Exit Signals
When the MACD histogram begins shrinking — even before a crossover — momentum is fading. This is a signal to tighten stops or begin scaling out of a position. The histogram's deceleration often precedes price turning by several candles, giving you valuable lead time.
This kind of layered, multi-indicator analysis is exactly what sophisticated trading platforms integrate. The Stocks365 signals dashboard cross-references momentum signals with trend context to surface the highest-conviction setups, using a trust score system that weighs multiple technical factors — including MACD and EMA alignment — simultaneously.
MACD Divergence: Where EMA Knowledge Becomes Essential
One of the most powerful MACD signals — divergence — becomes even more meaningful when you understand the EMA relationship underneath it. MACD divergence occurs when the MACD Line moves in the opposite direction of price.
- Bullish MACD Divergence: Price makes lower lows, but the MACD makes higher lows — suggesting the 12 EMA is gaining ground on the 26 EMA even as price falls, indicating weakening selling pressure
- Bearish MACD Divergence: Price makes higher highs, but the MACD makes lower highs — suggesting the 12 EMA is losing momentum relative to the 26 EMA even as price rises
This concept of divergence is also central to RSI analysis. If you want to deepen your understanding of divergence signals across multiple indicators, the guide on RSI Divergence: Mastering Bullish & Bearish Signals offers an excellent parallel framework. Additionally, advanced traders who want to go further should explore Hidden RSI Divergence: The Advanced Signal Most Traders Miss — the hidden divergence concept applies equally to MACD analysis.

Common Mistakes When Using MACD vs EMA
Understanding the relationship between MACD and EMA also means understanding where traders go wrong when using them.
Mistake 1: Using MACD Without Trend Context
MACD works best in trending markets. In a sideways, range-bound environment, the MACD will generate repeated crossovers that produce whipsaws and false entries. Always establish trend context with EMAs first. If the 50 EMA and 200 EMA are flat and intertwined, MACD signals carry significantly less reliability.
Mistake 2: Treating Every EMA Crossover as a Major Signal
Not all EMA crossovers are created equal. A 9 EMA crossing a 21 EMA on a 5-minute chart carries very different weight than a 50 EMA crossing a 200 EMA on a weekly chart. Always context-match your EMA settings to your trading timeframe and confirm with MACD momentum before acting.
Mistake 3: Ignoring the Zero Line on MACD
The MACD's zero line is where the 12 EMA and 26 EMA are equal. Crossovers above zero signal that the short-term EMA is now above the long-term EMA (bullish momentum). Crossovers below zero are bearish. Many traders focus only on the MACD vs Signal Line crossover and miss the zero line context entirely — a significant analytical gap.
Mistake 4: Overcomplicating with Too Many EMAs
Some traders add 5, 6, or more EMAs to their chart alongside MACD. This creates visual noise and conflicting signals. A clean framework — two EMAs for trend context, MACD for momentum timing — is far more actionable than a cluttered chart.
MACD vs EMA: Integrating with Other Indicators
While MACD and EMA form a powerful pair, adding one more complementary indicator can significantly enhance your analysis. The Relative Strength Index (RSI) is the most popular companion.
RSI measures momentum on a different scale (0–100) and provides overbought/oversold context that neither MACD nor EMA offers directly. When all three align — price above key EMAs (trend bullish), MACD bullish crossover (momentum confirming), and RSI recovering from oversold without being overbought — you have a three-layer confirmation that dramatically increases signal quality.
If you're new to RSI, the Complete Beginner's Guide to RSI is the ideal starting point. For understanding how RSI levels function as signals, RSI Overbought and Oversold Levels: Master the Signals provides detailed context. And for practical application, How to Use RSI in Trading: The Ultimate Step-by-Step Guide walks through real trade examples.
Understanding how RSI is mathematically constructed — covered in depth at How RSI Is Calculated: Formula Explained Step by Step — will also help you appreciate why RSI and MACD sometimes diverge, since they measure momentum through fundamentally different lenses. For comparing RSI against other oscillators in your toolkit, RSI vs Stochastic Oscillator: The Essential Guide is highly recommended reading. And if you want to fine-tune your RSI settings to match your trading style, RSI Settings: Master the Best Period for Your Strategy offers actionable guidance.
Key Takeaways
📊 MACD vs EMA — Summary of Core Insights:
- MACD is built from EMAs — specifically the 12-period and 26-period EMAs, plus a 9-period EMA Signal Line
- EMA identifies trend direction; MACD measures momentum and its rate of change
- MACD crossovers often lead EMA crossovers — use MACD for earlier entry signals within an EMA-confirmed trend
- The MACD histogram reveals momentum acceleration or deceleration — shrinking bars warn of trend exhaustion before price reverses
- The MACD zero line corresponds to the point where the 12 EMA equals the 26 EMA — cross-referencing this level adds critical context
- Use EMA for dynamic stop-loss placement — the 21 or 50 EMA acts as natural support in uptrends
- Combine both with RSI for three-layer confirmation that significantly improves signal reliability
- MACD works best in trending markets — always confirm trend with EMAs before acting on MACD signals
Frequently Asked Questions
Is MACD better than EMA for trading?
Neither MACD nor EMA is universally "better" — they serve different analytical purposes. EMA defines trend direction and acts as dynamic support/resistance, while MACD measures momentum and provides earlier entry signals. The most effective approach is using them together: EMA for trend context, MACD for timing entries and exits.
What EMAs make up the MACD indicator?
The standard MACD uses three EMAs: a 12-period EMA, a 26-period EMA, and a 9-period EMA. The MACD Line is calculated as the 12 EMA minus the 26 EMA. The Signal Line is a 9-period EMA of the MACD Line. The Histogram shows the difference between the MACD Line and Signal Line.
Can I use MACD and EMA on the same chart?
Absolutely — and it's highly recommended. Plot your EMAs (commonly 50 and 200 period) directly on the price chart to establish trend context, then reference the MACD in a separate panel below to time entries and exits. This two-layer approach is standard practice among professional traders and is integrated into platforms like Stocks365.
Why do MACD signals sometimes appear before EMA crossovers?
MACD measures the rate of change in the relationship between two EMAs, not the EMAs themselves crossing price. Because it captures momentum acceleration, the MACD Line crossing its Signal Line often occurs before the underlying EMAs cross each other on the price chart. This makes MACD a leading signal relative to traditional EMA crossovers.
What is the MACD zero line and why does it matter?
The MACD zero line represents the point where the 12-period EMA and 26-period EMA are exactly equal. When the MACD Line is above zero, the short-term EMA is above the long-term EMA — indicating bullish momentum. Below zero indicates the reverse. MACD crossovers of the Signal Line that occur near the zero line carry different weight than those occurring far from it, and many experienced traders treat zero-line crossovers as significant trend confirmation signals in their own right.