
MACD vs RSI: The Ultimate Momentum Indicator Showdown
If you've spent any time studying technical analysis, you've almost certainly encountered the debate: MACD vs RSI. These two momentum indicators are among the most widely used tools in a trader's arsenal — but they measure momentum in fundamentally different ways, serve different purposes, and shine in different market conditions.
The truth is, asking "which is better?" is a bit like asking whether a hammer or a screwdriver is the better tool. The answer depends entirely on what you're trying to build. In this comprehensive guide, we'll break down exactly how each indicator works, where each excels, where each fails, and — most importantly — how professional traders use them together to generate high-probability trade setups in 2026's fast-moving markets.
Key Insight: MACD and RSI are not competitors — they are complements. Understanding when to rely on each one is what separates consistently profitable traders from the rest.
What Is RSI? A Quick Refresher
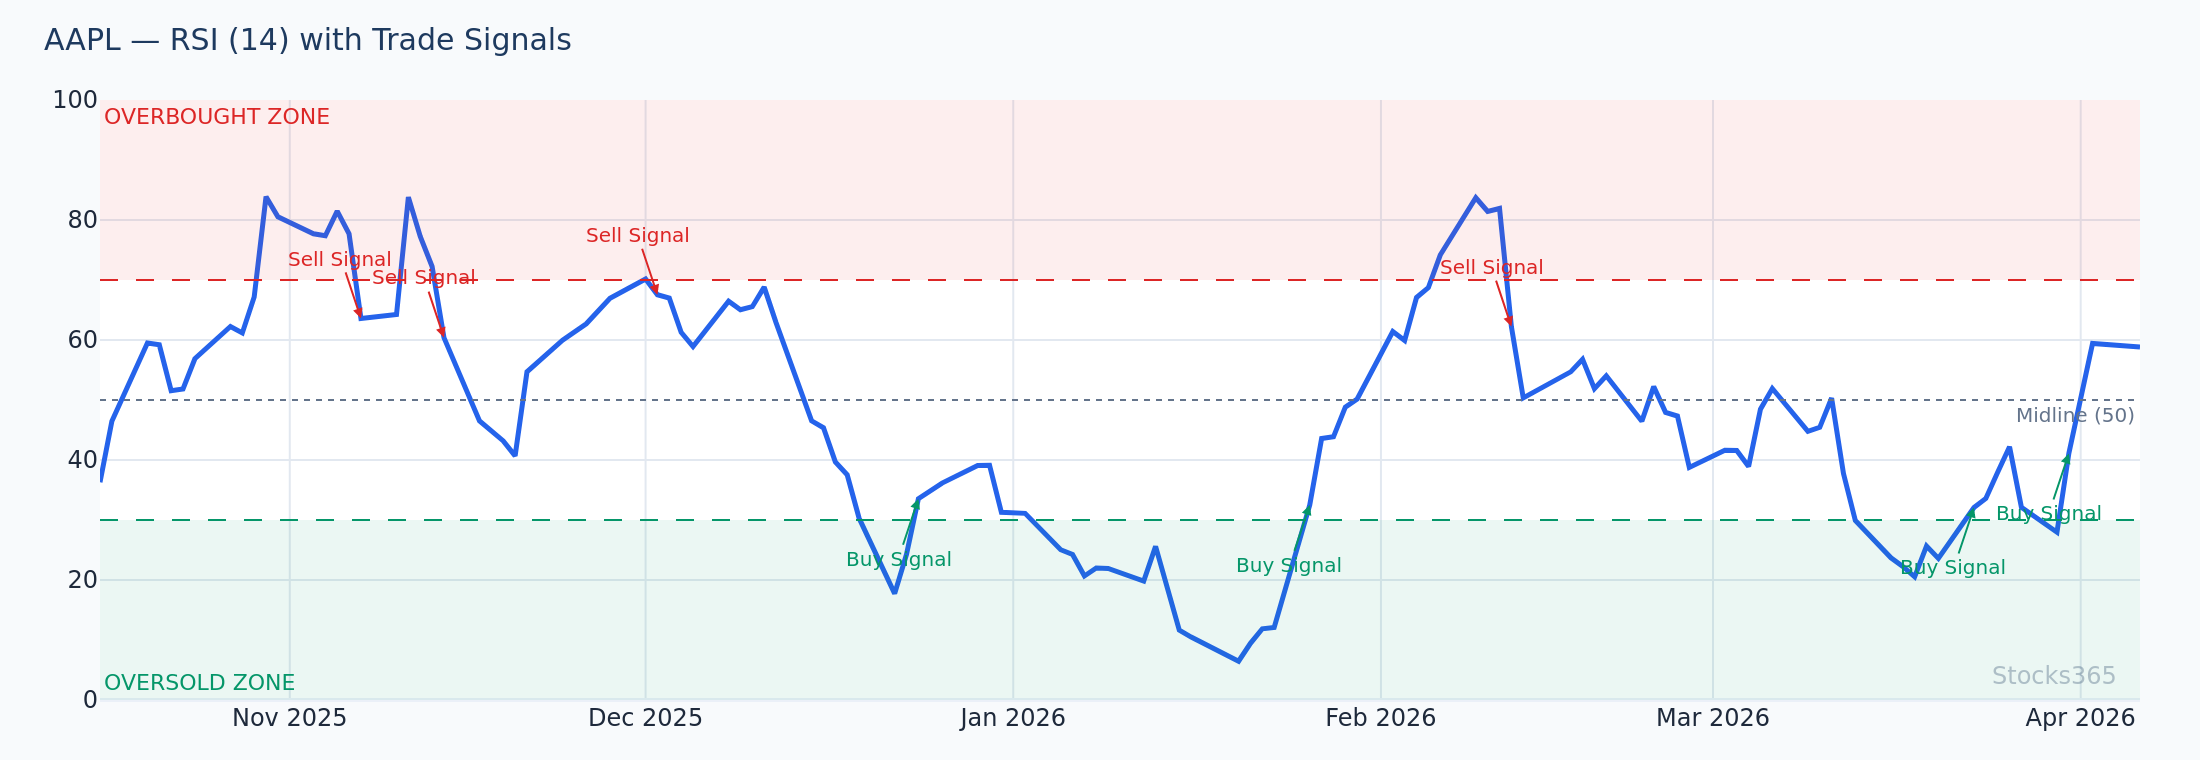
The Relative Strength Index (RSI) is a bounded oscillator that measures the speed and magnitude of recent price changes to evaluate overbought or oversold conditions. Developed by J. Welles Wilder Jr. and introduced in 1978, RSI oscillates between 0 and 100.
The most common interpretation is straightforward:
- RSI above 70 — the asset may be overbought and due for a pullback
- RSI below 30 — the asset may be oversold and due for a bounce
- RSI near 50 — neutral momentum, neither strongly bullish nor bearish
If you want to understand the full mechanics behind this calculation, our guide on How RSI Is Calculated: Formula Explained Step by Step walks through every variable in detail. And for those just getting started, What Is RSI? The Complete Beginner's Guide is the perfect starting point.
RSI's bounded nature (0–100) is one of its greatest strengths — it gives traders an immediate, intuitive read on whether momentum is stretched to an extreme. However, this same feature can be a limitation in strongly trending markets, where RSI can remain "overbought" for extended periods without any meaningful reversal.
What Is MACD? Core Concepts Explained
The Moving Average Convergence Divergence (MACD) indicator, developed by Gerald Appel in the late 1970s, works in a fundamentally different way from RSI. Rather than measuring the ratio of gains to losses over a fixed period, MACD tracks the relationship between two exponential moving averages (EMAs) of price.
The standard MACD setup consists of three components:
- MACD Line — the difference between the 12-period EMA and the 26-period EMA
- Signal Line — a 9-period EMA of the MACD line itself
- Histogram — the visual representation of the gap between the MACD line and the signal line
Unlike RSI, MACD is unbounded — it can move to any value, positive or negative, depending on the price spread between the two EMAs. This makes MACD particularly effective at identifying trend direction, momentum shifts, and the strength of a trend in progress.
The three primary MACD signals traders watch for are:
- Signal line crossovers — when the MACD line crosses above or below the signal line
- Zero line crossovers — when the MACD line crosses above or below zero, indicating a potential trend change
- Divergence — when the MACD makes a different pattern than price, hinting at a potential reversal
MACD vs RSI: Key Differences Compared Side by Side
Understanding the structural differences between MACD and RSI is essential before deciding which to apply in any given trading scenario. Here's how they compare across the most important dimensions:
1. What They Actually Measure
RSI measures the velocity of price movement — specifically, the average gain versus average loss over a set lookback period (default: 14 periods). It answers the question: "How fast and how far has price moved relative to its recent history?"
MACD measures the convergence and divergence of two moving averages. It answers the question: "Is momentum accelerating or decelerating, and in which direction?"
2. Bounded vs Unbounded
RSI is confined to a 0–100 scale, making it immediately interpretable as a percentage-like reading. MACD has no fixed scale — its values depend entirely on the price level of the asset being analyzed. A MACD reading of 2.5 on a $10 stock has very different significance than a reading of 2.5 on a $500 stock.
3. Trend Following vs Mean Reversion
MACD leans toward being a trend-following indicator — it performs best when markets are trending and can help traders stay in a move longer. RSI leans toward mean reversion — it helps identify when price has stretched too far and a pullback is likely. This is one of the most important distinctions in the MACD vs RSI debate.
4. Signal Speed
RSI, especially at its default 14-period setting, tends to react relatively quickly to sharp price moves. MACD, using longer-period EMAs (12 and 26), is inherently a slower indicator that filters out more noise. Traders who want faster signals can adjust RSI to a shorter period — our article on RSI Settings: Master the Best Period for Your Strategy covers exactly how to do this.
5. Divergence Signals
Both indicators generate divergence signals, but they do so differently. RSI divergence — particularly hidden divergence — is widely regarded as one of the most reliable reversal signals in technical analysis. To learn more, read our deep dives on RSI Divergence Explained: Master Bullish & Bearish Signals and Hidden RSI Divergence: The Advanced Signal Most Traders Miss. MACD divergence also works well, especially on higher timeframes, but RSI divergence tends to generate more actionable setups on intraday and daily charts.
When MACD Outperforms RSI
MACD shines in specific market environments. Knowing when to lean on MACD over RSI can meaningfully improve your win rate.
Strong Trending Markets
Consider NVDA in early 2026 during its AI infrastructure expansion rally. RSI spent weeks above 70 — technically "overbought" — yet the stock continued climbing from $180 to $240. Traders relying solely on RSI overbought readings would have been stopped out repeatedly or missed the entire move. MACD, however, maintained a bullish histogram throughout this period, signaling sustained upward momentum. In strongly trending conditions, MACD's trend-following nature is a clear advantage.
Identifying Momentum Acceleration
The MACD histogram is particularly powerful for identifying when momentum is accelerating or decelerating before price confirms the shift. When the histogram begins shrinking — bars getting progressively smaller — it often signals that the prevailing trend is losing steam, even if price hasn't yet reversed. This gives traders a heads-up to tighten stops or reduce position size before a pullback materializes.
Swing Trading on Daily and Weekly Charts
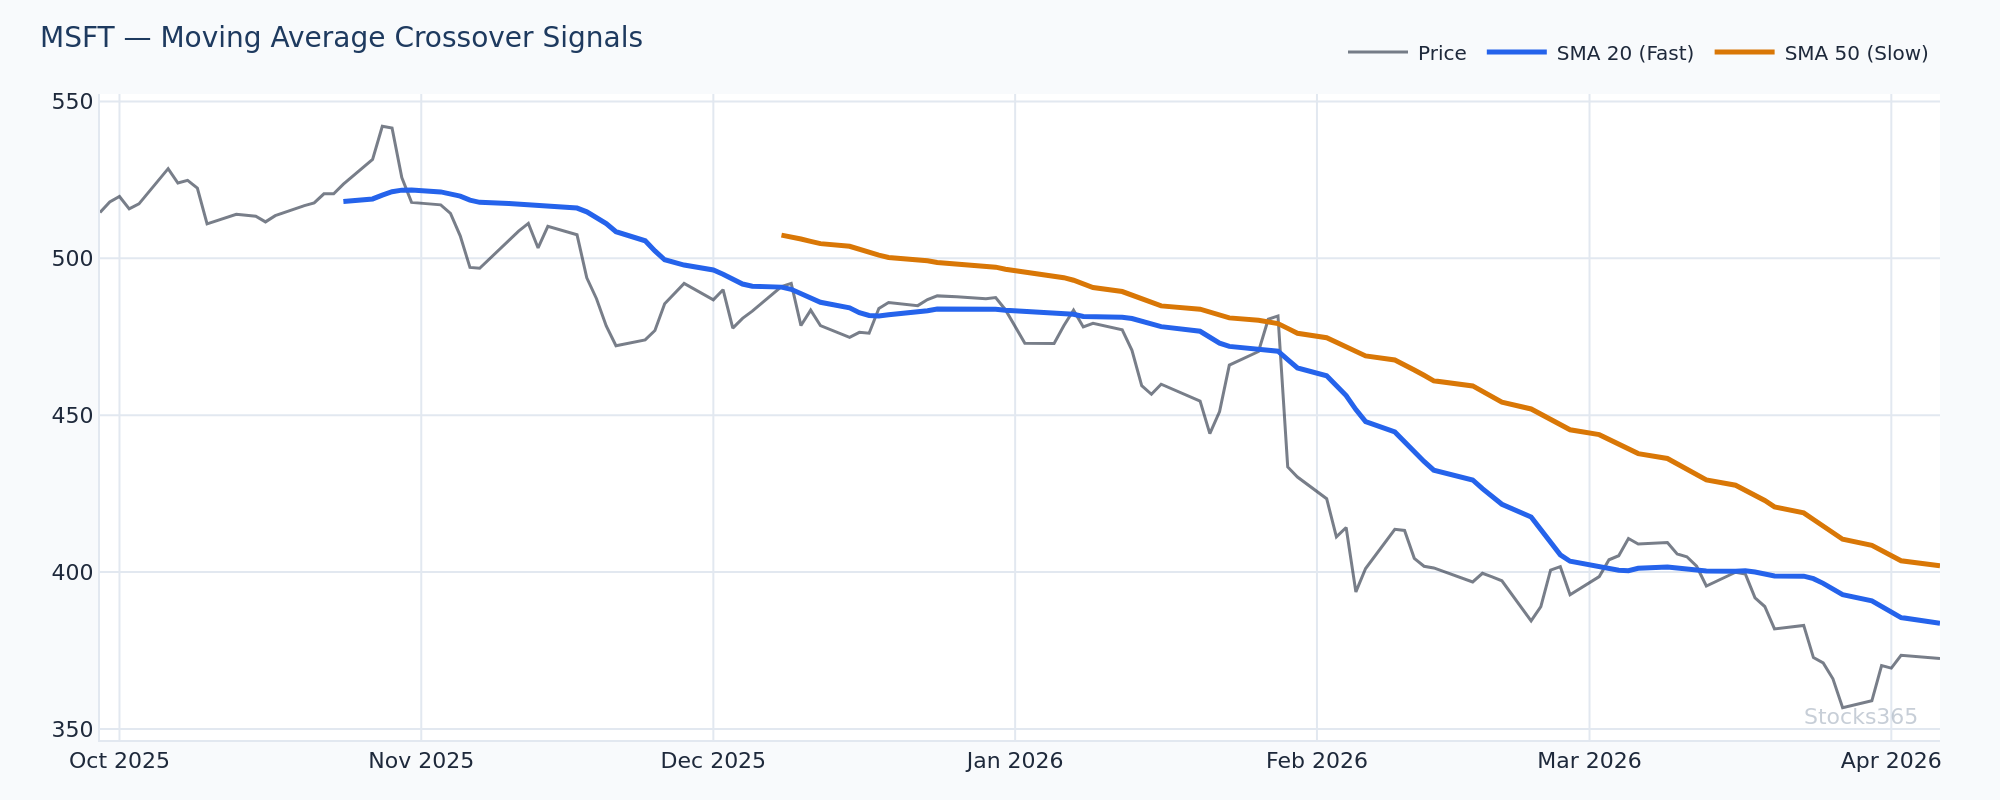
MACD crossovers on daily and weekly charts have a strong historical track record for swing trading entries. A bullish MACD crossover — where the MACD line crosses above the signal line — combined with a zero line crossover (MACD moving from negative to positive territory) is one of the classic intermediate-term trend confirmation signals.
When RSI Outperforms MACD
RSI has its own distinct advantages that make it the preferred tool in specific scenarios.
Range-Bound and Choppy Markets
When a stock is trading sideways in a defined range, RSI's overbought and oversold levels become highly actionable. Imagine AMZN consolidating between $220 and $240 for several weeks. Each time RSI touches 70 near the $240 resistance, it signals a potential short-term fade. Each time RSI drops to 30 near the $220 support, it signals a potential bounce. MACD in this environment would generate repeated false crossover signals, whipsawing traders in and out.
Spotting Extreme Conditions Quickly
RSI's 0–100 scale makes extreme readings immediately recognizable. When RSI drops below 20 or spikes above 80, traders know they're dealing with an exceptional situation — potentially a panic selloff or a euphoric blow-off top. MACD's unbounded scale makes it harder to quickly gauge whether a reading is extreme without additional context.
Divergence Trading
As mentioned, RSI divergence signals — particularly on the 14-period default — are exceptionally powerful. When price makes a new high but RSI fails to confirm with a new high of its own, it's a classic bearish divergence warning. For traders who specialize in reversal setups, RSI consistently provides cleaner divergence signals than MACD. Pair this with the insights in our guide on RSI Overbought and Oversold Levels: Master the Signals for a complete reversal trading approach.
Scalping and Short-Term Trading
On 5-minute and 15-minute charts, RSI reacts more quickly to price changes than MACD, making it a preferred tool for intraday traders and scalpers. Adjusting RSI to a 7 or 9 period makes it even more responsive for ultra-short-term setups. For a complete walkthrough of practical RSI trading methods, see How to Use RSI in Trading: The Ultimate Step-by-Step Guide.
The Professional Approach: Using MACD and RSI Together
Here's the secret that elite traders know: the real power isn't in choosing between MACD and RSI — it's in combining them strategically so that each indicator compensates for the other's weaknesses.
Confluence Trading Strategy
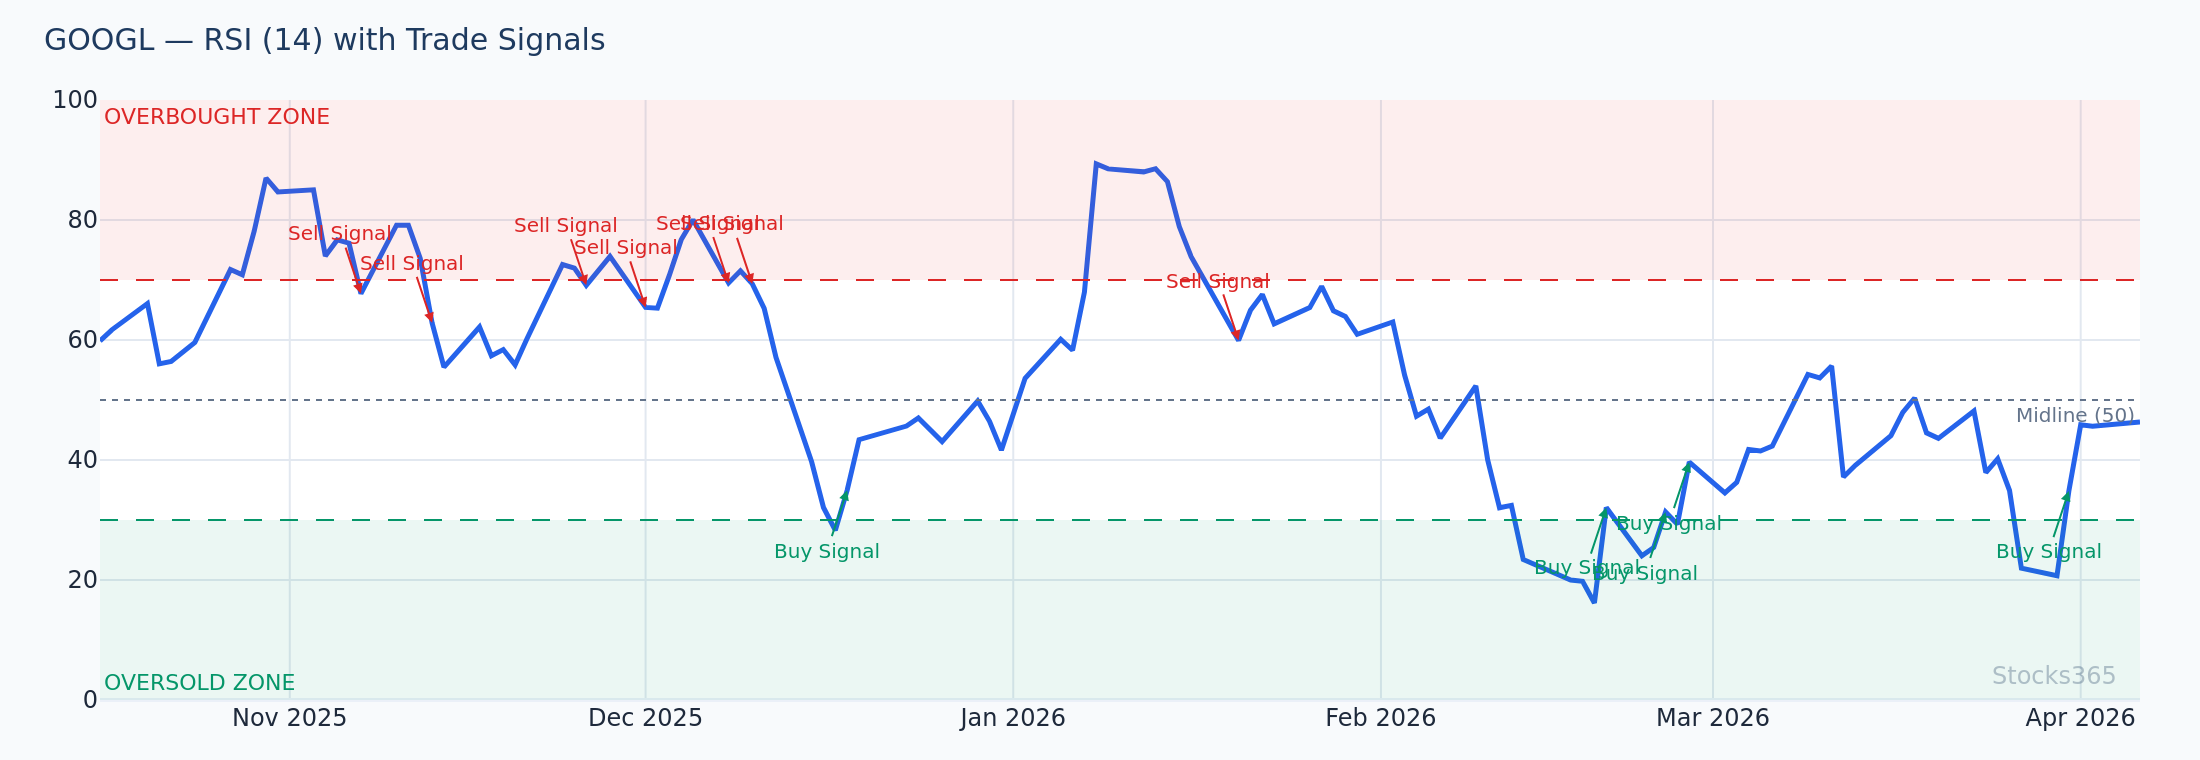
The most robust trade setups occur when both indicators align. Consider this example using GOOGL in early 2026:
- GOOGL pulls back from $215 to $198 during a broader market correction
- RSI drops to 32 — approaching oversold territory on the daily chart
- MACD histogram begins contracting, indicating selling momentum is fading
- MACD line then generates a bullish crossover above the signal line
- RSI simultaneously bounces from 32 and crosses back above 40
This confluence of signals — RSI recovering from near-oversold and MACD generating a bullish crossover — creates a high-probability long setup with a clear stop below the recent low near $194. Confluence trading dramatically reduces false signals because two independent indicators are confirming the same directional bias.
Using MACD for Trend Filter, RSI for Entry Timing
Another powerful combination is using MACD as a trend filter and RSI for precise entry timing. The workflow looks like this:
- Step 1: Check MACD on the daily chart to determine trend direction. If MACD is positive and above the signal line, the trend is bullish. Only take long setups.
- Step 2: Drop to the 4-hour chart and wait for RSI to pull back to 40–50 (a normal retracement in a healthy uptrend).
- Step 3: Enter long when RSI turns back up from the 40–50 zone, with MACD still confirming the bullish trend on the daily.
- Step 4: Use RSI reaching 70 as a partial profit target, and watch for MACD histogram weakening as a signal to exit the remainder.
This approach leverages the trend-following strength of MACD while using RSI's precision to time entries at favorable risk-reward points. It's a strategy used by professional traders and is fully compatible with the signals and screening tools available on the Stocks365 dashboard.
MACD vs RSI in Different Asset Classes
The MACD vs RSI comparison also varies by asset class. Here's a quick guide:
Stocks
Both indicators work well on individual stocks. RSI tends to be more reliable for mean-reversion plays on high-quality large-caps like AAPL, while MACD is excellent for momentum names in strong uptrends.
Cryptocurrencies
Crypto markets are notoriously volatile and prone to extended trending moves. MACD often outperforms in crypto because assets like Bitcoin can remain in extreme overbought RSI territory for weeks during bull runs. RSI divergence, however, remains a powerful reversal warning in crypto.
Forex
Forex pairs frequently oscillate in ranges, making RSI highly effective. MACD works well during macro-driven trend moves following major central bank events or economic data releases.
ETFs and Indices
Index ETFs tend to trend more smoothly than individual stocks, giving MACD crossovers higher reliability. RSI is still valuable for identifying short-term pullback entry points within longer index uptrends.
Common Mistakes When Using MACD and RSI
Even experienced traders make these errors. Avoid them to sharpen your edge:
- Using RSI overbought/oversold signals in strong trends — Buying RSI oversold in a strong downtrend or selling RSI overbought in a strong uptrend is one of the most common and costly mistakes. Always check the broader trend context first.
- Treating every MACD crossover as a trade signal — On shorter timeframes, MACD generates frequent crossovers, many of which are false signals. Filter them with additional context or use MACD only on daily charts and above.
- Ignoring divergence — Both indicators generate powerful divergence signals that many traders overlook. This is especially true for hidden RSI divergence — an advanced signal that most traders miss entirely.
- Using default settings blindly — Default settings (RSI 14, MACD 12/26/9) work well for many scenarios, but adjusting them to fit your timeframe and trading style can significantly improve signal quality.
- Ignoring the Stocks365 Trust Score — When evaluating trade setups, the Stocks365 Trust Score provides a multi-factor confidence rating that incorporates technical signals from both RSI and MACD alongside volume, trend strength, and other factors — giving you a more complete picture than either indicator alone.
RSI vs Stochastic vs MACD: How They All Compare
If you're weighing multiple momentum indicators, it's worth understanding how RSI compares to the Stochastic Oscillator as well. Both RSI and Stochastic are bounded oscillators used for overbought/oversold identification, but they differ in sensitivity and calculation. Our guide on RSI vs Stochastic Oscillator: The Essential Guide covers this comparison in full depth. In short: Stochastic tends to be more sensitive and faster-moving than RSI, making it useful for very short-term setups, while RSI offers smoother, more reliable signals on standard timeframes. MACD, being trend-focused, serves a different primary purpose than either oscillator.
📊 Key Takeaways: MACD vs RSI
- RSI is a bounded oscillator (0–100) that excels at identifying overbought/oversold extremes, divergence signals, and entry timing in range-bound markets.
- MACD is an unbounded trend-momentum indicator that excels at identifying trend direction, momentum acceleration, and staying in trending trades longer.
- In strong trending markets, MACD is generally more reliable; in choppy, range-bound conditions, RSI is generally more reliable.
- The most powerful strategy is to combine both: use MACD as a trend filter and RSI for precise entry timing.
- Both indicators generate divergence signals — these are among the highest-probability setups available to technical traders.
- Neither indicator is universally superior — context, asset class, and timeframe all determine which tool is best for a given situation.
- The Stocks365 Trust Score integrates signals from multiple indicators, including RSI and MACD, for a comprehensive confidence rating on every setup.
Frequently Asked Questions
Is MACD or RSI better for day trading?
For day trading, RSI is generally preferred because it reacts more quickly to short-term price changes and provides clear, intuitive overbought/oversold signals on intraday charts. However, MACD can be useful for identifying the intraday trend direction so you can bias your RSI signals in the right direction. Many professional day traders use a combination of both — MACD on a higher timeframe (e.g., 1-hour) and RSI on a lower timeframe (e.g., 5-minute) for entry precision.
Can you use MACD and RSI together?
Absolutely — and most experienced traders do. Using MACD and RSI together is one of the most effective momentum trading approaches available. The key is assigning each indicator a specific role: MACD for trend direction and momentum confirmation, RSI for entry timing and identifying overextended conditions. When both indicators align — for example, a bullish MACD crossover alongside an RSI recovery from oversold — the confluence significantly increases the probability of a successful trade.
What are the main weaknesses of RSI?
RSI's biggest weakness is generating false signals in strongly trending markets. When a stock is in a powerful uptrend, RSI can remain above 70 for extended periods — leading traders who short the "overbought" reading into repeated losses. RSI also doesn't provide strong signals about the direction of the prevailing trend, only about whether momentum is stretched. This is why pairing RSI with a trend indicator like MACD or a moving average is strongly recommended.
What are the main weaknesses of MACD?
MACD's primary weaknesses are its lag and tendency to produce false signals in sideways, choppy markets. Because MACD uses exponential moving averages with relatively long lookback periods (12 and 26), it responds slowly to sharp price changes. In range-bound conditions, MACD crossovers can whipsaw repeatedly, generating multiple small losses. Additionally, MACD's unbounded scale makes it harder to identify when momentum is at an extreme compared to RSI's straightforward 0–100 range.
Which indicator do professional traders prefer — MACD or RSI?
Most professional traders don't choose one over the other — they use both, along with other tools, to build a complete picture of market conditions. That said, many institutional traders and systematic quant strategies incorporate MACD for trend-following signals, while RSI is heavily favored among discretionary traders for spotting reversals and timing entries. The Stocks365 Trust Score system, for example, weighs signals from both indicators alongside volume analysis, price structure, and other factors to generate a holistic view of each trade opportunity on the Stocks365 dashboard.