
Why Most Traders Are Using RSI Wrong (And Losing Money Because of It)
The Relative Strength Index is one of the most widely used technical indicators in the world — and ironically, one of the most widely misused. Whether you're trading equities, crypto, or forex, RSI appears on virtually every charting platform, which creates a dangerous illusion: that knowing what RSI is automatically means you know how to use it effectively.
The reality is starkly different. Most retail traders rely on RSI in ways that consistently erode their capital. They misread signals, apply the wrong settings, ignore market context, and treat a single oscillator as a complete trading system. These RSI mistakes are not minor — they can be the difference between a consistently profitable strategy and one that bleeds slowly over months.
In this guide, we break down the most common RSI mistakes traders make in 2026, explain exactly why each one is dangerous, and give you concrete, actionable ways to fix them. If you're new to the indicator, start with What Is RSI? The Complete Beginner's Guide before diving in.
RSI Mistake #1: Trading Overbought and Oversold Levels as Automatic Buy/Sell Signals
This is the single most common RSI mistake, and it destroys more accounts than almost any other misuse of technical analysis. The logic seems intuitive: RSI above 70 means the asset is overbought, so sell. RSI below 30 means oversold, so buy. Simple, right?
Wrong. Dead wrong — especially in trending markets.
When a stock like NVDA enters a powerful uptrend, RSI can sit above 70 for weeks, even months, as price continues climbing relentlessly. A trader who shorted every time RSI crossed 70 during NVDA's 2026 Q1 rally would have been crushed repeatedly. Meanwhile, the traders who understood that overbought RSI in a strong uptrend signals momentum, not reversal, were riding the wave profitably.
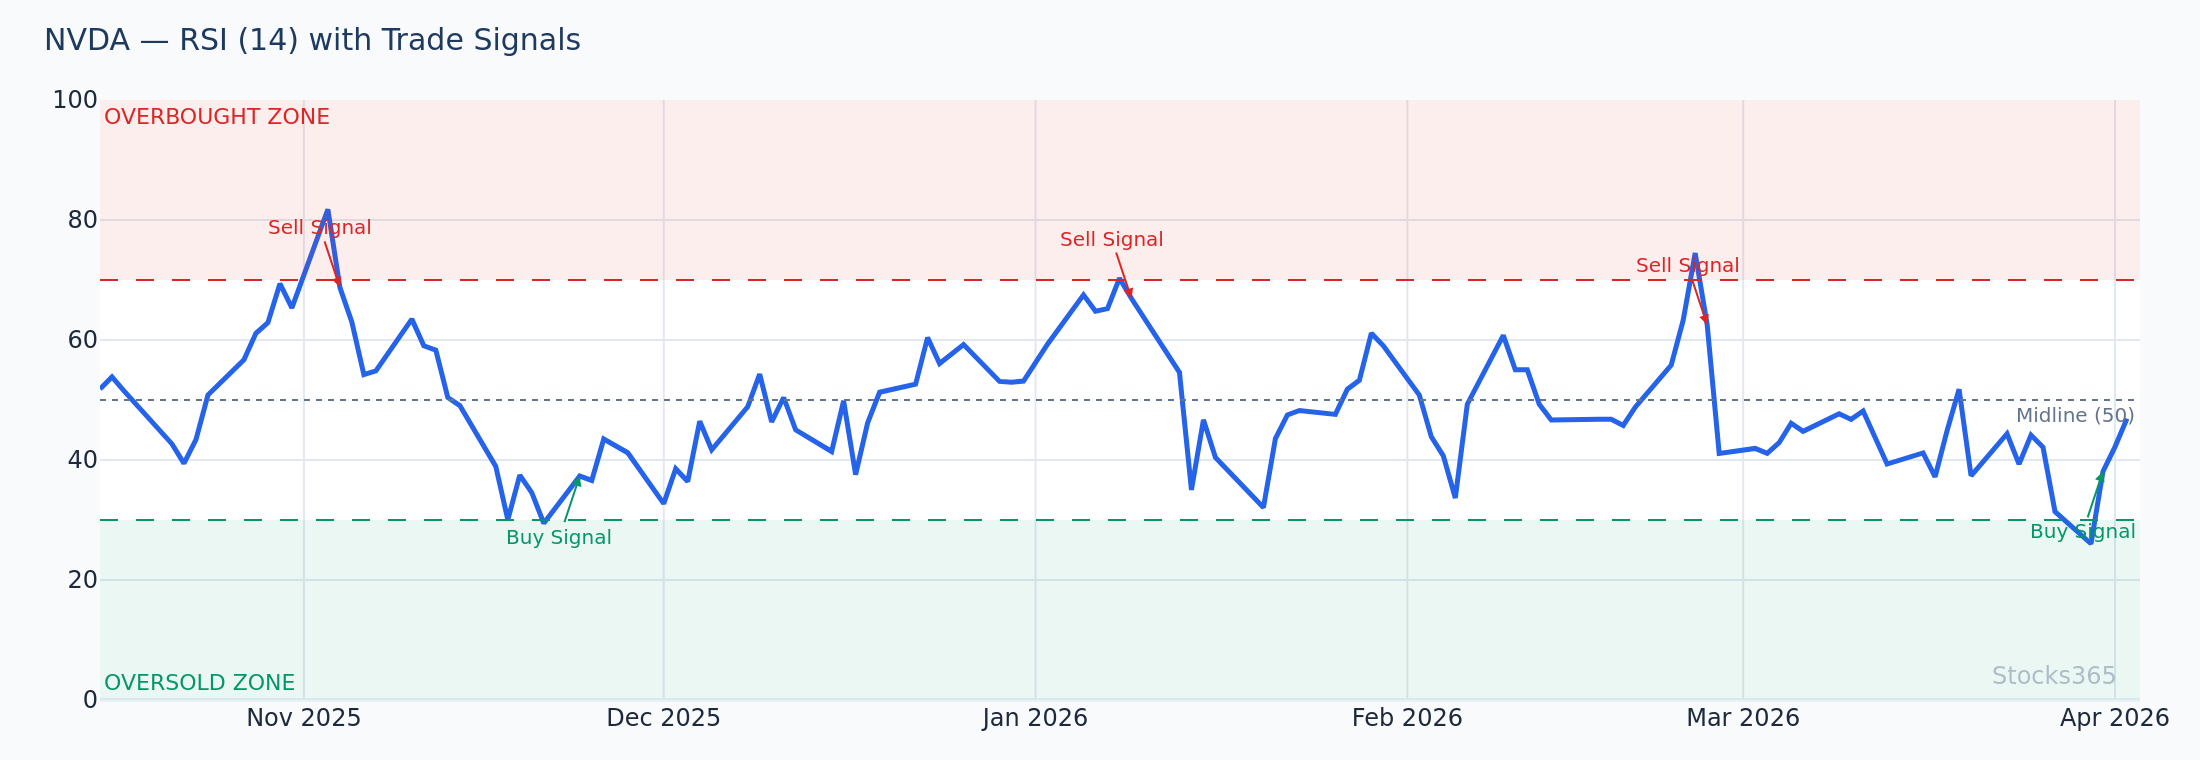
The fix: Use overbought and oversold readings as context flags, not triggers. Always identify the prevailing trend first. In a bull trend, oversold readings (RSI dipping below 40–45) are far more reliable buy signals than overbought readings are sell signals. In a bear trend, the reverse applies. For a deep dive into using these levels correctly, read our guide on RSI Overbought and Oversold Levels: Master the Signals.
Practical Fix: Trend-Adjusted RSI Thresholds
- Uptrend: Use 40–50 as the oversold zone, 80 as a potential warning level
- Downtrend: Use 50–60 as the overbought zone, 20 as a potential warning level
- Sideways market: Standard 30/70 levels apply more reliably
RSI Mistake #2: Using RSI in Isolation Without Confirmation
RSI is a momentum oscillator — a supporting actor, not the lead. Yet countless traders build entire strategies around RSI alone, entering and exiting positions purely based on its readings with zero confirmation from other indicators or price action.
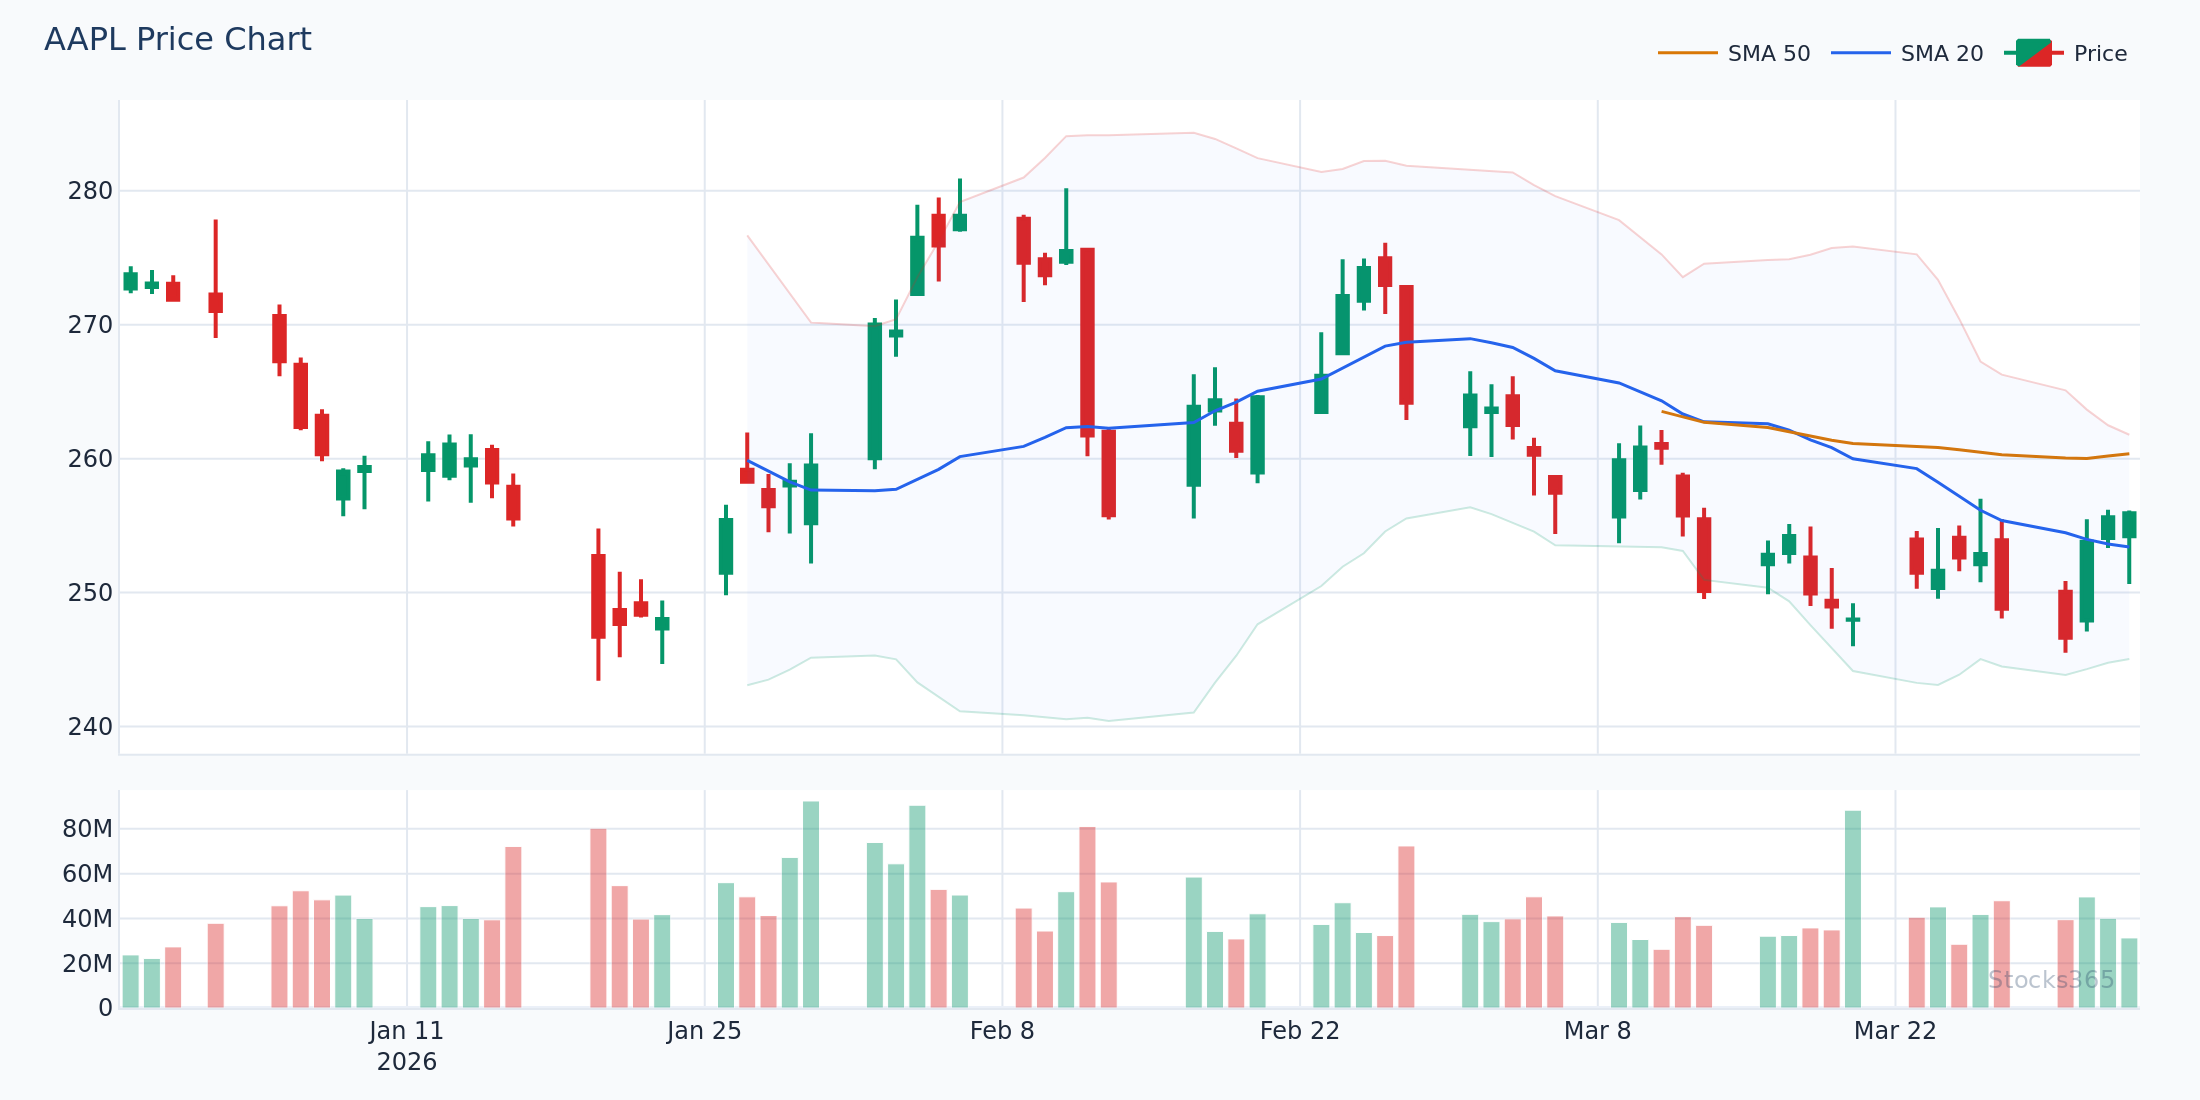
Consider this scenario: AAPL shows RSI crossing back above 30 from oversold territory. Is that a buy signal? Maybe. But what does the price action look like? Is there a support level nearby? What's the volume doing? Is the broader market in a risk-off environment? Without answers to these questions, you're essentially flipping a coin with extra steps.
The most effective RSI traders use the indicator as one piece of a larger puzzle. Common confirmation tools include:
- Price action: Look for candlestick reversal patterns (hammer, engulfing) aligning with RSI signals
- Volume: A bullish RSI signal on declining volume is weak; on rising volume, it's compelling
- Moving averages: Is price bouncing off a key moving average when RSI becomes oversold?
- Support/resistance: RSI signals near key horizontal levels carry far more weight
- Complementary oscillators: Pairing RSI with the Stochastic Oscillator can filter false signals significantly — explore how in our RSI vs Stochastic Oscillator guide
The Stocks365 trust score system helps here enormously — signals with multiple technical confluences receive higher trust scores, allowing you to prioritize the setups most likely to follow through. Check the Signals Dashboard to see how confluence-based scoring filters noise from genuine opportunities.
RSI Mistake #3: Ignoring RSI Divergence
If overbought/oversold misuse is the most common RSI mistake, ignoring divergence is arguably the most costly. RSI divergence — when price makes a new high or low that RSI fails to confirm — is one of the most powerful early warning signals in technical analysis.
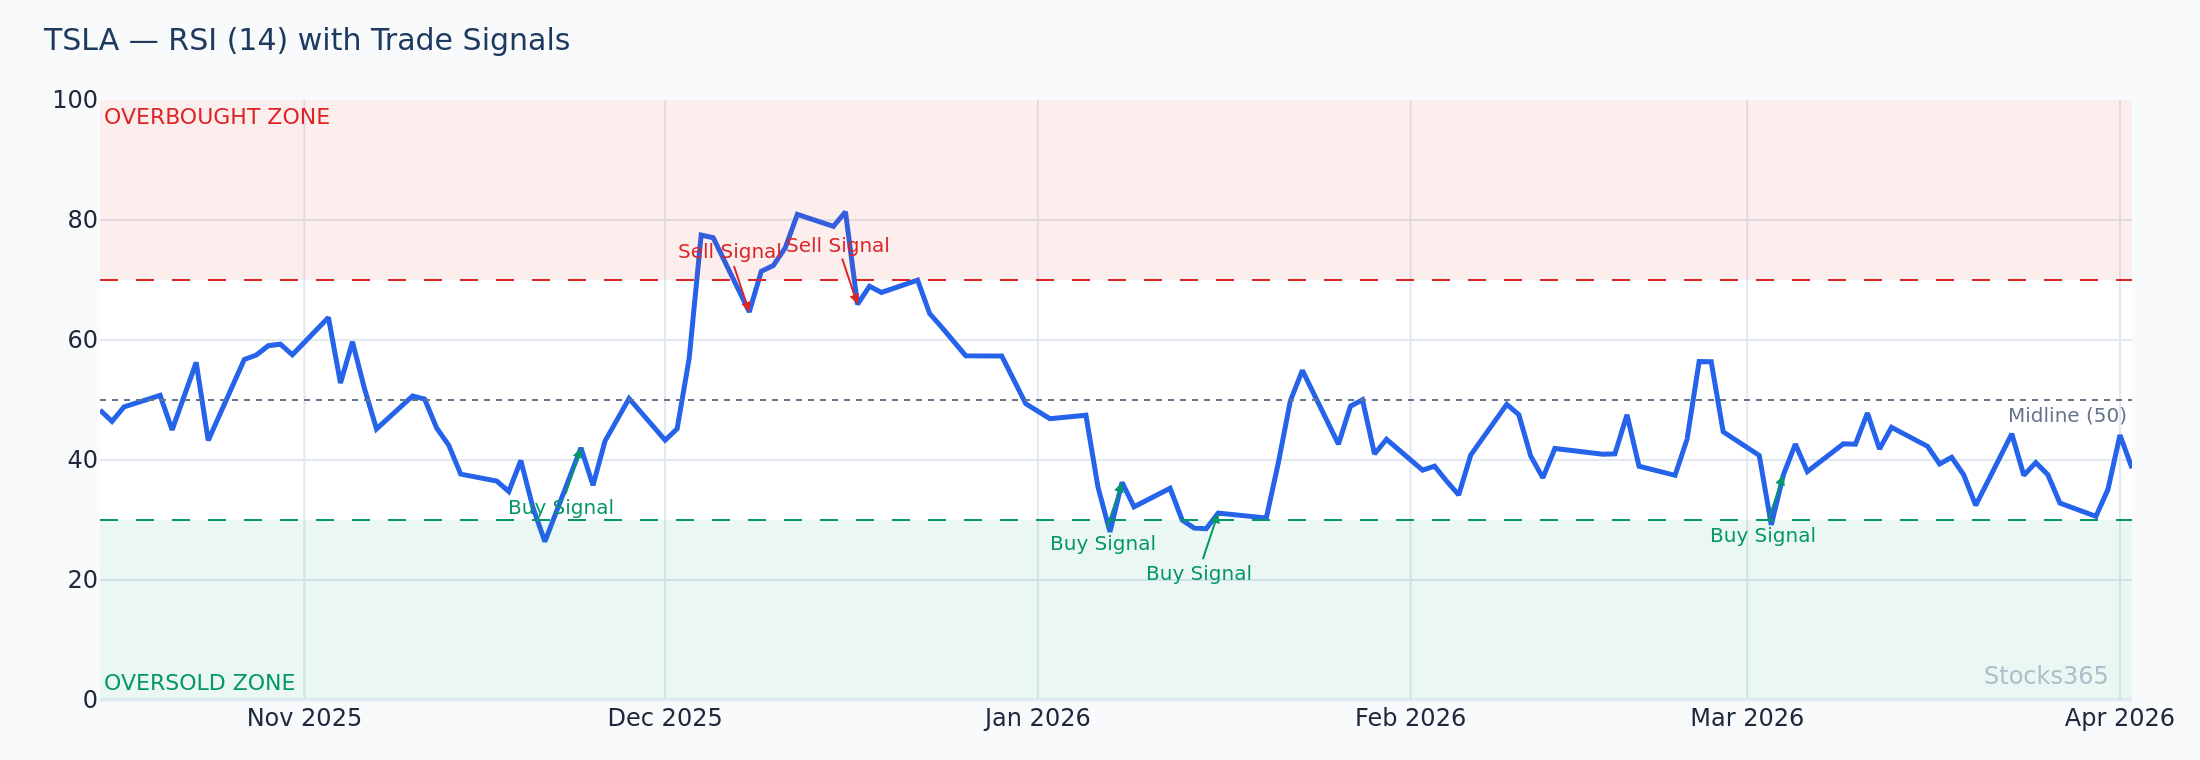
A classic bearish divergence example: TSLA makes a higher price high in February 2026, but RSI makes a lower high. This hidden disconnect reveals weakening momentum beneath the surface. Price is moving up, but the engine driving it is losing power. Traders who spot this can position for a reversal before the crowd realizes what's happening.
Many traders either don't know divergence exists, or they notice it but don't act on it because they're fixated on basic overbought/oversold readings. This is a massive missed opportunity.
There are two primary types of divergence to master:
- Regular (classic) divergence: Signals potential trend reversals. Bullish when price makes lower lows but RSI makes higher lows. Bearish when price makes higher highs but RSI makes lower highs.
- Hidden divergence: Signals trend continuation — a subtler and often more powerful signal. Hidden RSI Divergence is the advanced signal most traders completely miss.
Master both, and you'll be operating at a level well above the majority of retail traders. Our comprehensive resource on RSI Divergence: Bullish & Bearish Signals covers everything you need to become proficient.
RSI Mistake #4: Using the Wrong RSI Period Settings
Most traders never touch the default RSI period of 14. They accept it as gospel, never questioning whether it actually suits their trading style, timeframe, or the asset they're analyzing. This passive approach to settings is a subtle but significant RSI mistake.
The 14-period RSI was popularized by J. Welles Wilder in the late 1970s for daily commodity charts. It's a solid default — but it's not universally optimal. The right RSI period depends heavily on:
- Your trading timeframe: Scalpers on 5-minute charts need faster, more responsive settings (RSI 5–9). Swing traders on daily charts may prefer the standard 14. Position traders may use 21 or higher for smoother, less noisy readings.
- The asset's volatility: Highly volatile assets like crypto may benefit from longer periods to reduce whipsaws. Low-volatility dividend stocks may need shorter periods to generate actionable signals.
- Your strategy type: Momentum strategies favor shorter periods. Mean-reversion strategies often prefer longer periods.
A practical example: A trader using RSI-14 on a 1-minute MSFT chart will see so many crossings of 30 and 70 that the signal becomes meaningless noise. Switching to RSI-9 on a 15-minute chart, or RSI-14 on a 1-hour chart, produces far cleaner, more tradeable signals.
For a complete breakdown of optimal settings across different timeframes and strategies, read our guide on RSI Settings: Master the Best Period for Your Strategy.
Quick RSI Period Reference
- RSI 5–9: Fast, responsive, ideal for scalping and very short-term trading
- RSI 14: Standard, balanced — best for swing trading daily charts
- RSI 21–25: Slow, smooth — ideal for position trading and weekly charts
RSI Mistake #5: Not Adjusting for Market Conditions and Asset Class
RSI doesn't behave the same across all market conditions or asset classes, and failing to account for this is a nuanced but costly RSI mistake. A reading of 65 means something very different in a trending bull market versus a choppy, range-bound environment.
In a strongly trending market, RSI tends to oscillate between higher ranges (40–80 in an uptrend, 20–60 in a downtrend). Traders who apply flat 30/70 thresholds without adjusting for the regime will generate a relentless stream of false signals — buying too early in downtrends and selling too early in uptrends.
"The biggest RSI mistake I see from traders at every level is treating the indicator as context-agnostic. RSI is a relative measure — relative to recent price action. Apply it without market context and you're flying blind."
Additionally, RSI behaves differently across asset classes:
- Equities: Standard settings work reasonably well, but sector rotation and macro conditions should always be factored in
- Crypto: Extreme volatility means RSI can stay in extreme territory far longer — wider bands (20/80) often work better than 30/70
- Forex: Currency pairs in carry trades or macro trends can maintain momentum for extended periods — trend identification is critical before applying RSI signals
- Commodities: Seasonal patterns and supply/demand fundamentals can override RSI signals — always check the macro backdrop
RSI Mistake #6: Misunderstanding How RSI Is Calculated
You don't need to be a mathematician to trade RSI effectively, but having zero understanding of how the indicator is actually constructed leads to consistent misinterpretation. Traders who don't understand the formula often draw incorrect conclusions from RSI's behavior — particularly why it sometimes moves sharply or appears to lag.
At its core, RSI measures the ratio of average gains to average losses over a specified period. Understanding this means you know that RSI is inherently backwards-looking, that it smooths data over time, and that dramatic price moves can temporarily distort readings in ways that don't reflect the true underlying momentum picture.
For example, a single massive down-day on GOOGL can spike RSI dramatically lower — not because momentum has fundamentally shifted, but because one extreme data point temporarily dominates the calculation. Knowing this prevents you from panic-selling into what might be a healthy, temporary correction.
Invest 10 minutes in reading How RSI Is Calculated: Formula Explained Step by Step — it will fundamentally improve your ability to interpret the indicator correctly.
RSI Mistake #7: Entering Trades the Moment RSI Crosses a Level
Timing is everything in trading, and one of the most avoidable RSI mistakes is entering a trade the instant RSI crosses 30, 70, or any other threshold. This reflexive reaction treats a single data point as a complete signal, ignoring the critical question: has the condition actually been confirmed?
Best practice is to wait for RSI to exit the extreme zone, not just enter it. For a bullish trade:
- Wait for RSI to dip below 30 (oversold confirmed)
- Then wait for RSI to cross back above 30 before entering
- Ideally, pair this with a bullish candlestick confirmation on the chart
This one-step delay filters out a large percentage of false signals where price continues falling even after RSI first touches 30. The brief wait for confirmation sacrifices a small amount of potential upside in exchange for dramatically improved signal reliability.
For a comprehensive walkthrough of entry and exit techniques, our Ultimate Step-by-Step Guide to Using RSI in Trading covers every scenario in detail.
RSI Mistake #8: Ignoring Risk Management Because RSI Looks Convincing
Perhaps the most dangerous RSI mistake of all isn't a misreading of the indicator — it's letting a convincing RSI setup override your risk management discipline. No matter how perfectly RSI aligns with your thesis, no trade is guaranteed. Markets can and do move against technically clean setups with alarming frequency.
Traders who see strong RSI divergence, oversold conditions, and a key support level all aligning may feel an almost irresistible urge to size up their position. This is precisely when discipline matters most. The signal may look perfect — and it can still fail. A 70% win-rate strategy still loses 30% of the time.
The non-negotiable rules for RSI-based risk management:
- Always set a stop-loss before entering, and place it at a logical technical level — not a round number you're comfortable with emotionally
- Size positions based on the stop distance, not on how confident you feel about the RSI setup
- Define your reward-to-risk ratio before every trade — a 2:1 minimum is a common professional standard
- Never average down into a losing RSI trade simply because RSI is getting "more oversold" — that's doubling down on a potentially broken thesis
You can monitor live signal quality and trust scores for specific stocks like AAPL on the Stocks365 platform, which incorporates multiple technical factors to give you an objective read on signal strength — helping you right-size positions based on evidence rather than emotion.
Key Takeaways
- Never treat overbought/oversold as automatic signals — always consider the prevailing trend before acting on extreme RSI readings
- RSI works best with confirmation — combine it with price action, volume, support/resistance, and complementary indicators
- Master RSI divergence — both regular and hidden divergence are among the most powerful and underused signals in technical analysis
- Optimize your RSI period settings for your specific timeframe, asset, and trading style — 14 is a starting point, not a rule
- Adjust for market regime and asset class — RSI signals carry different weight in trending vs. range-bound markets and across different instruments
- Understand the formula — knowing how RSI is calculated prevents misinterpretation of extreme or anomalous readings
- Wait for confirmation before entering — let RSI exit the extreme zone before pulling the trigger
- Never abandon risk management — no RSI signal, however clean, justifies skipping your stop-loss or over-sizing a position
Frequently Asked Questions
What is the biggest RSI mistake beginners make?
The most common RSI mistake for beginners is treating overbought (above 70) and oversold (below 30) levels as automatic buy and sell signals without considering the broader market trend. In a strong uptrend, RSI can remain overbought for extended periods while price continues rising — blindly selling every time RSI hits 70 in such conditions is a reliable way to lose money.
Can RSI be used as a standalone trading strategy?
Technically yes, but it's not recommended. RSI used in isolation produces a high rate of false signals, particularly in trending markets. Professional traders use RSI as one component of a larger framework that includes trend identification, support/resistance levels, volume analysis, and often one or two complementary indicators. This multi-confirmation approach dramatically improves signal reliability.
Why does RSI sometimes give false signals?
RSI is a lagging indicator that measures recent price momentum, not future price direction. It can give false signals because it doesn't account for fundamental catalysts, news events, broader market conditions, or the strength of the prevailing trend. A single large price move can also temporarily distort RSI readings. Understanding how RSI is calculated helps traders identify when readings may be misleading.
What RSI period should I use for day trading?
For day trading, shorter RSI periods (5–9) are generally more effective because they respond faster to intraday price changes. The standard 14-period RSI tends to lag too much for fast-moving intraday setups. However, shorter periods also generate more noise and false signals, so they should always be paired with strong confirmation signals and tight risk management. See our full RSI Settings guide for detailed recommendations by timeframe.
How do I avoid RSI divergence mistakes?
The most common RSI divergence mistake is acting on divergence too early, before it's confirmed by price action. Always wait for a candlestick reversal pattern or a clear break of a short-term trend line before entering a divergence trade. Also, distinguish between regular divergence (which signals reversals) and hidden divergence (which signals trend continuation) — confusing the two leads to trades in completely the wrong direction. Our guide on RSI Divergence covers both in depth.