
What Is the RSI 50 Level and Why Does It Matter?
Most traders obsess over RSI readings of 70 and 30 — the classic overbought and oversold thresholds. But there's a quieter, arguably more powerful signal hiding right in the middle of your RSI indicator: the RSI 50 level centerline. If you've been ignoring it, you're leaving high-probability trade setups on the table.
The RSI 50 centerline is the neutral midpoint of the Relative Strength Index scale. When RSI crosses above 50, buying pressure is statistically dominating selling pressure. When it falls below, sellers are in control. It sounds simple — and it is — but the real edge comes from knowing how to use this signal in context, not just in isolation.
Before we dive deep, if you're brand new to the indicator, it helps to start with What Is RSI? The Complete Beginner's Guide to build your foundation. For those already comfortable with the basics, let's get into the mechanics that separate amateur RSI users from professionals.
The Mathematics Behind the RSI 50 Centerline
Understanding why the 50 level carries meaning requires a brief look at how RSI is constructed. The RSI formula compares average gains to average losses over a defined lookback period (typically 14 periods). When the average gain equals the average loss, RSI lands exactly at 50. This is mathematical equilibrium — the market is perfectly balanced between bullish and bearish momentum.
In practical terms:
- RSI above 50: Average gains over the period exceed average losses — bulls are winning
- RSI at 50: Perfect balance between buying and selling pressure
- RSI below 50: Average losses exceed average gains — bears are in control
This is why a sustained move above 50 often coincides with uptrends, while sustained readings below 50 align with downtrends. For the full mathematical breakdown, see our article on How RSI Is Calculated: Formula Explained Step by Step.
The RSI Centerline Crossover Signal Explained
A centerline crossover occurs when RSI transitions from one side of the 50 level to the other. There are two primary signals:
Bullish Centerline Crossover (RSI Crosses Above 50)
When RSI moves from below 50 to above 50, it signals a potential shift from bearish to bullish momentum. This crossover suggests that the recent average gains have now overtaken average losses — a meaningful change in market character.
What to look for:
- RSI has been trading below 50 (bearish phase)
- RSI breaks through the 50 level on increasing momentum
- Price action confirms with a breakout above a key resistance level or moving average
- Volume expands on the crossing candle (on daily charts especially)
Bearish Centerline Crossover (RSI Falls Below 50)
The inverse applies when RSI crosses from above 50 to below. This signals that selling pressure is now dominant and the prior bullish trend may be losing steam or reversing altogether.
What to look for:
- RSI has been sustaining above 50 during an uptrend
- RSI breaks below 50 with conviction (not a brief dip)
- Price breaks below a key support level, moving average, or trendline
- A bearish candlestick pattern reinforces the signal
How to Trade the RSI 50 Level: Step-by-Step Strategy
Here's a structured approach to trading RSI centerline crossovers with discipline and precision.
Step 1: Identify the Market Context
Never trade a centerline crossover in isolation. First, determine the broader trend using a higher timeframe (e.g., weekly chart if you're trading daily). A bullish crossover on the daily chart that aligns with an uptrend on the weekly chart is far more reliable than a crossover that contradicts the larger trend.
Step 2: Wait for a Clean Crossover
A "clean" crossover means RSI decisively moves through the 50 level — not just a single candle touching 50 and retreating. Look for RSI to close above (or below) 50 for at least two consecutive periods before acting. This filters out noise and false signals common in choppy markets.
Step 3: Find Your Entry
Once a valid crossover is confirmed, identify your entry. There are two common approaches:
- Aggressive entry: Enter as soon as RSI closes on the new side of 50, using a tight stop
- Conservative entry: Wait for a retest of the 50 level from the new side (RSI dips back to ~50 and holds) before entering — this is the "kiss and go" technique favored by institutional traders
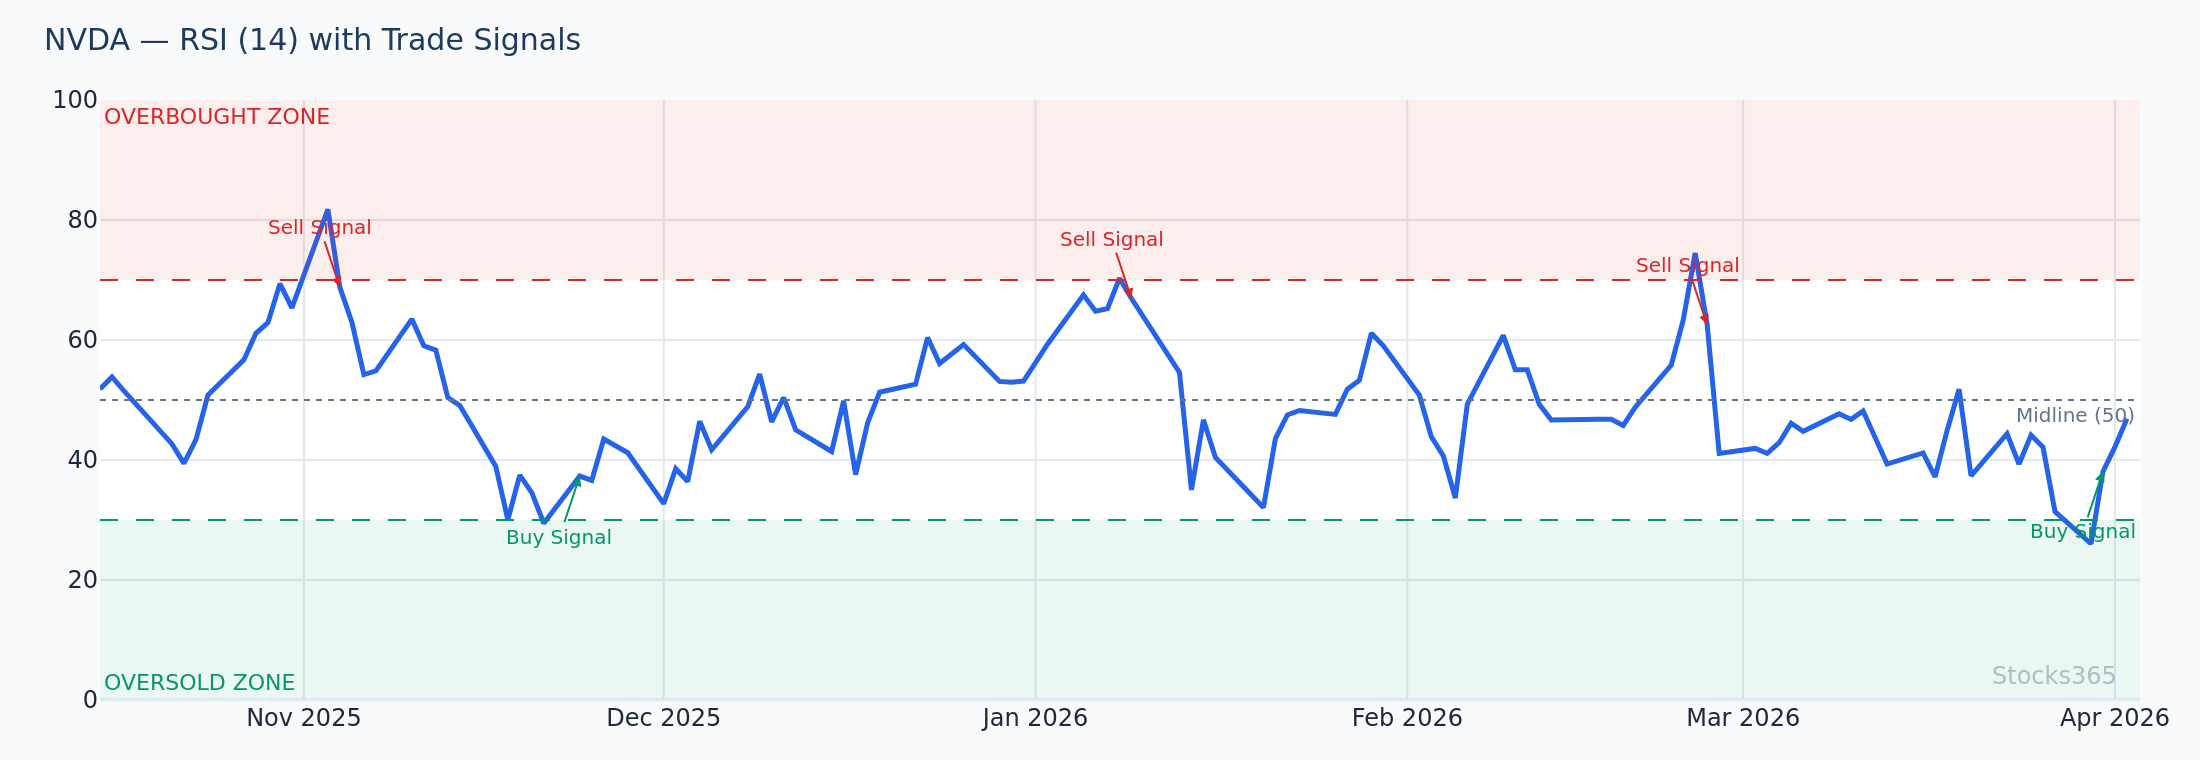
For example, imagine NVDA's RSI crosses above 50 on the daily chart while the stock is trading at $142. An aggressive trader enters immediately. A conservative trader waits for RSI to pull back to 50-51 without breaking below — then enters around $140-141 with a tighter risk profile.
Step 4: Set Your Stop Loss
For a bullish trade triggered by an RSI crossover above 50, your stop loss should be placed:
- Below the most recent swing low in price
- Or at a point where RSI would have to fall clearly back below 50, negating the signal
A common rule: if RSI closes back below 48 (giving a small buffer), exit the trade — the crossover signal has failed.
Step 5: Define Your Target
RSI centerline crossovers don't predict magnitude — they predict direction. Use complementary tools to set targets:
- Next major resistance/support level
- Fibonacci retracement levels
- Previous swing highs or lows
- A 1:2 or 1:3 risk-to-reward ratio as a minimum threshold
RSI 50 Level vs. Overbought/Oversold Signals: Key Differences
One of the most common questions traders ask is: how does the centerline crossover compare to the classic 70/30 signals? The answer lies in timing and trade duration.
The traditional RSI overbought and oversold levels are reversal signals — they're designed to catch exhaustion points at extremes. By the time RSI reaches 70 or 30, a significant portion of the move has already happened. You're entering late in the move, hoping for a reversal.
The centerline crossover, by contrast, is a trend-following signal. You're entering early in a potential new trend phase, which means:
- More room for the trade to run in your favor
- Better risk-to-reward ratios (typically)
- More false signals in ranging/choppy markets (the trade-off)
"The RSI 50 level tells you who's in control. The 70/30 levels tell you that control is about to be tested. Both matter — but they serve very different purposes in a trading plan."
Combining RSI 50 Centerline with Other Indicators
The centerline crossover becomes significantly more powerful when used in combination with other tools. Here are the most effective pairings.
RSI 50 + Moving Averages
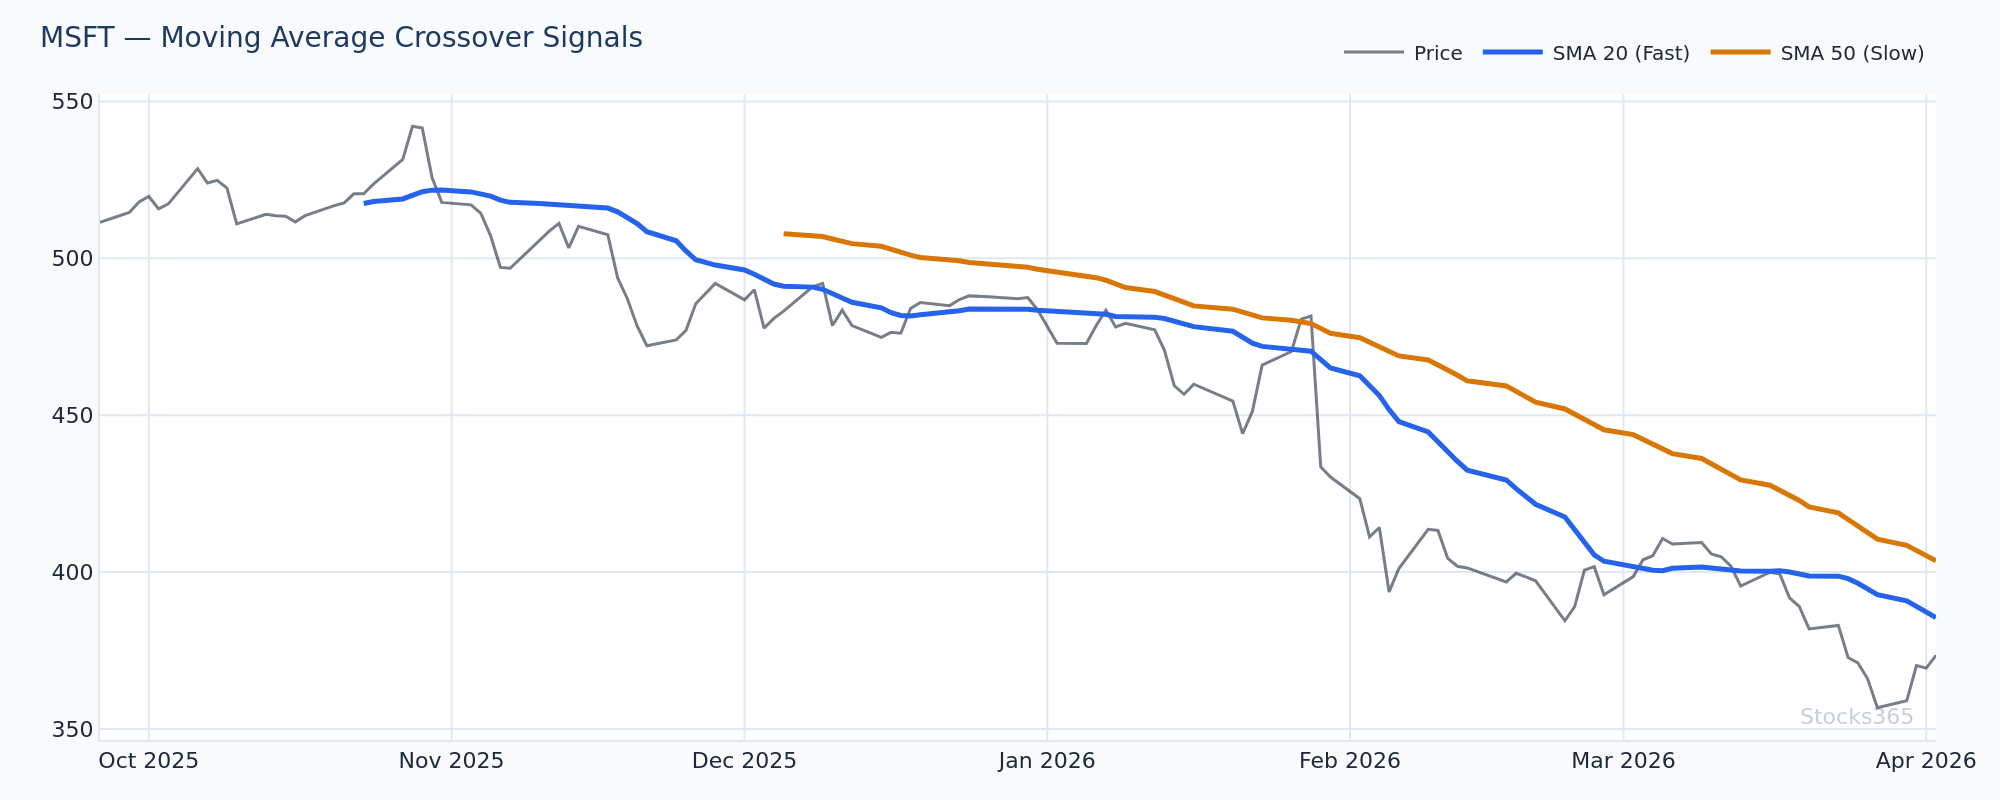
Look for RSI to cross above 50 at the same time price crosses above its 50-day or 200-day moving average. When these two signals align, you have both price-based and momentum-based confirmation. This dual confirmation dramatically reduces false signals.
Example: MSFT in early 2026 — RSI crossed above 50 on the daily chart as price reclaimed the 50-day SMA at $398. The subsequent move ran to $431 over six weeks, providing a clean trend-following opportunity.
RSI 50 + RSI Divergence
Combining centerline crossovers with RSI divergence signals creates a powerful one-two punch. If bullish divergence forms while RSI is below 50, and RSI then crosses above 50, you have both a reversal setup (divergence) and trend confirmation (crossover) in one trade setup.
RSI 50 + Volume
Volume is the unspoken partner of RSI. A centerline crossover accompanied by above-average volume is far more meaningful than one on thin, low-conviction volume. Always check your volume profile before committing to a trade based on this signal.
RSI 50 + Hidden Divergence
For advanced traders, pairing the centerline crossover with hidden RSI divergence can identify high-probability continuation entries within established trends. When RSI holds above 50 and hidden bullish divergence forms during a pullback, it signals the trend is intact and ready to resume.
Common Mistakes Traders Make with RSI 50 Crossovers
Even experienced traders misuse this signal. Here are the pitfalls to avoid:
Trading Every Crossover Blindly
In a sideways, low-volatility market, RSI can whipsaw back and forth across the 50 level repeatedly. Trading every crossover will result in a string of small losses. Solution: Only trade crossovers that align with the higher-timeframe trend and are accompanied by price confirmation.
Ignoring the RSI Settings
The default 14-period RSI is a starting point, not a law. Shorter settings (9 or 10) produce more frequent but noisier signals. Longer settings (21 or 25) produce fewer but more reliable crossovers. Understanding how RSI settings affect your strategy is critical to optimizing this technique for your trading style and timeframe.
Confusing Crossovers for Reversals
The centerline crossover is a trend-confirmation tool, not a reversal signal. Traders who enter expecting sharp immediate reversals are often stopped out during normal pullbacks. Set your expectations correctly: this signal tells you who has momentum, not that price will immediately rocket in one direction.
Using RSI in Isolation
RSI is a single lens on the market. Always confirm signals with price action, volume, and structure. If you're comparing RSI to other momentum tools, our guide on RSI vs. Stochastic Oscillator can help you understand when to use each.
RSI 50 Level Across Different Timeframes
The centerline crossover works on virtually any timeframe, but its implications change with scale:
- Weekly chart: A weekly RSI crossing above 50 is a major macro signal — it can precede months-long trending moves. Best for swing traders and investors.
- Daily chart: The sweet spot for most active swing traders. Reliable, actionable, and not overly noisy.
- 4-hour chart: Popular with day traders who want context before entering intraday positions. Use daily RSI 50 as the filter, 4H crossover as the trigger.
- 1-hour / 15-minute: More noise, more false signals. Reserve for experienced scalpers with tight risk management.
The multi-timeframe approach is the gold standard: confirm the trend on the weekly, wait for a daily RSI crossover above 50, then use a 4-hour chart for a precision entry. This top-down analysis is how professional traders use RSI in their complete trading process.
Using Stocks365 to Trade RSI Centerline Crossovers
One of the most practical advantages of using the Stocks365 signals dashboard is the ability to screen for RSI centerline crossovers across hundreds of stocks simultaneously. Instead of manually scanning charts, Stocks365 surfaces stocks where RSI is crossing or has recently crossed the 50 level, filtered by trend alignment and volume confirmation.
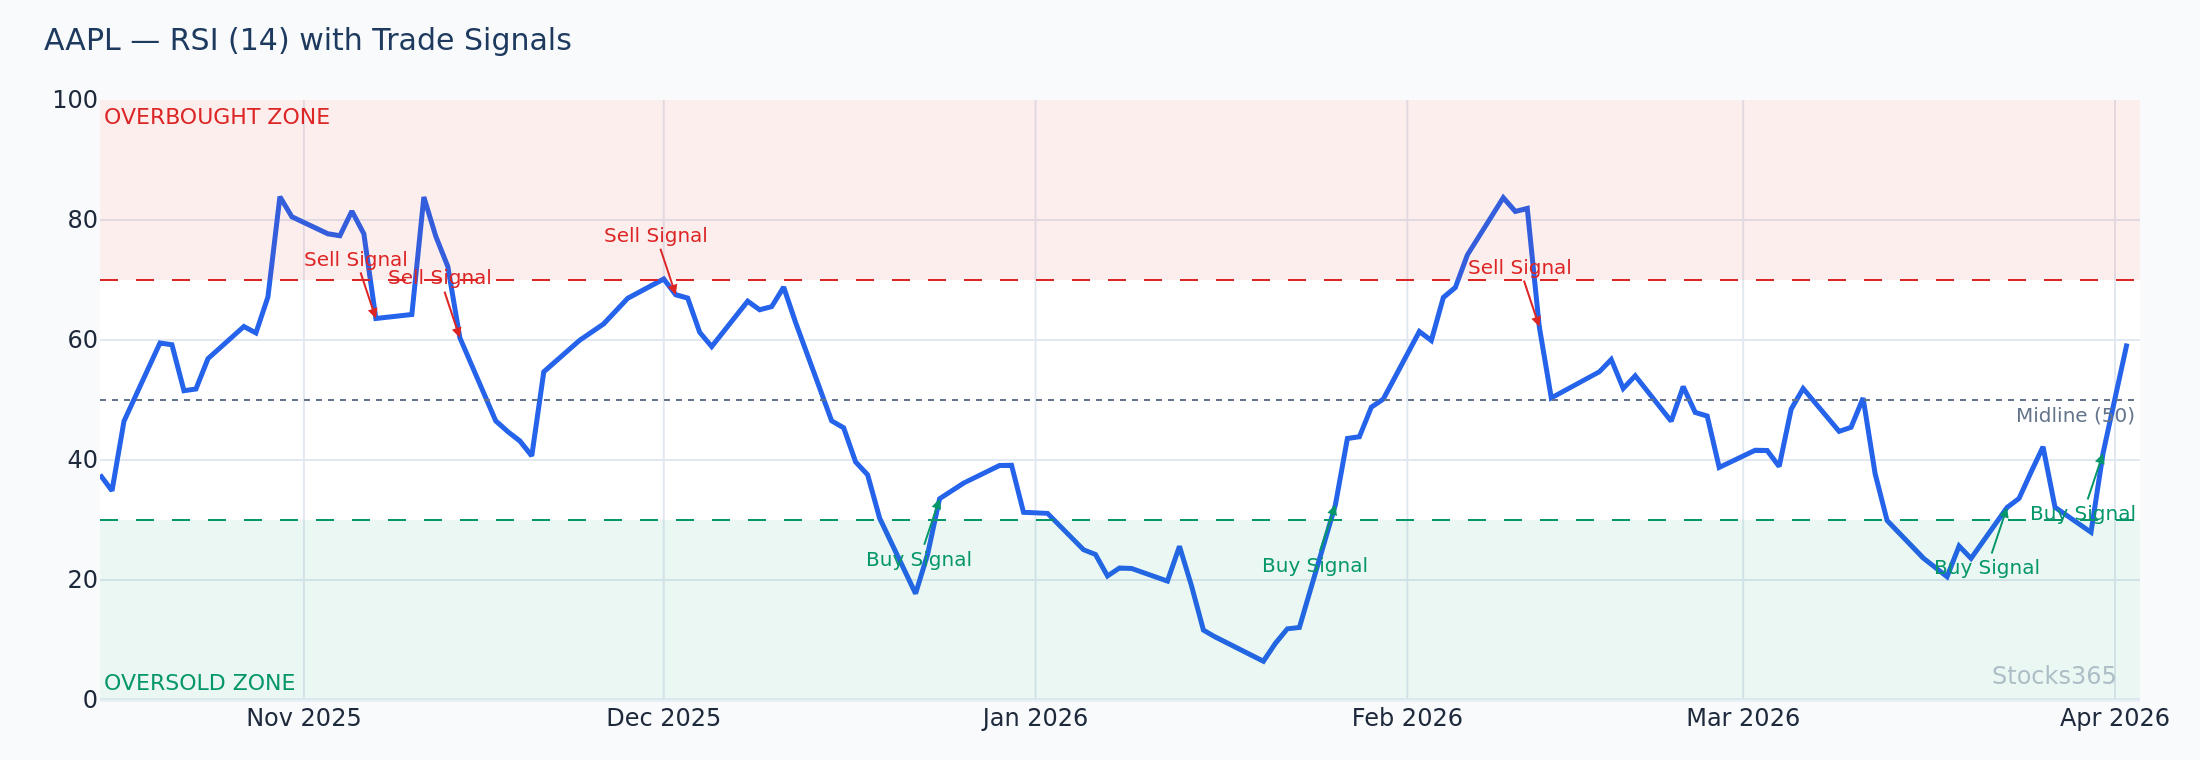
Each signal on the platform is accompanied by the Stocks365 Trust Score — a composite ranking that factors in momentum, trend strength, volume, and technical setup quality. A stock like AAPL showing a bullish RSI centerline crossover with a high Trust Score has historically provided far more reliable follow-through than a raw crossover signal without contextual filtering.
This is the difference between trading signals blindly and trading with intelligence. The platform does the heavy lifting on screening, so you can focus on execution and risk management.
Key Takeaways
📊 RSI 50 Level — Key Takeaways for Traders:
- The RSI 50 centerline represents the mathematical equilibrium between bullish and bearish momentum
- A bullish crossover (RSI moves above 50) signals that buyers now dominate — a potential trend shift or continuation
- A bearish crossover (RSI falls below 50) signals seller dominance — caution for long positions
- Always require price confirmation: a moving average cross, trendline break, or key level reclaim
- The "kiss and go" retest entry (RSI pulls back to 50 and holds) often provides superior risk-to-reward
- Use multiple timeframe alignment: higher timeframe for trend bias, lower timeframe for entry trigger
- Avoid trading centerline crossovers in choppy, trendless markets — wait for clear directional context
- Combine with RSI divergence, hidden divergence, and volume for high-conviction setups
- Stocks365's Trust Score helps filter high-quality centerline crossover signals from low-quality noise
Frequently Asked Questions
What does RSI crossing the 50 level mean?
When RSI crosses above 50, it signals that average gains over the lookback period now exceed average losses — meaning buying pressure is dominant. A cross below 50 means the opposite: sellers have the statistical edge. This midpoint acts as a dividing line between bullish and bearish momentum phases, making it a key reference level for trend-following traders.
Is the RSI 50 level more reliable than the 70/30 levels?
They serve different purposes. The 70/30 thresholds are reversal signals designed to identify extremes and potential exhaustion. The 50 level is a trend-following signal. In trending markets, centerline crossovers can be more reliable for sustained trade opportunities because you're entering earlier in the move with better risk-to-reward potential. In ranging markets, the 70/30 levels tend to perform better.
How do I avoid false signals at the RSI 50 level?
The most effective filters are: (1) require RSI to close on the new side of 50 for at least two consecutive bars before acting, (2) confirm with price action — a break of a key level, moving average, or trendline, (3) align with the higher-timeframe trend direction, and (4) check for above-average volume supporting the crossover. Using Stocks365's Trust Score can also help filter high-quality setups from false starts.
What RSI period works best for centerline crossover trading?
The default 14-period RSI is the most widely used and watched setting, making its signals more significant as more participants react to them. For swing traders on daily charts, 14 is a solid starting point. Shorter periods (9-10) are better for faster, more sensitive signals, while longer periods (21-25) reduce noise and produce higher-conviction crossovers. The best approach is to test different settings on your specific instruments — our guide on RSI settings covers this in depth.
Can the RSI 50 centerline crossover be used for all asset classes?
Yes — the RSI centerline crossover is asset-agnostic. It works on stocks, ETFs, forex pairs, commodities, and cryptocurrencies. However, different assets have different volatility profiles, which affects how often RSI crosses the centerline and how much noise is generated. Highly volatile assets (like certain cryptocurrencies) will produce more frequent and less reliable crossovers, requiring tighter confirmation rules than lower-volatility instruments like large-cap indices.