
RSI in Forex Trading: How to Use the Relative Strength Index on Currency Pairs
The Relative Strength Index (RSI) is one of the most widely used technical indicators in the world — and for good reason. In forex trading, where currency pairs move in trending and ranging cycles shaped by macroeconomic forces, central bank policy, and global risk sentiment, RSI provides traders with a reliable, data-driven lens to identify momentum shifts, exhaustion points, and high-probability entry setups.
Whether you're scalping EUR/USD on the 5-minute chart or swing trading GBP/JPY over several weeks, RSI forex trading strategies can sharpen your timing and reduce reactive, emotion-driven decisions. This guide covers everything from foundational RSI mechanics to advanced divergence techniques tailored specifically for currency pairs.
New to RSI? Before diving into forex-specific applications, check out What Is RSI? The Complete Beginner's Guide for a solid foundation, and explore How RSI Is Calculated: Formula Explained Step by Step to understand the math behind the signal.
Why RSI Works Particularly Well in Forex Markets
Forex markets have unique characteristics that make RSI especially effective compared to equity markets:
- 24-hour trading cycles: Currency markets trade around the clock five days a week, creating continuous price data that feeds cleanly into RSI calculations without overnight gaps distorting momentum readings.
- Mean-reverting tendencies: Many currency pairs, particularly range-bound crosses like EUR/CHF or AUD/NZD during low-volatility periods, exhibit strong mean-reverting behavior — exactly the environment where RSI overbought and oversold signals shine.
- Macro-driven momentum: During trending regimes driven by interest rate differentials or risk-on/risk-off flows, RSI divergence signals provide early warning of exhaustion before major reversals.
- Liquid, low-spread instruments: The tight spreads on major pairs like EUR/USD and USD/JPY mean RSI-generated entries can be executed with minimal slippage, preserving the edge the signal identifies.
Core RSI Forex Trading Strategies
1. Classic Overbought and Oversold Reversals
The most fundamental RSI forex trading strategy uses the standard 70/30 threshold levels. When RSI climbs above 70, the pair is considered overbought and a pullback or reversal may be imminent. When RSI falls below 30, it signals oversold conditions and a potential bounce.
Practical Example — EUR/USD Range Trade:
Suppose EUR/USD has been consolidating between 1.0820 and 1.0960 for three weeks during a low-volatility period ahead of a Federal Reserve decision. Price rallies to 1.0955 while RSI climbs to 74 on the 4-hour chart. A trader using RSI overbought signals might:
- Enter short near 1.0950 as RSI crosses back below 70
- Place a stop-loss at 1.0985 (above range resistance)
- Target 1.0870 (mid-range) or 1.0825 (range support) for a favorable risk-to-reward ratio
Critically, this strategy works best in ranging markets. In a strong uptrend, RSI can remain above 70 for extended periods as momentum sustains — a trap that catches many new traders. For a detailed breakdown of how to interpret these zones correctly, see our guide on RSI Overbought and Oversold Levels: Master the Signals.
2. RSI Trend-Following in Strong Forex Trends
One of the most profitable adaptations of RSI for forex is the trend-following RSI strategy, sometimes called the "RSI 40/60 method." In an established uptrend:
- RSI tends to bounce from the 40–50 zone rather than falling to 30
- RSI consistently pushes above 60–70 on momentum legs
- Buy signals occur when RSI pulls back to 40–50 and begins turning up
In a downtrend, the logic reverses: RSI bounces capped at 50–60, with sell signals triggered when RSI rallies to 50–60 and rolls over.
Practical Example — USD/JPY Trend Trade:
During a sustained USD/JPY uptrend driven by Bank of Japan yield curve policy, price is trending from 148.00 toward 152.00. Each time RSI on the daily chart pulls back to the 45–50 zone, it historically resumes upward. A trader watches for RSI to dip to 47, then turn up with a bullish engulfing candle at 149.20. Entry: 149.35, stop below the swing low at 148.60, target 151.50. The trend-following RSI approach keeps the trader aligned with the dominant macro flow rather than fading every minor rally.
3. RSI Divergence: The High-Conviction Reversal Setup
RSI divergence is arguably the most powerful signal available to forex traders. It occurs when price makes a new high (or low) while RSI fails to confirm that move — a sign that underlying momentum is deteriorating even as price continues in its current direction.
Bearish RSI Divergence Example — GBP/USD:
GBP/USD rallies from 1.2400 to a first high of 1.2720, with RSI peaking at 68. After a brief pullback to 1.2580, price pushes to a new high of 1.2790. But RSI on this second push only reaches 61 — a lower high. This bearish divergence signals exhaustion. A trader might short the pair near 1.2780 with a stop above 1.2830, targeting a move back toward 1.2600 as the divergence resolves.
Bullish RSI Divergence Example — AUD/USD:
AUD/USD falls to 0.6180 with RSI at 26 (oversold). After a relief bounce, price makes a lower low at 0.6140, but RSI only dips to 32 — a higher low. This bullish divergence, combined with a support zone at 0.6130–0.6150, creates a compelling long setup targeting 0.6280+.
For a complete breakdown of both classic and hidden divergence patterns, read RSI Divergence Explained: Master Bullish & Bearish Signals. For advanced continuation patterns, Hidden RSI Divergence: The Advanced Signal Most Traders Miss is essential reading.
Choosing the Right RSI Settings for Forex Trading
The default RSI period is 14, but forex traders frequently adjust this based on their trading style and the currency pair's volatility profile.
RSI Period Recommendations by Timeframe
- Scalping (1-min to 15-min charts): RSI(7) or RSI(9) — faster response to short-term momentum shifts on highly liquid pairs like EUR/USD and USD/JPY
- Day trading (1-hour to 4-hour charts): RSI(14) — the standard setting balances sensitivity and noise filtering effectively
- Swing trading (Daily chart): RSI(14) to RSI(21) — smoother signal reduces false positives on longer-duration setups
- Position trading (Weekly chart): RSI(21) or RSI(25) — filters out short-term noise for macro-level trend analysis
Beyond the period setting, some forex traders also adjust the overbought/oversold thresholds. In highly trending pairs (like USD/TRY or exotic crosses), using 80/20 instead of 70/30 reduces false reversal signals. Our detailed guide on RSI Settings: Master the Best Period for Your Strategy walks through this optimization process thoroughly.
Multi-Timeframe RSI Analysis for Forex
Professional forex traders rarely rely on a single timeframe. Multi-timeframe (MTF) RSI analysis allows you to align short-term entries with higher-timeframe momentum — dramatically improving win rates and trade quality.
The Top-Down RSI Framework
Here's a practical three-timeframe approach:
- Weekly chart RSI: Establishes the macro momentum bias. RSI above 50 = bullish bias; below 50 = bearish bias.
- Daily chart RSI: Identifies the intermediate setup — divergences, overbought/oversold extremes near key levels.
- 4-hour or 1-hour chart RSI: Provides the precise entry trigger — a bullish RSI cross above 30 from oversold, or a reversal from the 40–50 pullback zone.
Example — EUR/GBP Multi-Timeframe Setup:
Weekly RSI at 54 (mild bullish bias). Daily RSI drops from 62 to 42, creating a pullback opportunity. On the 4-hour chart, RSI hits 33 near a confluent support zone at 0.8480, then turns up. Entry: 0.8492, stop: 0.8455, target: 0.8570 (daily resistance). The multi-timeframe alignment increases confidence that the 4-hour RSI signal is not just noise but a meaningful pullback within a larger uptrend.
Combining RSI with Other Forex Indicators
RSI is most powerful when used with complementary tools that reduce false signals and add confluence.
RSI + Price Action (Support/Resistance)
The single most effective combination in forex. An RSI oversold reading at a key horizontal support, Fibonacci retracement level, or moving average creates a high-probability long setup. Likewise, RSI overbought at a major resistance level strengthens bearish setups considerably.
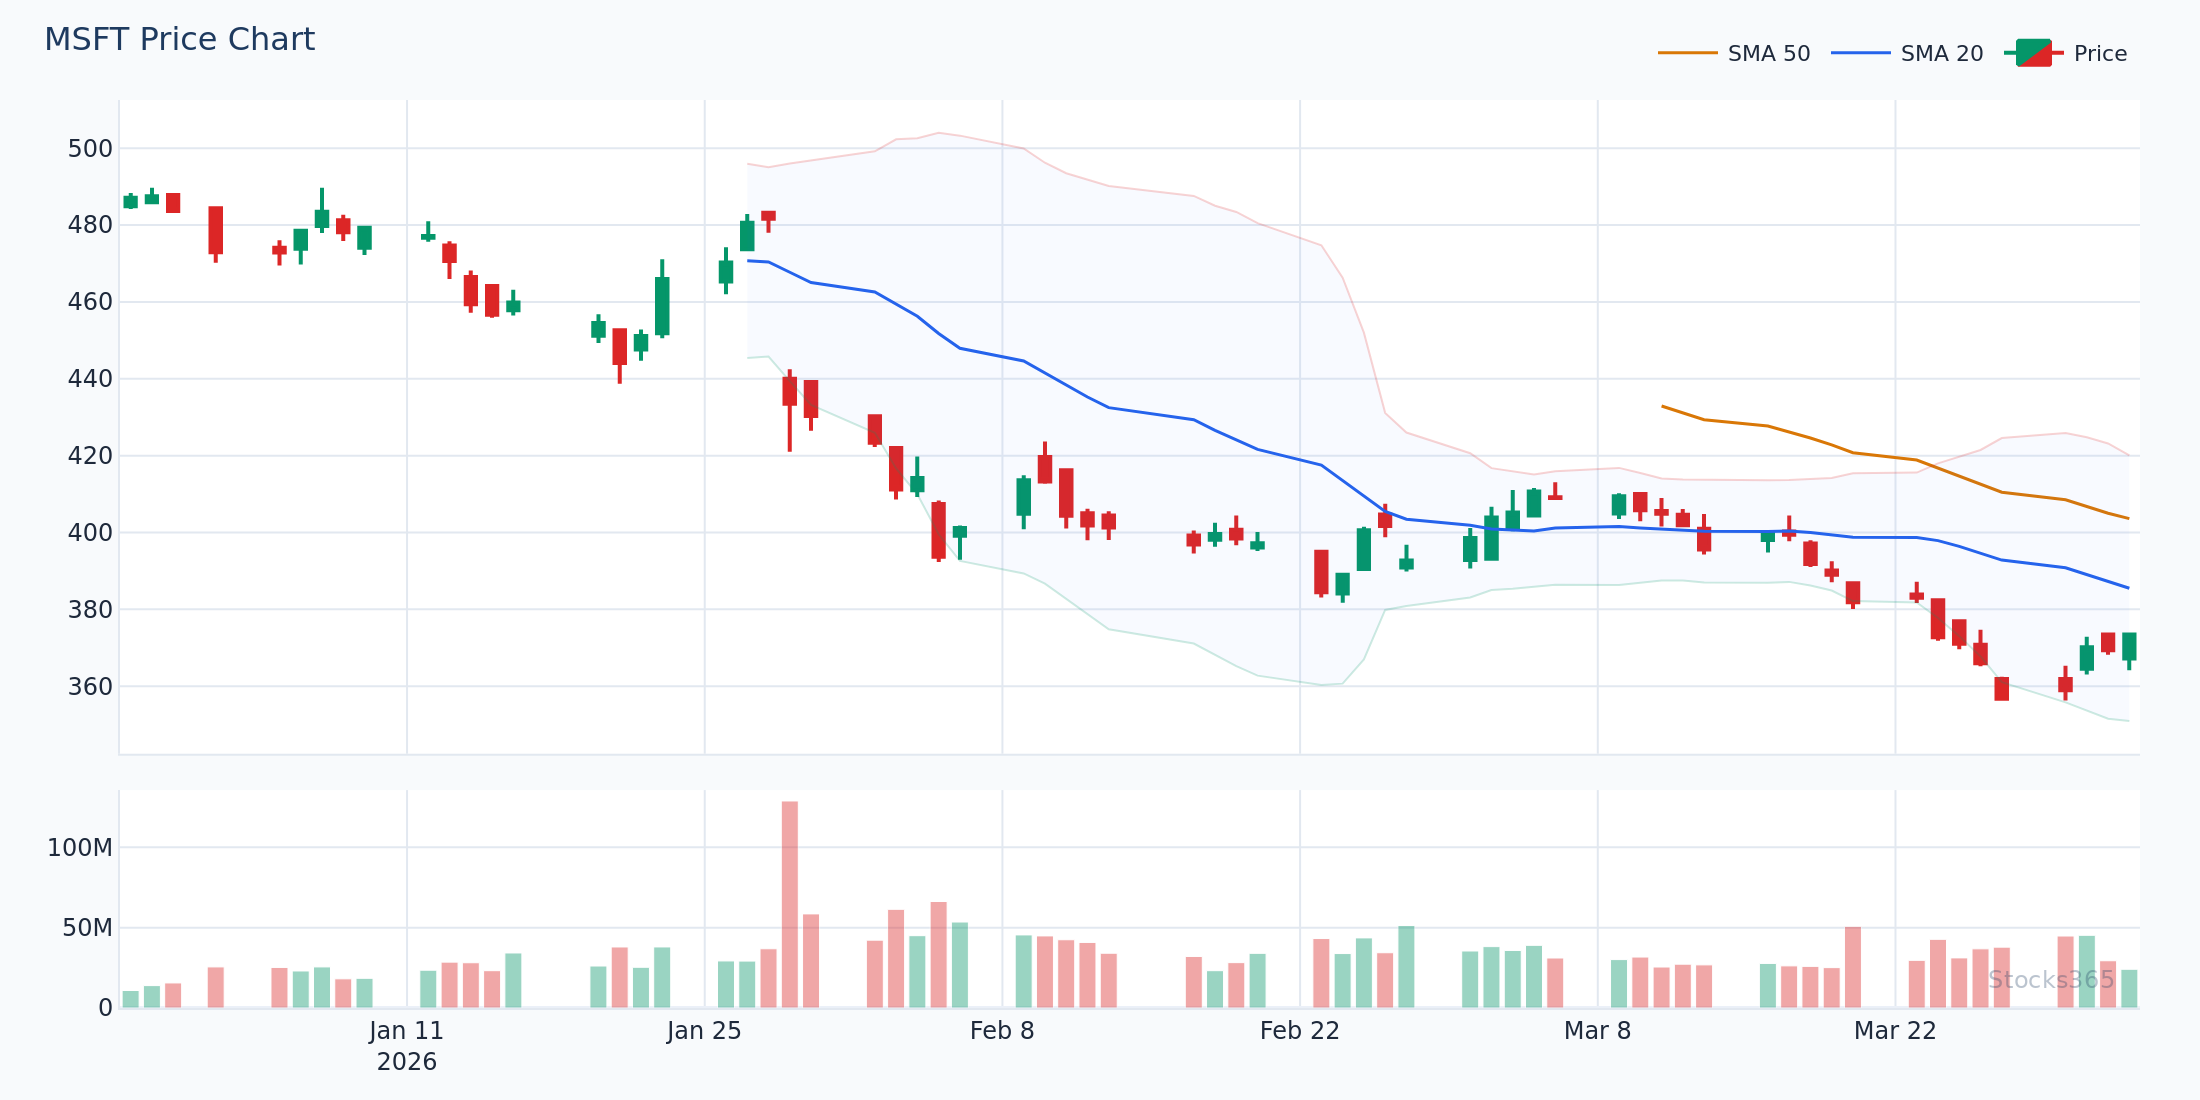
RSI + Moving Averages
Using a 50-period or 200-period SMA to define trend direction, then taking RSI signals only in the trend direction, eliminates a significant percentage of false counter-trend trades. If price is above the 200 SMA, only take RSI oversold bounces — ignore overbought sell signals unless divergence is present.
RSI + Stochastic Oscillator
Both RSI and Stochastic measure momentum, but their different calculation methods mean they sometimes diverge in their signals — offering additional insight. When both indicators simultaneously show oversold conditions at a support level, the confluence creates an especially compelling setup. Explore the differences and synergies in detail in our RSI vs Stochastic Oscillator: The Essential Guide.
RSI Forex Trading: Common Mistakes to Avoid
Even experienced traders fall into these traps when applying RSI to currency pairs:
- Blindly fading overbought readings in trending markets: During strong USD bull runs or JPY safe-haven flows, RSI can stay overbought for days. Always check the higher timeframe before fading an extreme reading.
- Ignoring fundamental catalysts: An RSI oversold signal in EUR/USD ahead of a major ECB press conference carries significant event risk. RSI doesn't know about scheduled news — you must.
- Using the same RSI settings for all pairs: Exotic pairs like USD/ZAR or USD/MXN are far more volatile than EUR/USD. A longer RSI period (21+) or wider threshold levels (80/20) reduces whipsaws on high-volatility instruments.
- No stop-loss discipline: RSI signals are probabilistic, not certain. Every trade needs a defined stop, regardless of how compelling the RSI setup looks.
- Over-relying on a single indicator: RSI alone is not a trading strategy. It's a momentum filter that works best within a structured approach that includes trend analysis, risk management, and entry confirmation.
Using Stocks365 to Enhance Your RSI Forex Analysis
At Stocks365, our trading signals dashboard integrates RSI analysis across multiple timeframes alongside our proprietary trust score system — a composite metric that factors in momentum strength, volume confirmation, and trend alignment to rate signal quality from 1 to 100.
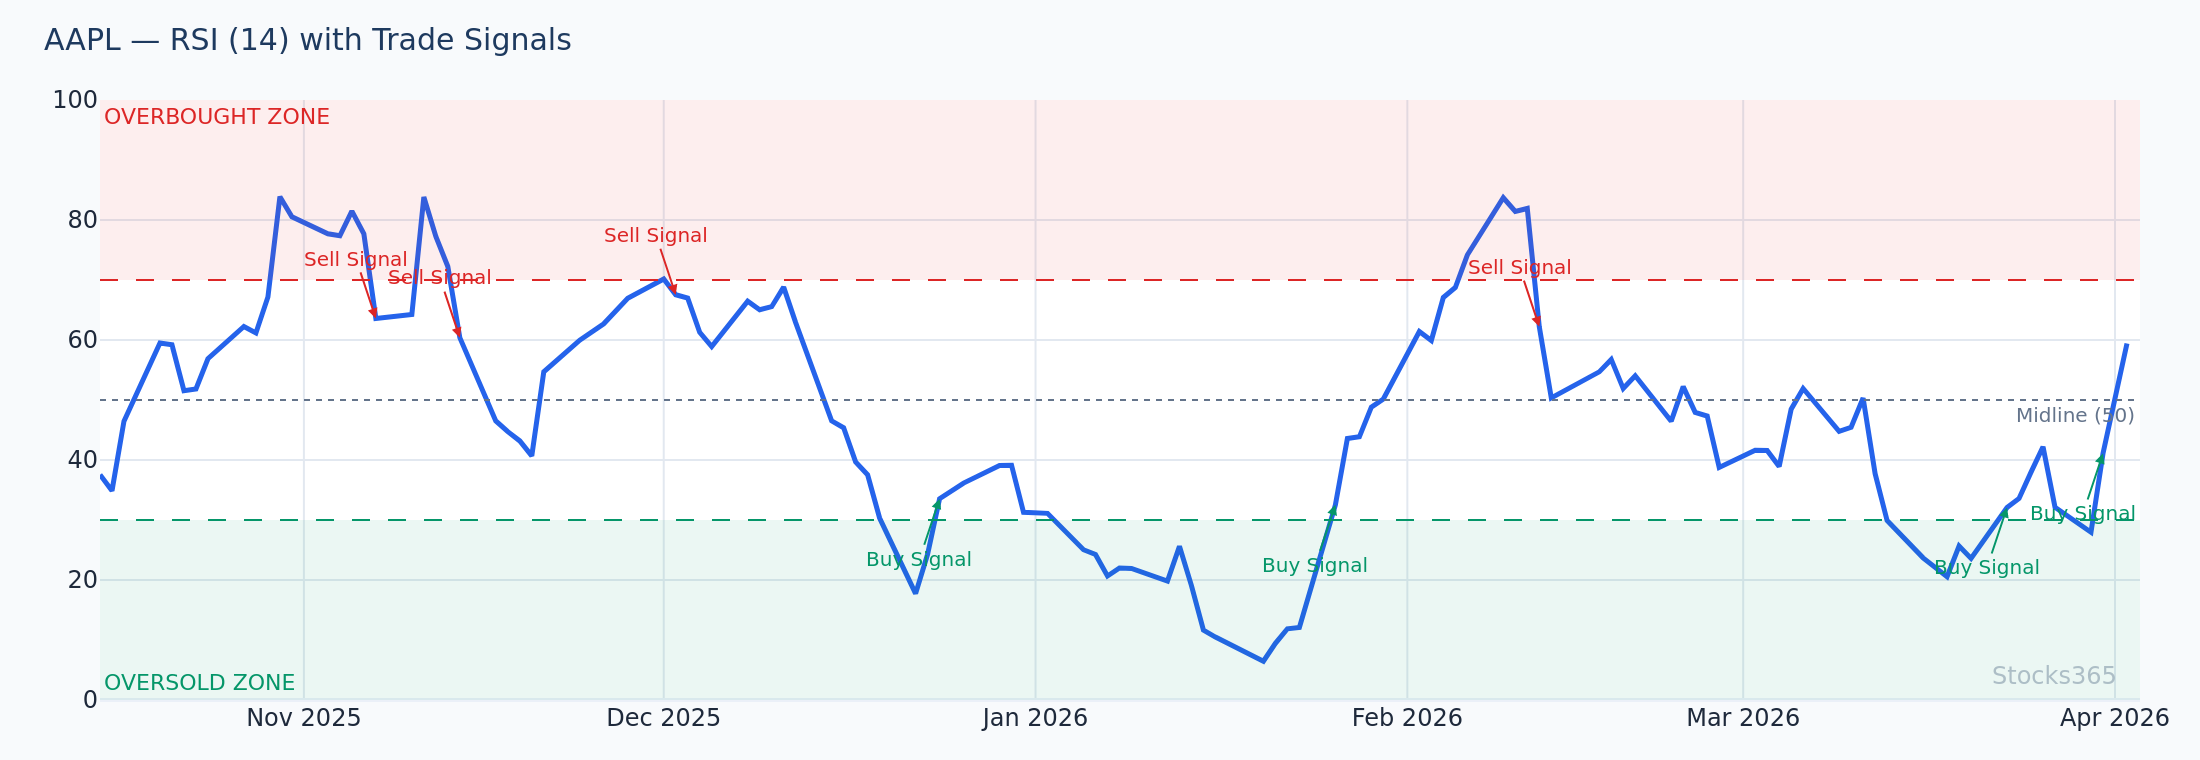
While Stocks365 is best known for equity signals (explore examples like our AAPL signal analysis), the underlying momentum methodology — including multi-timeframe RSI reading, divergence detection, and overbought/oversold assessment — is directly applicable to how professional traders structure their forex analysis. A trust score above 75 on an RSI signal, for example, indicates strong multi-factor confluence rather than an isolated indicator reading.
For a complete walkthrough of using RSI in actual trade setups from entry to exit, see our How to Use RSI in Trading: The Ultimate Step-by-Step Guide.
Key Takeaways
RSI Forex Trading — Summary of Core Principles:
- ✅ RSI works across all major, minor, and exotic currency pairs — but settings should be adjusted for volatility
- ✅ Use overbought/oversold signals primarily in ranging markets; use RSI 40/60 zone bounces in trending markets
- ✅ RSI divergence (both classic and hidden) provides some of the highest-conviction reversal and continuation signals in forex
- ✅ Multi-timeframe RSI analysis dramatically improves signal quality — always align short-term entries with higher-timeframe momentum
- ✅ Combine RSI with price action levels, moving averages, or Stochastic for additional confluence before entering trades
- ✅ Adjust RSI periods: RSI(7–9) for scalping, RSI(14) for day/swing trading, RSI(21) for position trading
- ✅ Never ignore macroeconomic events — RSI signals carry elevated risk around major central bank decisions and NFP releases
Frequently Asked Questions
What is the best RSI setting for forex trading?
The default RSI(14) is the most commonly used setting and works well for 4-hour and daily forex charts. For scalping on lower timeframes (1-min to 15-min), RSI(7) or RSI(9) provides faster signals. For longer-term swing or position trading on weekly charts, RSI(21) filters noise more effectively. The key is consistency — choose a setting that fits your timeframe and test it on the specific pair you're trading.
Does RSI work in forex the same way as in stocks?
The core mechanics are identical — RSI measures the speed and magnitude of price changes on a 0–100 scale regardless of the instrument. However, forex markets trade 24 hours a day, which means RSI accumulates data continuously without overnight gaps. Additionally, currency pairs often trend more persistently in response to interest rate differentials, requiring traders to adapt overbought/oversold thresholds and favor trend-following RSI approaches during those regimes.
How do I avoid false RSI signals in forex?
The best way to reduce false RSI signals is to require confluence before entering a trade. This means: (1) confirming the RSI signal on a higher timeframe first, (2) aligning the signal with a key price action level such as support, resistance, or a Fibonacci retracement, (3) waiting for a confirming candle pattern at the signal point, and (4) avoiding RSI signals that run directly counter to a strong macro trend unless backed by clear divergence.
Can RSI be used for scalping forex pairs?
Yes, RSI is widely used in forex scalping strategies, particularly on EUR/USD, GBP/USD, and USD/JPY due to their tight spreads and high liquidity. For scalping, RSI(7) or RSI(9) on the 1-minute to 15-minute chart with wider thresholds (80/20) typically works better than the standard RSI(14) with 70/30 levels. Scalpers often combine short-period RSI with price action patterns or Bollinger Bands to time ultra-short entries and exits.
What is RSI divergence and why does it matter for currency trading?
RSI divergence occurs when price makes a new high or low that RSI fails to confirm, signaling that underlying momentum is weakening. In forex trading, this is particularly meaningful at key structural levels — a bearish divergence at major resistance on EUR/USD, for example, often precedes a notable pullback or reversal. Divergence is one of the few RSI signals that works well in both trending and ranging markets, making it one of the most versatile tools available to currency traders.